

INTRODUCTION
Patellofemoral pain (PFP) is characterized by retro, anteropatellar or diffuse peripatellar knee pain during activities such as walking, running, squatting, climbing and descending stairs.1,2 Eleven to seventeen percent of patients presenting with knee pain to a general practitioner are classified with PFP.1 The annual prevalence of PFP is 22.7% and 28.9% for the general population and adolescents, respectively,3 with most patients being young, physically active women.4–8
For most patients, PFP consists of a chronic musculoskeletal condition with periods of remission of symptoms.9 Long-term cohort studies9–11 showed that most individuals with idiopathic knee pain or PFP have persistent symptoms several years after the onset of condition. This recurrence of PFP has been associated with the development of knee osteoarthritis, with subjects undergoing total knee arthroplasty often reporting history of PFP during adolescence.12 It has been hypothesized that PFP and patellofemoral osteoarthritis form a continuum of disease.13
The factors associated with the reoccurrence of PFP are mostly unknown. Previous studies have identified biomechanical changes in subjects with PFP such as decreased knee flexion, increased hip adduction and internal rotation, and increased ipsilateral trunk inclination during walking, running and squatting.14,15 These changes, however, have been found in individuals currently experiencing pain and it is unclear whether changes have emerged from pain or were present before the onset of PFP. Additionally, it is not known whether the observed changes in kinematics disappear in the remission phase of PFP. The investigation of movement patterns in individuals in remission phase of PFP may help in the understanding of pain reoccurrence in PFP and help clinicians to manage this chronic musculoskeletal condition and set goals in rehabilitation process.
The aim of this study was to compare 3D kinematics during walking and the SLS between individuals with history of PFP in remission phase and a control group without history of lower limb injuries and PFP. It was hypothesized that individuals in the remission phase of PFP would show different kinematic movement patterns compared to the control group. Specifically, it was expected that decreased knee flexion, increased knee abduction, increased hip adduction and internal rotation, and increased ispilateral trunk inclination would be observed in the PFP group compared to control.
MATERIAL AND METHODS
This was a cross-sectional case control study with a convenience sample. This study was approved by the Ethics and Research Committee with Human Beings of the University of the State of Santa Catarina (Florianopolis, Brazil) and all the individuals consented to participate voluntarily. This study was conducted between the years 2017 and 2018.
Participants
The participants were recruited from the database of a local rehabilitation facility and from the local community. Individuals of both sexes aged between 18 and 50 years old participated in this study. The experimental group (EG) was composed by individuals with onset of PFP for at least one year and in phase of remission of symptoms (presenting knee pain less than 3 on visual analogue scale - VAS). Cut-off for pain was based on the most commonly used classification for PFP: presence of pain equal or greater than 3 on a VAS during functional tasks such as squatting, climbing and descending stairs, walking, jumping, running or sitting for a long time with a knee flexed.1 Subjects were excluded if they presented (i) pain equal to or greater than 3 on VAS scale during the execution of the SLS or walking, (ii) reported any perceived functional limitation in the execution of their daily activities or that limited their practice of regular physical activity, or (iii) reported lower limb surgeries in the last year, chronic articular (rheumatologic) diseases, signs or symptoms of another pathology in the knee, pregnancy, and/or diagnosis of cancer. A control group (CG) paired by sex, age (± 2 years) and body mass index (± 0.5 kg.m-2) and had never presented history of PFP or any other knee condition was also included. All the previously mentioned exclusion criteria for the EG were also considered for the CG.
Only the limb that presented history of PFP was considered in the analysis. In cases of bilateral PFP, the knee referred to present more symptoms at the time of the last occurrence of PFP was included. In the case of similar bilateral symptoms, the selection was random. PFP individuals were matched to the CG according to limb dominance.
Thirteen participants were included in both EG and CG. Table 1 shows the summary of demographic information of participants.
Instruments
For the kinematic data collection, a 10-camera Vicon Bonita MX® motion analysis system (Oxford Metrics, Oxford, UK) sampling at 100 Hz was used. Two AMTI OR6-7® force platforms (Advanced Mechanical Technology, Watertown, USA) were used to record ground reaction forces at a frequency of 1000 Hz. Data processing and analysis were performed in Visual 3D® (C-Motion Inc., MA, US).
For measuring the participants’ physical activity level, the short form of the International Physical Activity Questionnaire (IPAQ) – Portuguese version was used.16 The IPAQ classifies individuals by levels of physical activity, based on both the total volume and the number of day/sessions of practice as follows17 ‘high’ (performing vigorous-intensity activity on at least 3 days per week, achieving a minimum total physical activity of 1500 metabolic equivalents-minutes per week (MET-min/week) or seven or more days per week of any combination of walking, moderate-intensity or vigorous-intensity activities achieving a minimum total physical activity of 3000 MET-minutes/week; ‘moderate’ (performing three or more days per week of vigorous-intensity activity during at least 20 minutes per day or five or more days per week of moderate-intensity activity and/or walking for at least 30 minutes per day or five or more days per week of any combination of walking, moderate-intensity or vigorous intensity activities, achieving a minimum total physical activity of 600 MET-minutes/week. Individuals who do not fit into any of these categories are considered to have a ‘low’ physical activity level. The combined total physical activity as a continuous score (which corresponds to the weighted sum of walking, moderate- and vigorous-intensity activities scores) was calculated for all participants and expressed in MET-minutes/week.17
Participants’ knee functional level was assessed through the Lysholm Questionnaire - Portuguese version.18 The Lysholm score is based in eight domains: limp (5 points), support (5 points), pain (25 points), instability (25 points), locking (15 points), swelling (10 points), stair-climbing (10 points), and squatting (5 points), with a final score ranging from 95 to 100 points being classified as ‘excellent’; 84 to 94 points as ‘good’; 65 to 83 as ‘fair’ and values equal or below 64 points as ‘poor’.18,19
Data Collection
The participants were contacted by phone or email with preliminary information to schedule the data collection. Upon arrival at the laboratory, participants answered questions regarding personal information required to assess inclusion and exclusion criteria. Subjects that met the criteria responded to the Lysholm and IPAQ questionnaires. Then 32 reflexive markers of 20 mm in diameter each were placed in the following landmarks: first and fifth metatarsal head, calcaneus, medial and lateral malleoli, tibial tuberosity, fibular head, medial and lateral condyles of femur, lateral thigh, greater trochanter of femur, anterior superior iliac spine, posterior superior iliac spine, the tenth thoracic (T10) spinal process, the seventh cervical (C7) spinal process, acromion, jugular notch and xiphoid process. Markers of the appendicular skeleton were placed bilaterally. All participants wore elastic (lycra) swimsuits to increase skin adhesion and not disrupt the location of the markers, and they remained barefoot during data collection.
Afterwards, the familiarization with the SLS started. First, the participant was asked to perform a squat up to 60º of knee flexion with the researcher using a manual goniometer to confirm the position. At this position, the distance from the gluteal fold to the ground was measured and a tripod was positioned behind the participant to touch the participant buttocks informing the end of the descendent phase during the experimental trials. Participants were asked to perform two sets of four squats and five SLS with both lower limbs with last set including the use of a metronome to control cadence at 45 beats per minute (bpm). If the participant still had difficulty in performing the movement at the required amplitude and cadence, additional repetitions were performed until reaching the appropriate performance. The trial was composed of five SLSs with 60° of maximum knee flexion at 45 bpm, with the arms resting on the waist and the non-stance limb held in line with the stance limb and the knee flexed at approximately 90°. The trial was not considered valid in cases where the participant touched the floor with the contralateral limb. Before and at the end of each trial, participants were asked whether any pain was felt, and the VAS was used if pain was present. Three trials consisting of five SLSs were performed for each lower limb.
After the SLS trials, walking analysis was initiated. Participants were instructed to walk at a self-selected speed on a 5-m walkway. At mid-distance of the walkway, two force platforms were located. The participants were instructed to walk at a cadence of 100 bpm and when they naturally reached the proposed cadence, six walking trials were recorded. In three of six trials, the participant stepped on the force platform with the right foot and, in the other three, with the left foot. The trial was not considered valid in case the participant stepped with part of the foot outside the force platform. Three trials for each side were used for analysis. Before and at the end of each trial, it was asked about the eventual presence of pain in the same way we did during the SLS trials.
Within-trial reliability of the SLS and walking variables for each joint/segment and plane of movement was assessed using the intraclass correlation coefficient (ICC, absolute agreement). ICC values higher than 0.8 were considered as excellent, between 0.6 and 0.8 as good, between 0.4 to 0.6 as moderate and below 0.4 as poor.20 The within-trial reliability for the kinematic variables of SLS and walking was generally excellent. Of the 51 variables analyzed, 45 presented excellent reliability and six presented good reliability.
Data Analysis
Kinematic data were processed through Visual 3D® (C-Motion Inc., MA, US) using a 6-degree of freedom model. For the calculation of the joint angles, it was used the Cardan X-Y-Z angles sequence, representing, respectively, flexion/extension, adduction/abduction, and axial rotation. For the ankle, knee and hip joints, the local coordinate system was used, and for the trunk the global coordinate system was used. Results are shown with positive values for angular position indicating flexion, adduction, and internal rotation in the sagittal, frontal and transverse plane respectively. Kinematic data were filtered using a fourth-order zero-lag Butterworth low-pass filter with a cut-off frequency of 12 Hz.
The instant of interest for the SLS was the peak of knee flexion (PK60). Then joint angles for the ankle, knee and hip were extracted at this event. For the trunk, the range of movement (ROM) was calculated for each repetition of the SLS The values of the three central repetitions from each of the three trials included in the analysis were extracted and averaged. Thus, a grand mean of the three trials was calculated. For walking trials, kinematics of ankle, knee and hip were extracted at the first peak (Fy1), the valley (Fymin) and at the second peak (Fy2) of the vertical component of the ground reaction force. The three trials were used to compose the mean using the limb of interest.
Statistics
Demographic data and level of functionality were treated by descriptive statistics (mean and standard deviation) and compared by an unpaired T-Test. Median and interquartile ranges were computed for the combined total physical activity score17 and Mann-Whitney’s U test was used to compare groups. The physical activity level of participants, as a categorical variable (low, moderate and high), was compared between CG an EG groups by using the Fisher’s Exact test. For the analysis of walking, a multivariate analysis of variance (MANOVA) was conducted with events (Fy1, Fymin and Fy2), joint (ankle, knee and hip) and plane of movement (sagittal, frontal and transverse) as repeated measure factors, group (CG and EG) as independent factor and joint position as dependent variable. For SLS two MANOVAs were used. In the first MANOVA, joint (ankle, knee and hip) and plane of movement (sagittal, frontal and transverse) were used as repeated measure factors, group (CG and EG) as independent factor and joint position as dependent variable. In the second MANOVA, plane of movement (sagittal, frontal and transverse) was used as repeated measure factors, group (CG and EG) as independent factor and trunk ROM as dependent variable. Tukey post-hoc test was applied for multiple comparisons. The partial Eta square (ηp2) was used to measure the effect sizes considering that an ηp2 between 0.01 and 0.06 was considered small, between 0.061 and 0.14 was considered medium, and above 0.14 large.21 Statistical software v.8 (StatSoft, USA) was used with an alpha of 0.05 for all tests.
RESULTS
The Lysholm scores for knee function and symptoms were lower (t = 209.9, p = 0.004) in the EG (78±10 points, classified as regular) compared to the CG (93±5 points, classified as excellent). All participants of the EG referred the presence of pain in the ‘pain domain’ of the Lysholm questionnaire. For most of them, such pain (lower than 3 on VAS) was inconstant (n=11) with only two individuals reporting constant pain. Most of the individuals that reported inconstant pain (10 out of 11), informed that pain was triggered during heavy exercises.
The median [interquartile range] of the total physical activity score was similar for the EG (1708[1196] MET-minutes/week) and CG (1914[1319] MET-minutes/week), and no difference was found between them (U = 79.0, p = 0.801). Both groups were similar with regards to the physical activity level (p = 0.480). All participants in CG and most in EG (n=11) were classified as having a moderate physical activity level and two EG participants as having a high physical activity level.
Walking Kinematics
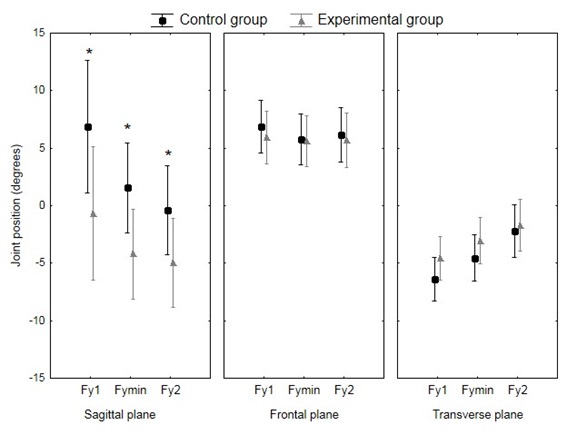
There were no interactions for the factors (i) event, joint, plane of movement and group [F (8,192) = 0.54; p = 0.825; ηp2 = 0.022], (ii) event, plane of movement and group [F (4,96) = 1.70; p = 0.156; ηp2 = 0.066], and (iii) event, joint and group [F (4,96) = 1.03; p = 0.394; ηp2 = 0.041]. There was interaction with a large effect size between event, plane of movement and group factors [F (4,96) = 3.95; p = 0.0051; ηp2 = 0.141]. Tukey’s post hoc test showed that the EG participants presented decreased movement in the sagittal plane (less ankle dorsiflexion, knee and hip flexion) during walking at the three ground reaction force events (Fy1, Fymin and Fy2) compared to the CG (Figure 1). No differences between groups for the frontal and transverse planes were observed.
_at.jpeg)
Single Leg Squat Kinematics
When analyzing the joint positions at PK60 there was no interaction between the factors joint, plane of movement and group [F (4,96) = 0.916; p = 0.458; ηp2 = 0.036]. No other interaction or main effects involving the factor group were observed (Figure 2).

For the trunk ROM during SLS (Figure 3), no interaction between group and plane of movement was found [F (2,48) = 0.781; p = 0.464; ηp2 = 0.032]. Although not statistically significant, a trend of main effect for group with moderate effect size was observed [F (1,24) = 3.477; p = 0.075; ηp2 = 0.127]. Such trend possibly occurred due to larger ROM in the transverse and frontal planes presented by the EG compared to the CG (Figure 3).

DISCUSSION
During walking and SLS, no between-groups differences were observed in the ankle, knee and hip in the frontal and transverse planes. In agreement with the hypothesis, less movement in the sagittal plane, including reduced knee flexion, in the EG compared to the CG during walking as well a trend towards more movement in the trunk in the EG compared to the CG during the SLS was observed.
The decreased knee and hip flexion found in walking for the EG is in agreement with a previous study on individuals with PFP.22 In the current study, it was shown that this kinematic pattern might also present in the remission phase of PFP. In individuals in the acute phase of PFP, this movement pattern is often considered a strategy to avoid an increase in the external knee flexion moment and patellofemoral joint stress.23 This has been called quadriceps avoidance.24 It is possible that the participants of the present study, even in the remission phase of PFP, still retain the movement pattern of the period with PFP or that this movement pattern might preclude the onset of symptoms.
Previous authors analyzing the kinematics of functional tasks (e.g., squats, stair descent and running) in individuals with PFP have reported increased hip internal rotation, hip adduction and knee abduction when comparing them to a control group.25,26 These kinematic patterns usually associated with PFP were not observed in the EG of the present study during the SLS. The EG and CG groups behaved very similarly in the analysis of this task probably because the EG subjects presented minimal pain (<3 in VAS) in their daily live. Thus, the changes in lower limb frontal and transverse planes kinematics presented by PFP individuals in comparison to healthy controls24,25 might be a compensatory pattern possibly caused by substantial pain.25,27 The results of this study indicate that individuals in the remission phase of PFP perform a typically normal pattern instead of presenting these compensatory movements.
With regard to the trunk ROM during SLS, the results of the present study indicate a trend (did not reach statistical significance) for the occurrence of a greater contralateral inclination and greater ipsilateral rotation in the EG compared to the CG. In a previous study25 investigating individuals with PFP (no specification on the degree of pain, but with subjects diagnosed), an increase in ipsilateral inclination during the execution of SLS beyond 60º of knee flexion was observed when compared to a control group. In an exploratory analysis in this study, including both lower limbs in the individuals with bilateral PFP (n = 17) versus matched controls, statistical significance was met. Changes in trunk position are known to affect the load at lower limb joints,28 including the knee29,30 and rehabilitation programs often focus on correcting the trunk movement, aiming to bring it closer to those observed and pain free subjects.
The relationship between the severity of PFP and movement pattern alterations is an issue often discussed in the literature.25–27 While a movement pattern may be a contributing factor to the development of pain31 there is no consensus, and it is possible that changes reflect a compensatory mechanism to pain. In this study, the presence of pain in the EG was minimal to the point of characterizing a remission phase of PFP. Nevertheless, it was observed decreased movement in the sagittal plane during walking and increased movement of trunk during the SLS. It seems likely that with time and rehabilitation efforts, symptoms may improve, while some kinematic changes persist. Whether correcting these movements might protect persons with history of PFP and keep them in the remission phase is beyond the scope of this study and future studies testing such hypothesis are warranted.
Participants of both groups presented similar levels of physical activity and were considered active according to the IPAQ classification. A similar result was found in the studies with symptomatic participants, demonstrating that even with PFP, the participants are physically active.4,5 However, despite reporting no limitations in their daily routine in the interview, individuals in the EG showed a Lysholm score that indicated regular knee functionality, and not excellent as found for the control group. The similar physical activity level between groups is in line with the perceived absence of functional limitation in both groups, as set in our inclusion criteria. Previous studies have suggested that even higher-level athletes may not reach the excellent category in the Lysholm and that scores for individuals that consider their knee function as normal may range from 43 to 100.32 The results of the Lysholm scores, however, do seem to indicate that the participants in our EG presented with residual limitations in their knee functionality. The lower functionality score in the EG compared to the CG resulted from different combinations of knee instability, pain during heavy exercise, slightly impaired stairs execution and impaired squat execution. It is possible that the persistent kinematic alterations are related to the functional deficit observed. Interestingly, this deficit did not seem to affect physical activity level, as shown by the findings of the IPAQ.
The sample of this study was small; however, the statistical models of this study were sensitive to a medium to large effect sizes and most of the previously conducted studies focusing on the kinematics of individuals with PFP included a similar number of participants.14,25,26 Walking and squatting trials were not randomized; therefore it is possible that the differences observed during walking might depend on the execution of a previous set of squats. Walking analysis is a useful tool to identify movement pattern alterations in subjects with PFP, it can identify several important clinical changes29 might not be sensitive if tested in isolation.
CONCLUSION
The results of this study indicate that there are changes in walking and single-leg squat kinematics in subjects in the remission phase of PFP when compared to healthy controls. Specifically, the experimental group showed smaller angular changes in the sagittal plane (less ankle dorsiflexion, knee and hip flexion) during walking and greater trunk angular movement during single-leg squatting than the control participants. Therefore, differences in walking and SLS could contribute to patellofemoral pain recurrence. The recurrence of PFP is high and identifying deficits that persist in the remission phase can help provide background information needed for the design of appropriate intervention strategies and may also assist in our understanding of the relationship between pain and movement patterns alterations in individuals with PFP.
Conflict of Interest
The authors report no conflicts of interest or bias in this work.