INTRODUCTION
Baseball is a popular sport with approximately 13-17 million athletes participating across the U.S.1–3 Youth (9-12 years) and adolescent (13-18 years) players comprise the majority of this population participating at the club and high school levels.1–4 Despite increased awareness of factors related to athletic performance and injury prevention, youth and adolescent baseball players continue to sustain injuries at alarming rates.5–13 The incidence of baseball-related overuse injuries in youth and adolescent players reportedly ranges between 1.3 – 4.0 injuries per 1,000 athletic exposures.2,14,15 The majority of baseball-related overuse injuries occur at the upper extremity (UE), specifically the shoulder and elbow, however few studies have assessed how risk factors change as young athletes grow and develop over time.2,14,16
Upper extremity muscle strength is an important factor in the assessment of athletic performance and injury prevention in baseball players.7,17–26 Strength is defined as the amount of force a muscle can maximally produce during a single repetition.27–29 Clinicians and researchers routinely use a battery of strength measures for performance assessments, injury diagnostics and return to sport decisions following injury.7,19,24,30 While upper extremity strength measures have been reported at the collegiate and professional levels, little to no data is available at the youth and adolescent levels.7,18–25,30 Establishing an objective, reliable and clinically accessible method for evaluating how strength changes as an athlete grows is imperative in understanding shoulder function, performance and injury risk in youth baseball players.7,30
Despite acknowledging that anthropometric measurements, such as height and weight, influence the body’s ability to produce force and thereby muscle strength, normalization methods accounting for body size are inconsistently reported in the literature.18,21,22,27,29 The evaluation of isometric strength in youth and adolescent athletes is inherently different from that of collegiate and professional athletes.27,29,31 Height, weight and neuromuscular control can fluctuate frequently in physically developing populations with the potential to rapidly change over short periods of time. Performance assessments that rely solely upon absolute measures, without normalization, may lack the ability to discern changes in muscle strength from changes in body size in youth populations.27–29 Accounting for these alterations in growth and development through normalization is critical to accurately assessing muscle function and injury risk in young athletes.27,29,31
There is a notable gap in the literature surrounding the evaluation and normalization of shoulder strength in youth baseball players. Multiple methods have been developed to normalize lower extremity muscle strength, particularly in non-athletic and non-typically developing populations.28,29,32–35 Only one study has been conducted in the upper extremity, using percent (%) of non-dominant strength to normalize dominant strength in the shoulders of adolescent throwers.7 Using anthropometric measures such as body mass, body mass index (BMI), height and limb length to normalize shoulder strength has not been studied. Determining a reliable and reproducible method for evaluating strength and changes in strength over time is imperative for assessing physically developing populations over time.27,29,32 The purposes of this study were to 1) compare the measurement properties of five potential methods for normalizing isometric shoulder strength in a cohort of 9-12 year old male baseball players and 2) examine the relationship between normalized isometric shoulder strength and ball velocity in a cohort of 9-12 year old male baseball players.
METHODS
Study Population
One hundred and fifty-nine competitive male youth baseball players volunteered to participate in this study. All players in this study were recruited from local baseball clubs, baseball tournaments and little leagues in the Upstate Region of South Carolina. All players were male, between the ages of 9-12 years and uninjured at the time of initial examination. Players were excluded from the study if they (1) reported any injuries that currently restricted their ability to participate in baseball activities or (2) reported a shoulder or elbow injury that required medical attention during the three months prior to initial examination. The University of South Carolina’s Institutional Review Board (IRB) approved this study. Parental consent and athlete assent were obtained for each participant enrolled.
Instruments
Height, weight and ulnar length were measured using a portable statiometer, digital weight scale and tape measure, respectively. Athletes were asked to remove their footwear for anthropometric measurements. Height and ulnar length were recorded to the nearest 0.5 centimeter (cm) while weight was recorded to the nearest 0.1 kilogram (kg). Isometric shoulder strength was measured using a Lafayette Manual Muscle Tester hand-held dynamometer (Lafayette Instrument Company, Lafayette, IN, USA). All isometric strength measurements were performed by the lead researcher who demonstrated excellent intra-rater reliability prior to initial data collection (ICC2,1 = 0.94-0.99). Ball velocity was assessed using a Stalker Sport Radar Gun (Stalker Radar, Richardson, TX, USA).
Procedures
At the time of study enrollment, baseline height, weight and ulnar length measurements were assessed for each participant followed by isometric shoulder strength in both the dominant and non-dominant arms. Two repetitions of each strength measure were recorded per arm and averaged for statistical analysis. Isometric shoulder strength was assessed bilaterally using a Lafayette Manual Muscle Tester hand-held dynamometer (HHD) and methods previously reported in the literature.19 Isometric shoulder strength measures included abduction in the scapular plane (scaption) at 90°, external rotation (ER) at 0°, ER at 90° and internal rotation (IR) at 90° for the dominant and non-dominant arms. Make tests were used for each isometric strength measure based on higher reliability when compared to break tests in HHD.36 Athletes were instructed to exert maximal effort as the examiner stabilized HHD. The peak force of each produced for each repetition was then recorded.36 Scaption and ER at 0° forces were measured in the seated position. Scaption was measured with the dynamometer placed 5 cm distal to the cubital fossa while ER at 0° was measured with the dynamometer placed on the dorsal aspect of the forearm, 2 cm proximal to ulnar styloid process. External rotation at 90° and IR at 90° were measured in the prone position with the shoulder in 90° of abduction, 90° of ER and 90° of elbow flexion. For ER at 90°, the dynamometer was placed on the dorsal aspect of the forearm, 2 cm proximal to ulnar styloid process. Internal rotation at 90° was assessed in a similar fashion, however the shoulder was in a state of neutral rotation and the dynamometer was placed on the volar aspect of the forearm. Each participant was asked to provide maximal effort throughout each trial during examination.19,37 Isometric shoulder strength was then normalized prior to statistical analysis using five separate methods: body mass, BMI, height, ulnar length and % of non-dominant shoulder strength (Table 1).7
Height, weight, ulnar length and isometric shoulder strength measurements were re-assessed in a subset of participants (n = 58) to examine changes in body size and strength over a six-month period. Previous literature has shown six months to be a sufficient amount of time to objectively detect changes in body size, thereby impacting strength, in physically developing populations.29,38 Isometric shoulder strength measures were normalized again for statistical analysis using the five previously stated methods: body mass, BMI, height, ulnar length and % of non-dominant shoulder strength (Table 1).7
Throwing performance was assessed using ball velocity during an overhead throw. This measure was assessed in a subset of participants (n = 80). Following a warm up period during team practice, participants were asked to throw three balls, using maximal effort, to a specified target 46 feet away. All throws were performed on flat ground. A Stalker Sport Radar Gun (Stalker Radar, Richardson, TX, USA) was used to record the velocity of each throw in miles per hour (mph). The three throws were recorded and averaged for statistical analysis.
Statistical Analysis
Means and standard deviations (SD) were calculated across all participants for the dependent variables: height, weight, BMI and normalized shoulder strength measures. Reliability was assessed for all baseline and follow-up strength measures using intraclass correlation coefficients (ICC) with corresponding 95% confidence intervals (CI).39 Standard errors of measurement (SEM) were also calculated to determine the absolute reliability of each strength measure using the largest SD in the formula 39 Individual SEMs were then used to calculate corresponding minimal detectable change (MDC95) values for each of the normalized strength measures using the formula 39 Mean change scores were calculated for each normalized strength measure by subtracting the baseline value from its corresponding follow-up value. Effect sizes were then determined, using partial eta squared (η2), to identify the magnitude of change detected between the two time points for each of the normalized strength measures. A method’s ability to detect changes in strength over time was determined for each strength measure using two criteria: (1) whether the observed change score exceeded the corresponding MDC95 and (2) the measure’s effect size. Bivariate Pearson correlation coefficients and linear regression models were used to examine the relationships between the normalized isometric shoulder strength measures and ball velocity in youth baseball players. The method with the most consistent measurement properties for normalizing isometric shoulder strength in youth baseball players was determined based on each measure’s test-retest reliability, ability to detect changes over time and strength of association with ball velocity. Statistical significance and power criteria were set a priori at 0.05 and 0.80, respectively. A priori power analyses were performed, using a small (0.20) effect size to determine the power needed to detect changes in shoulder strength over time. A moderate (0.40) effect size was used to determine the power needed to assess the significance of association between strength and ball velocity in youth throwers. The effect sizes for these comparisons were calculated using pilot data collected in previous studies. An estimated sample of at least 46 players was determined to be necessary to detect statistically significant differences in strength over time as well as significant associations between strength and ball velocity. All statistical analyses were performed using SPSS Statistics 21.0 (SPSS Inc., Chicago, IL, USA) software.
RESULTS
Reliability of Normalized Shoulder Strength
Baseline and follow-up anthropometric characteristics of the youth baseball players included in this study are reported in Table 2. The anthropometric data taken at each time point was then used to normalize each of the shoulder strength measures assessed at baseline and then again at the six-month follow-up. Normalized dominant isometric shoulder strength was the main variable of interest. Intra-rater reliability across the four baseline and four follow-up strength measures using the five separate normalization methods were: body mass ICC2,1 0.97-0.98, BMI ICC2,1 0.95-0.98, height ICC2,1 0.94-0.98, ulnar length ICC2,1 0.98-0.99 and % of non-dominant shoulder strength ICC2,1 0.80-0.98. Their respective SEM values were: body mass 0.46-0.63%, BMI 0.95-1.16 m2, height 0.12-0.28 kg/m, ulnar length 0.39-0.69 Nm and % of non-dominant shoulder strength 4.15-15.00%. All five normalization methods demonstrated good to excellent reliability across each of the four shoulder strength measures with some variability in the SEM values reported.
Ability to Detect Changes in Shoulder Strength
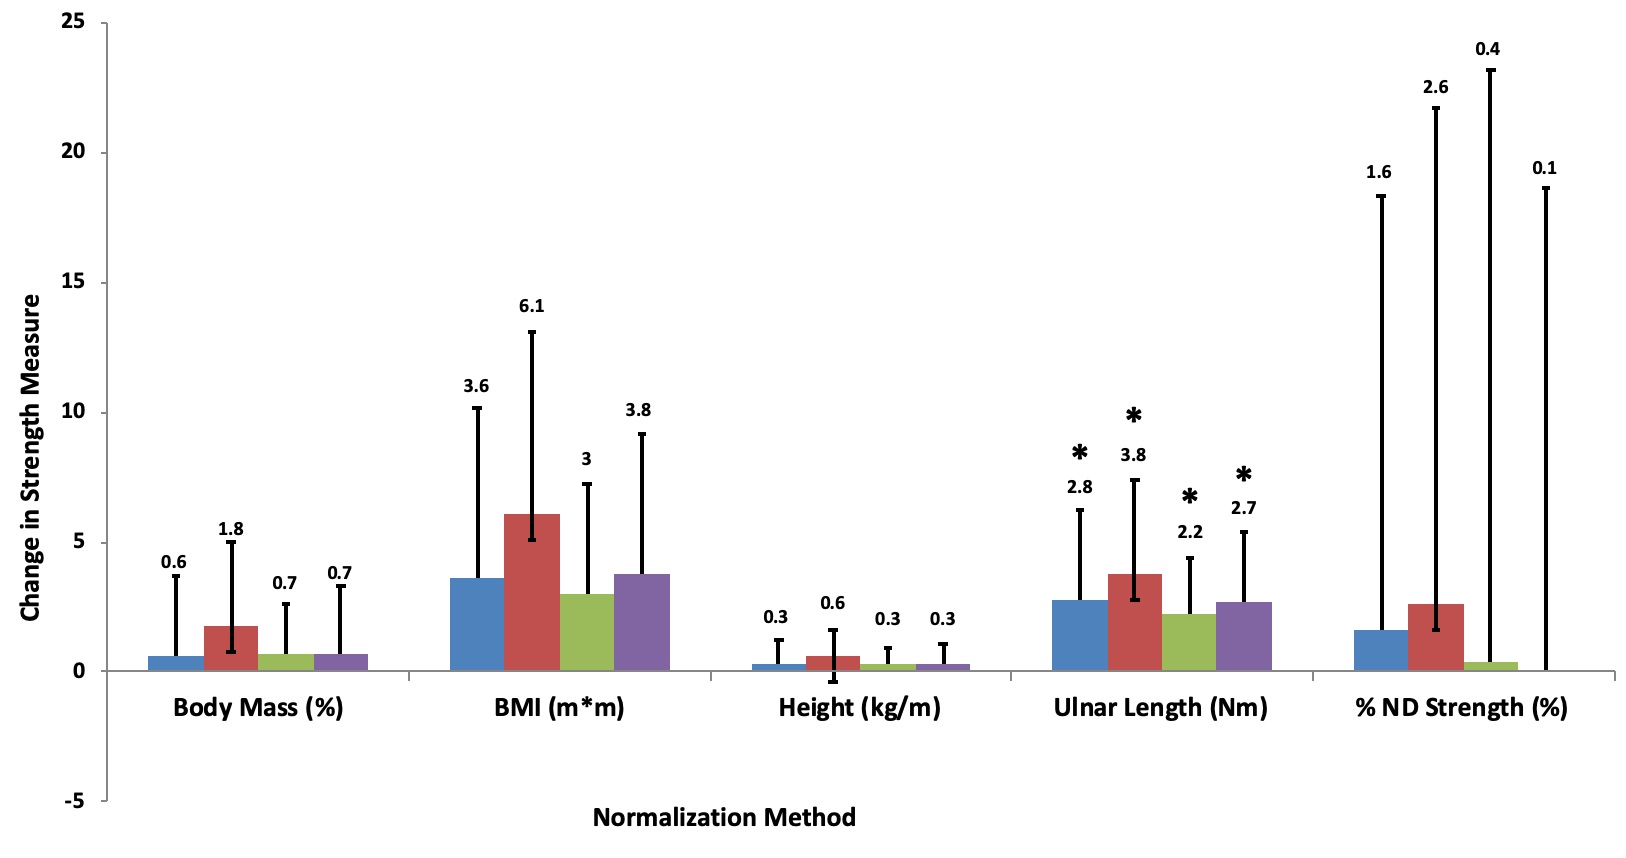
Minimal detectable change scores, using SEM values, were then calculated for each of the normalized shoulder strength measures: body mass 1.3-1.8%, BMI 2.6-4.0 m2, height 0.3-0.8 kg/m, ulnar length 1.1-1.9 Nm and % of non-dominant shoulder strength 9.2-41.5%. Mean change scores for each of the five normalization methods were compared to their respective MDC95 values across all four measures of shoulder strength (Figure 1). In addition to the MDC95 scores, effect sizes were calculated for each of the five normalization methods: body mass 0.04-0.24, BMI 0.24-0.44, height 0.11-0.33, ulnar length 0.41-0.54 and % of non-dominant shoulder strength 0.00-0.02. Ulnar length was the only method that demonstrated mean change scores that exceeded their respective MDC95 values and exhibited medium effect sizes in each of the four shoulder strength measures assessed (Table 3). The remaining four methods did not consistently exceed their MDC95 values (Figure 1) and demonstrated wide variability in effect sizes across each of the strength measures assessed.

Relationships between Shoulder Strength and Ball Velocity
The relationships between normalized dominant isometric shoulder strength and ball velocity were examined using bivariate Pearson correlation coefficients followed by stepwise linear regression models with forward selection. The height and ulnar length normalization methods demonstrated significant correlations with ball velocity across all four shoulder strength measures, while the body mass, BMI and non-dominant shoulder strength methods did not. Based on these findings, only normalized strength measures using the height and ulnar length methods and were included in the linear regression models.
Small to moderate positive correlations were observed between normalized shoulder strength using the height method and ball velocity in youth baseball players: scaption r = 0.47, p < 0.001; ER at 0° r = 0.41, p < 0.001; ER at 90° r = 0.27, p = 0.02; and IR at 90° r = 0.38, p < 0.001. Normalized shoulder strength using the ulnar length method demonstrated the strongest positive relationship with ball velocity: scaption r = 0.52, p < 0.001; ER at 0° r = 0.48, p < 0.001; ER at 90° r = 0.43, p < 0.001; and IR at 90° r = 0.49, p < 0.001. Linear regression models were then developed to determine if normalized shoulder strength could predict ball velocity in young throwers. Each of the four normalized shoulder strength measures were entered into a predictive model.
The first linear regression models examined dominant shoulder strength and ball velocity using the height normalization method. Normalized scaption strength demonstrated a high correlation with ball velocity and was entered into the model first followed by ER at 0° strength, ER at 90° strength and IR at 90° strength. A significant relationship was observed between normalized scaption strength and ball velocity (r2 = 0.22, p < 0.001). The remaining measures demonstrated non-significant relationships with ball velocity when scaption was entered first into the model (ER at 0° strength r2 = 0.23, p = 0.42; ER at 90° strength r2 = 0.23, p = 0.70). Internal rotation strength was completely removed from this model. A second model was run with ER at 0° strength entered first followed by the three remaining measures. Significant relationships were observed between ER at 0° strength and ball velocity (r2 = 0.17, p < 0.001) and between scaption strength and ball velocity (r2 = 0.24, p = 0.04) in this model. The remaining measures demonstrated non-significant relationships with ball velocity when ER at 0° strength was entered first into the model (ER at 90° strength r2 = 0.18, p = 0.31; IR at 90° strength r2 = 0.19, p = 0.34).
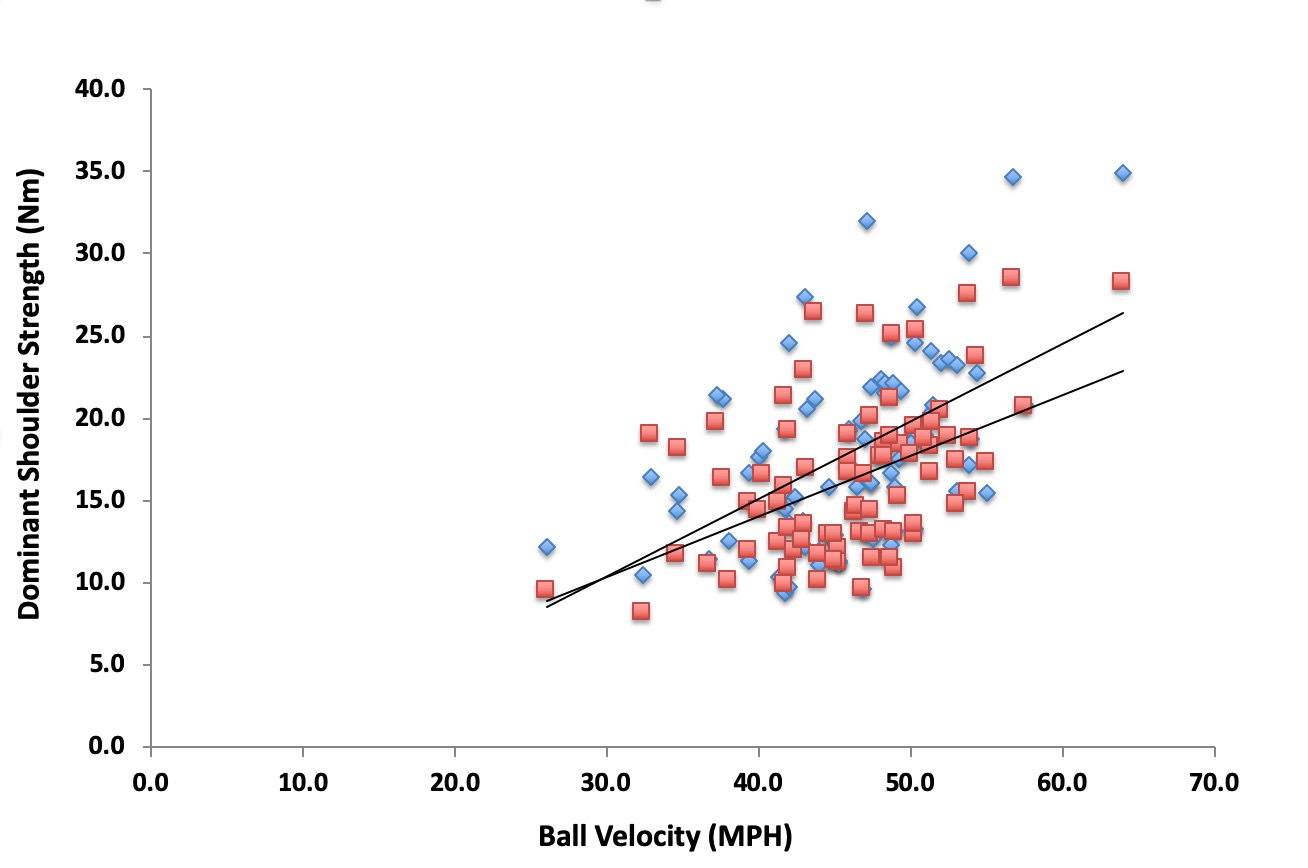
Next, linear regression models were run using the ulnar length normalization method. Normalized scaption strength using the ulnar length method demonstrated the highest correlation with ball velocity of any normalized measure and was entered into the model first followed by ER at 0° strength, ER at 90° strength and IR at 90° strength. A significant relationship was observed between normalized scaption strength and ball velocity in this model (r2 = 0.27, p < 0.001) (Figure 2). The remaining measures demonstrated non-significant relationships with ball velocity when scaption was entered first into the model (ER at 0° strength r2 = 0.27, p = 0.59; ER at 90° strength r2 = 0.28, p = 0.69). Internal rotation strength was completely removed from this model. A second model was run with ER at 0° strength entered first followed by the three remaining measures. Significant relationships were observed between ER at 0° strength and ball velocity (r2 = 0.23, p < 0.001) and scaption strength and ball velocity (r2 = 0.23, p = 0.04) in this model (Figure 2). The remaining measures demonstrated non-significant relationships with ball velocity when ER at 0° strength was entered first into the model (IR at 90° strength r2 = 0.28, p = 0.30). External rotation at 90° strength was completely removed from the model.

Tests for collinearity indicated that a high level of collinearity was present between scaption and ER at 0° strength measures (Eigenvalue = 1.96) in the models, regardless of the normalization method used. Based on the findings from the models above, dominant shoulder scaption strength and ER at 0° strength, using the height normalization method, were able to predict 22% and 17% of ball velocity, respectively, in a cohort of youth baseball players. Dominant shoulder scaption strength and ER at 0° strength, using the ulnar length normalization method, were able to predict 27% and 23% of ball velocity, respectively. Based on these results, normalized shoulder strength, using the ulnar length method, was able to explain a larger portion of the variance in ball velocity in youth baseball players when compared to shoulder strength using the height normalization method.
DISCUSSION
Five separate normalization methods were examined to determine which had the best measurement properties for assessing isometric shoulder strength in youth baseball players.
The ulnar length method was determined to be the most objective and reliable normalization method in this study. Shoulder strength normalized using ulnar length was the only method to demonstrate: 1) excellent intra-rater reliability, 2) the lowest reported SEM and MDC values of any method examined and 3) a significant predictive relationship with ball velocity, specifically with respect to shoulder scaption and ER at 0° strength, in youth throwers.
Normalizing Strength in Youth Athletes
Few original research studies have employed normalization methods when examining muscle strength measures and none have compared findings to determine the most appropriate method based on a specific population.7,40 Previous literature impresses the importance of normalizing strength measures for accurate comparison across multiple time points, particularly in longitudinal and repeated measures study designs.27,29 As an integral part of a physical examination, the ability to accurately monitor changes in shoulder muscle strength could aid clinicians in identifying when young players are at an increased risk for injury as well as determine when they can safely return to sport following injury.7,31 Accurately tracking shoulder muscle strength could also aide in the development and implementation of injury prevention programs for youth athletes.25,26,41 In the absence of normalization, any observed changes in muscle strength may be misinterpreted as simply functions of growth and physical development as opposed to definitive changes in the strength measures themselves.27,29
The only published study that examined normalized shoulder muscle strength measures in physically developing athletes was by Trakis.7 This study used isometric testing and HHD to develop a ratio that referenced dominant shoulder strength measures to non-dominant shoulder strength measures as a means of normalizing muscle strength in adolescent baseball players.7 The theory was based on the concept of using non-dominant shoulder strength values as internal reference points for each athlete.7 When the % of non-dominant shoulder strength method was applied in younger players, ages 9-12 years old, excessive inter-participant variability was noted both in single session measures and repeated measures over time. Neuromuscular control patterns in youth athletes are not as well developed as their adolescent and adult counterparts, which may have impacted their ability to reproduce consistent results with isometric muscle strength measures in this study.32,41–43
Biomechanical studies have suggested the use of body mass and derivations of body mass, including BMI, as potential normalizing factors though few studies have formally tested those theories on youth and adolescent athlete populations.28,40 Frequent fluctuations in body mass measures imply that, while the weight of a youth athlete certainly contributes to their ability to produce muscle force, it may not possess the stability required to accurately detect changes in muscle strength measures over time.28,29 Height and limb length (i.e. ulnar length), a derivation of height, appeared to be more stable choices for normalization factors as the measures only increase over time. This results in a more predictable growth pattern in youth athlete populations. When the normalization methods containing height and ulnar length were compared, the limb-specific ulnar length method outperformed the more generalized height method in test-retest reliability as well as internal consistency as evidenced by lower SEM and MDC values. These findings suggest that ulnar length was the most consistent normalization method for assessing isometric shoulder strength in youth baseball players.
Normalized Shoulder Strength and Ball Velocity
Dominant shoulder scaption and ER at 0° strength have been previously linked to throwing performance and upper extremity injury risk in baseball players.7,18,19,21,22,24 The majority of studies examining upper extremity strength as a factor for performance and injury risk were performed in collegiate and professional athletes.18,20–22 Studies have found little conclusive evidence supporting the theory of a direct relationship between baseline shoulder muscle strength and ball velocity in throwers, however shoulder muscle weakness has been repeatedly linked to injury throughout the baseball literature.19,21,22,25,44 Studies by Magnusson,21 Mullaney22 and Byram19 have all shown a significant relationship between deficits in dominant scaption and ER muscle strength and upper extremity injury in collegiate and professional baseball pitchers. While we did not examine the effects of normalized dominant shoulder strength on injury risk in this study, our results do support the significance of shoulder strength measures, specifically scaption and ER at 0°, with regards to athletic performance measures (i.e. ball velocity) in youth baseball players. These positive relationships with ball velocity, while present with general shoulder strength measures, were not observed with the thrower-specific ER at 90° and IR at 90° strength measures. This finding, while unexpected, may be related to the increased inter-participant variability and decreased neuromuscular control observed in youth baseball players when assessed in the 90° position.
To the authors’ knowledge, this is the first study to show a positive association between normalized isometric shoulder strength and ball velocity, an acknowledged performance measure in youth baseball players.5,45,46 Minimal data exists examining upper extremity muscle strength and injury risk in youth athletes. One study exists by Harada24 compared a battery of shoulder muscle strength measures and injury risk in a cohort of Japanese youth baseball players. They found that injured athletes demonstrated greater dominant shoulder strength compared to uninjured athletes.24 These findings suggest that the connection between shoulder strength and upper extremity injury risk may be different in youth athletes when compared to their collegiate and professional counterparts, however further studies are needed to better understand these relationships.19,21,22,24
Limitations
Isometric muscle strength testing using HHD has several clinical advantages such as low cost, portability and ease of use however it also has acknowledged limitations.17,30 Isometric testing is a static measure that assesses strength at a single point in a player’s available range of motion.30,47 As throwing is dynamic, isokinetic testing is considered the gold standard in strength assessment, however the high equipment costs and lack of portability made it impractical for use outside of a laboratory setting.30,47–49 Another limitation of this study was that no external stabilization methods were applied to the athletes during the assessments. This decision was based on the feasibility and clinical applicability of the methods described in this study. Extreme effort was expended to standardize all measurements and testing procedures, including using a single investigator with excellent intra-rater reliability, however this decision may have influenced the results.
Another potential limitation of this study was the collinearity between the isometric shoulder scaption and ER at 0° strength measures in this population. The current results indicate that either normalized strength measure is predictive of ball velocity, however further research is needed to determine what additional variables should be included in the model to better explain what drives this performance measure in youth athletes. Overhead throwing is a complex motor skill that requires coordination and the proper sequencing of a series of linked movements that start in the lower extremities and ultimately culminate in ball release.50 This statement supports our findings that isometric shoulder strength explains only a small portion of the variability observed in ball velocity in young throwers.
Lastly, the high levels of inter-participant variability observed in isometric shoulder ER and IR at 90° strength may have negatively influenced the predictability of these measures in youth athletes. The variability may be attributable to age-appropriate deficits in neuromuscular control in the prone overhead position. Further study is needed to better understand the role neuromuscular control plays in youth baseball throwing mechanics as well as which positions are best to accurately assess shoulder strength in this population. Future studies should consider the use of the ulnar length method when normalizing isometric shoulder strength, not only in performance assessments of youth athletes, but in injury prevention programs as well. The relationship between upper extremity injury risk and normalized isometric shoulder strength is not well understood in youth populations suggesting that further study is warranted.
CONCLUSION
The ulnar length method was determined to have the best measurement properties of any normalization method for assessing isometric shoulder strength in youth baseball players. Ulnar length was the most stable and reliable anthropometric measure evaluated in this study. Once normalized using ulnar length, dominant isometric shoulder scaption strength was the most significant predictor of ball velocity, followed by ER at 0° strength in 9–12-year-old baseball players. Muscle strength assessments performed in 90° of shoulder abduction demonstrated high inter-subject variability and provided minimal information concerning the shoulder function and athletic performance of youth baseball players.
Conflicts of Interest
All authors declare no conflicts of interests.