


INTRODUCTION
ACL injury is a common and serious problem in sports and requires a long period of rehabilitation.1–3 A rate of 6.5 ACL injuries per 100,000 athlete exposures throughout various athletic activities was reported in high school level. Approximately 76% of ACL injuries require surgery, which consumes time and money for recovery and may ultimately reduce the quality of life by increasing the risk of subsequent injuries or impairments, resulting in financial hardship.2,4 After ACL reconstruction, 55% of injured athletes can reach return to competitive level.5 However, athletes with ACL deficiency have greater risk of early-onset osteoarthritis of the knee.6 Therefore, ACL injury prevention and risk screening are important.
Excessive knee valgus has been strongly suggested as a contributing factor to anterior cruciate ligament (ACL) injuries.7–9 Seventy to eighty-four percent of ACL injuries occur during non-contact while decelerating or rapidly changing direction in sporting activities.10 In addition, the combination of knee valgus with poor trunk or hip control has been identified as a key predictor of ACL strain including hip adduction, hip internal rotation, and ipsilateral trunk leaning.11,12
Observation of the knee valgus angle is considered a critical component for injury risk assessment and often performed during functional tasks such as single-leg squat and landing tasks which are typically carried out in clinical and sports settings.13–15 Three-dimensional (3D) motion capture is considered as the “gold standard” to determine the quality of human movement. Such a system is able to evaluate multi-planar kinematics across joints and has been shown to be reliable in the assessment of many functional tasks such as landing tasks and cutting maneuvers.16,17 However, a 3D motion system is not practical within field and clinical settings due to cost, complexity, and time required to perform the analysis.
Previous studies have developed alternative two-dimensional (2D) methods and compared these with 3D methods for use in clinical settings.18–21 2D measurement using commercial cameras is one method which is relatively inexpensive and easy to apply in field and clinical settings.22 2D measurements have been used to examine dynamic knee valgus using the frontal plane projection angle (FPPA), which has shown good reliability in performance test such as running, drop jump, and single leg landing, which can provide biomechanical measurements to assess injury risk and progression through treatment.18–20,23 However, the use of 2D methods to assess cutting maneuvers in various directions has not been reported.
Cutting maneuvers are frequently performed during sports training sessions. Previous studies have demonstrated that different knee valgus angles were noted with different directions of cutting, which are important to consider for injury risk in sporting settings.24–26 Therefore, the potential to apply 2D measurements to determine knee valgus angle during cutting maneuvers in various directions is worthy of investigation.
To the best of authors’ knowledge, the use of 2D analysis to explore knee valgus angle during side-step cutting maneuvers in multi-directions has yet to be reported. Therefore, the purpose of the present study was to investigate the concurrent validity of 2D measurements of knee valgus angle during cutting in different directions, and to explore intra-rater and inter-rater reliability of the 2D measurements. The hypothesis of the study was that 2D frontal knee measurement would have good validity and reliability in multi-directional cutting maneuvers.
METHODS
Participants
All participants were university students who volunteered to participate in the study. The inclusion criteria were: aged between 18- to 25-years, and regularly participated in sports involving cutting maneuvers. Participants were excluded from the study if they reported a history of lower extremity surgery or a history of serious injury of lower extremity within a year prior to testing. The research protocol was approved by the Mahidol University Central Institutional Review Board for Human Research (COA.No. 2020/062.2704). Before testing, all participants signed an informed consent form and the protocol was explained in detail.
Side-step Cutting Maneuvers
Athletes performed side-step cutting maneuvers in the three different directions: 30º, 60º, and 90º (Figure 1). The participants were instructed to stand at the starting point, run forward five meters and perform a side-step cutting task with the dominant leg. The standardized verbal command for all participants was “keep looking forward and perform a side-step cutting at maximum speed”.

The participants performed a five-minute warm up of lower limb dynamic stretching and practiced five trials of side-step cutting before actual testing in each direction. Three completed trials of each directional session were then measured and analyzed, and the knee valgus angles from the 2D and 3D measurements were extracted at initial contact and at peak vertical ground reaction force (vGRF).
2D Measurements
A commercially available digital camera (Canon EOS 1200D, Canon USA Inc, Melville, USA) with a 18-55 mm lens, was positioned 2 m away from the force plate at a height of 60 cm and recorded at 60 Hz. Digital video footage was recorded with no optical zoom to standardized the camera image between participants. Video footage was imported to Kinovea software (Version 0.9.3, Kinovea Open Source Project, www.kinovea.org) and 2D knee measurement was processed. The frontal plane projection angle (FPPA) was used to estimate the knee valgus angle by measuring the angle between the line from ASIS to the center of patella, and the line from the ASIS to the center of the ankle joints, which was then subtracted from 180º (Figure 2).18 Two raters assessed the FPPA in the study. They are physical therapists who have experience in 2D measurement and in ten years of orthopedic and sports physical therapy. Each rater measured knee valgus angle of a data set which the information regarding cutting directions was encrypted by code. In order to determine intra-rater reliability, the first rater measured the FPPA twice, two weeks apart.
_during_cutting_maneuvers.png)
3D Measurements
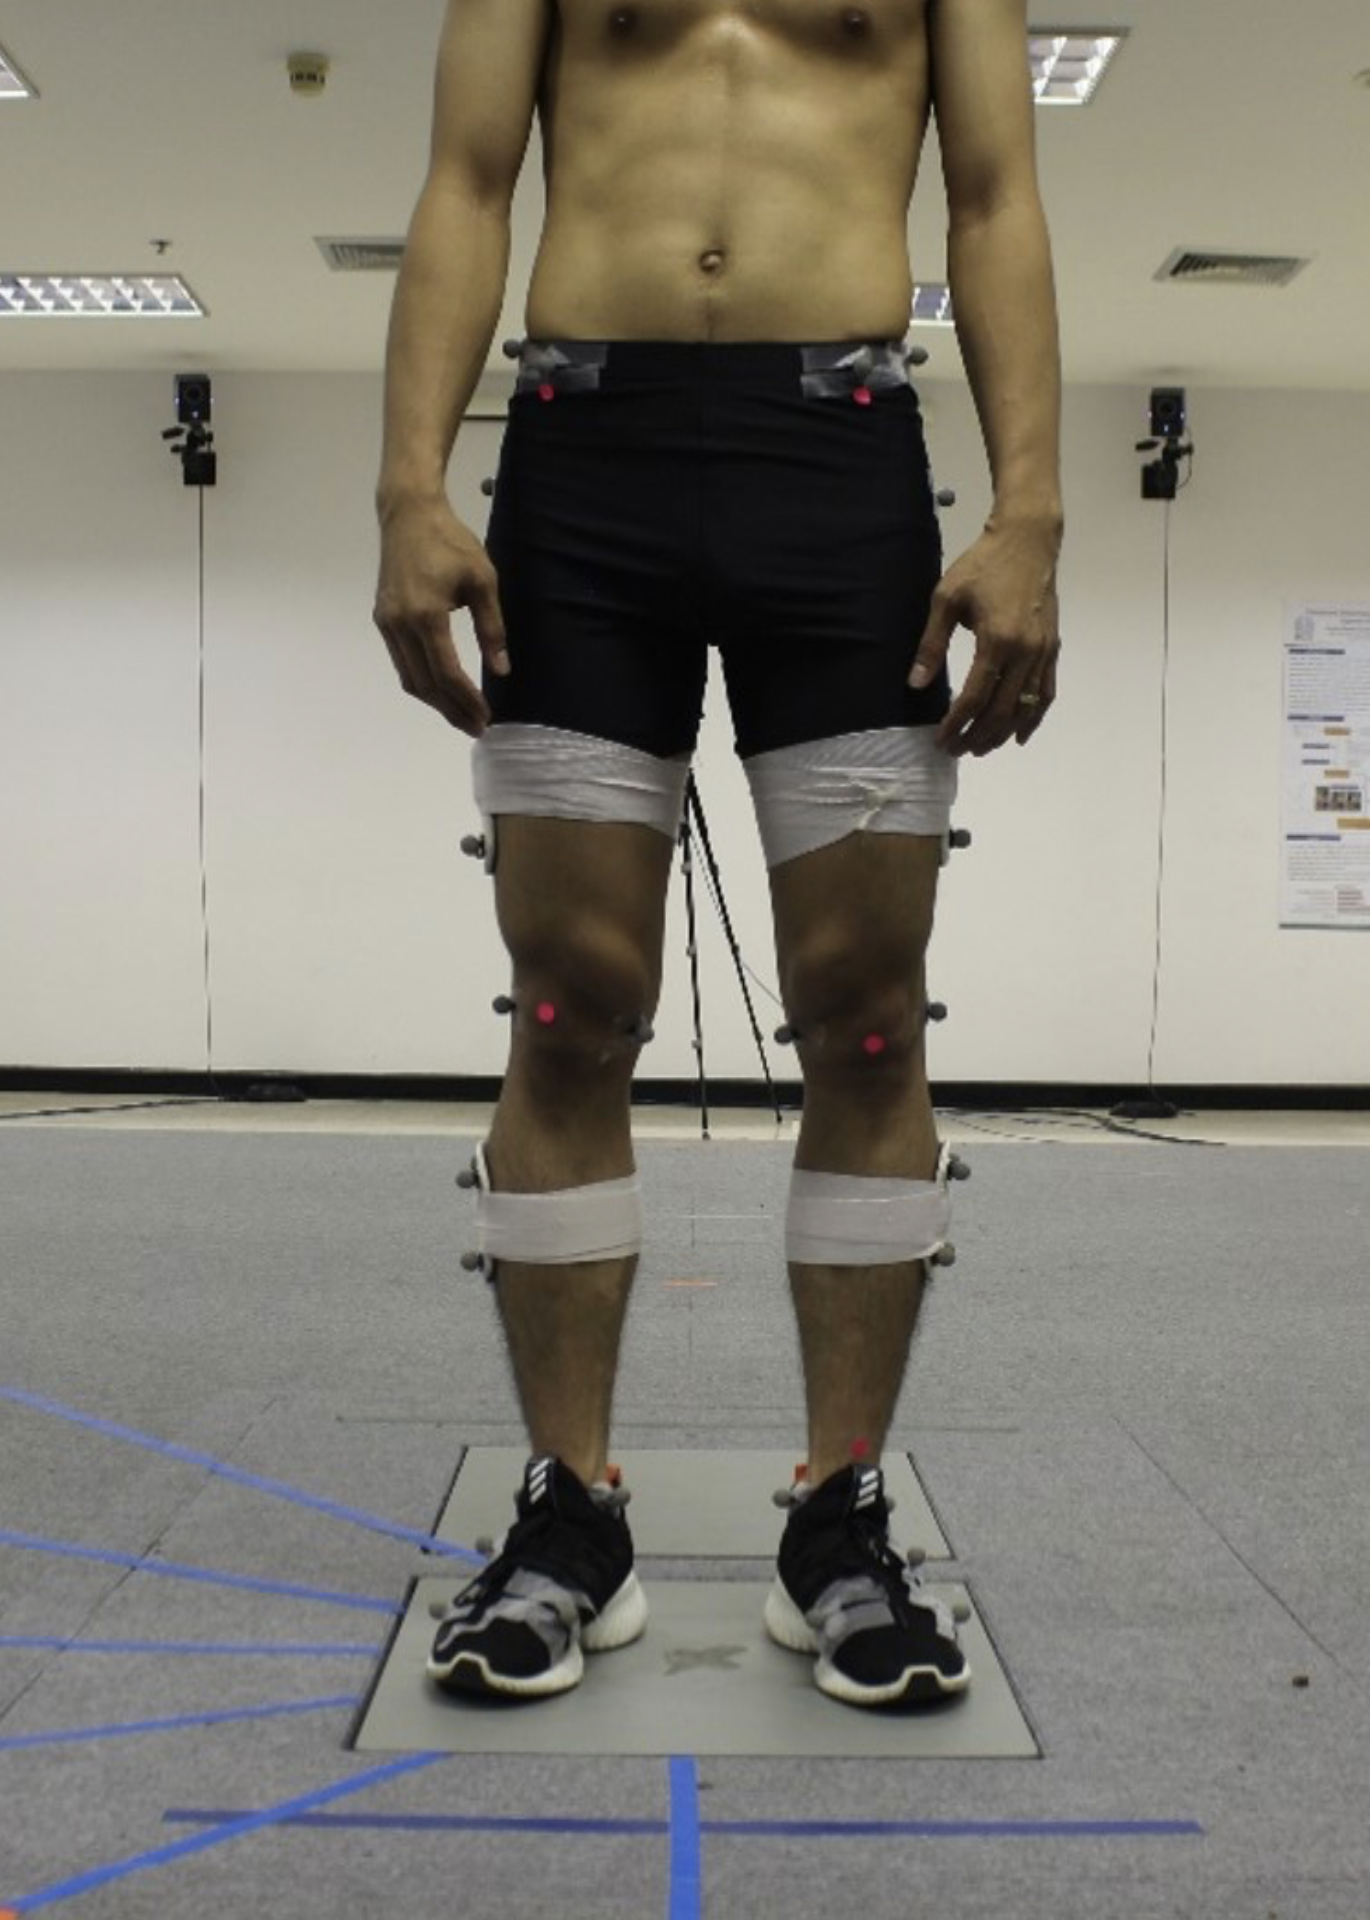
A 10 camera ViconTM motion analysis system (Vicon nexus 2.10, Oxford Metrics, Oxford, UK) was used to record three-dimensional marker coordinates at 200 Hz. Force data was collected synchronously using an AMTI force platform at 1,000 Hz (AMTI-OR67, Advance Mechanical Technologies Inc., Watertown, USA) which was used to identify stance phase during the cutting maneuvers. Twenty-six reflective markers were attached on the bony prominences of both sides, including anterior superior iliac spine (ASIS), posterior superior iliac spine (PSIS), iliac crest, greater trochanter, medial and lateral femoral epicondyles, medial and lateral malleoli, distal head of the first metatarsals, distal head of the fifth metatarsals, proximal head of the fifth metatarsals, and heels. In addition, four rigid clusters of four markers were placed on the lateral thigh and lateral shank (Figure 3 and 4).

_marker_model_of_lower_extremity__a__anterior.jpeg)
Kinematic and kinetic data were imported into Visual 3D software (C-Motion Inc, Germantown, USA), and digitally filtered using a low pass, fourth-order Butterworth filter with cut-off frequencies of 6 Hz and 35 Hz, respectively.27,28 Right-hand 3-dimensional Cartesian coordinate systems were used for global and segmental axes. The pelvis segment was measured relative to the global (laboratory) coordinate system, and the hip joint center was estimated using method reported by Bell et al.29 Knee and ankle joint centers were estimated as the midpoint between the medial and lateral femoral epicondyles and malleoli, respectively, and the knee joint angle was calculated between the shank relative to the thigh segment. Kinetics and kinematics data were extracted and normalized into 101 data points in order to represent 100% of the stance phase during side-step cutting maneuver.
Statistical Analysis
Three completed trials of cutting tests in each direction were processed from the seven soccer players in the study. Then, a total of 21 data sets were statistically analyzed. To determine the concurrent validity, Pearson product-moment correlation was used to assess the linear relationships between the 2D and 3D measurements of the knee valgus angle at initial contact and at peak vGRF. The strength of the correlation (r) was interpreted as poor (0 to 0.49), moderate (0.50 to 0.75), and strong (> 0.75).30 Reliability analysis of the 2D measurements was performed using intraclass correlation coefficient (ICC). The ICC(3,1) and ICC(2,1) models were used for statistical analysis of intra-rater and inter-rater reliabilities, respectively. Reliability index of ICC were interpreted as poor (less than 0.5), moderate (0.5-0.75), good (0.76-0.9), and excellent (> 0.9).31
RESULTS
Seven male soccer players, all with more than four years experience in soccer playing voluntarily participated. The characteristics of the participants are shown in Table 1. The Pearson’s correlation coefficients between 2D and 3D measurements of the FPPA at initial contact showed a significant strong correlation during 90º cutting (r = 0.77, 95% CI: 0.34 - 0.89), with 60º cutting showing a significant but poor correlation (r = 0.45, 95% CI: -0.07 - 0.83), and 30º cutting showing no significant correlation. For the FPPA at peak vGRF a significant correlation was seen between 2D and 3D analyses in all directions of cutting, with 90º cutting showing a strong correlation (r = 0.78, 95% CI: 0.19 - 0.87), 60º cutting showing a moderate correlation (r = 0.74, 95% CI: 0.31 - 0.89), and 30º cutting showing a poor correlation (r = 0.45, 95% CI: -0.14 - 0.81), Table 2. The FPPA measurements demonstrated good-to-excellent intra-rater reliability at initial contact (ICCs: 0.821-0.937) and at peak vGRF (ICCs: 0.970-0.987). In addition, the inter-rater reliability index showed excellent reliability at initial contact (ICCs: 0.974-0.987) and at peak vGRF (ICCs: 0.989-0.997), Table 3.
DISCUSSION
The purpose of this study was to determine the concurrent validity and reliability of 2D frontal knee measurements during multi-directional cutting maneuvers. To explore the concurrent validity, knee valgus angles at initial contact and at peak vGRF were captured with 2D and 3D measurements, simultaneously. Moreover, the intra-rater and inter-rater reliabilities of the 2D measurements of knee valgus were determined. The findings of the present study showed that there were statistically significant correlations between most 2D and 3D measurements, and the reliability indices of 2D measurement showed good-to-excellent intra- and inter-rater reliability at both initial contact and peak vGRF.
Cutting maneuvers require a sudden change of direction after running and involves translation and reorientation into new direction of travel.32 This study used the frontal plane projection angle (FPPA) from 2D measurement which has been reported to be highly influenced by hip and knee joint rotations in the transverse plane.33 The present findings confirmed a poor correlation of 2D and 3D knee valgus measurements at initial contact during cutting maneuvers at 30° and 60° and peak vGRF at 30°. This further supported by Schurr et al.34 who found a poor correlation (r = 0.31) in the frontal plane knee angle between 2D and 3D analyses during a single-leg squat. In addition, Maykut et al.20 considered knee valgus angles during running on treadmill and also showed a poor correlation between 2D and 3D analyses (r = 0.158). Maykut et al. suggested that the difference of sampling frequencies may explain the non-significant correlation between the 2D and 3D measurements, when using 60 Hz for the 2D measurement and 240 Hz for the 3D measurement.
However, the current study did show some significant correlations at initial contact and at peak vGRF during cutting maneuvers. At peak vGRF the correlations were strong (r=0.78), moderate (r=0.74), and poor (r=0.45) for cutting maneuvers at 90°, 60°, and 30°, respectively, with correlation at initial contact being strong (r=0.77), moderate (r=0.45), and very poor (r =-0.02) for 90°, 60°, and 30°, respectively. Both Maykut et al.20 and Schurr et al.34 reported peak knee abduction angles and knee angle displacements in frontal plane, respectively, while the current study reported values at initial contact and peak vGRF. Therefore, the different time events could be a possible reason for differences seen with previous studies.
McLean et al.33 demonstrated a moderate correlation between 2D and 3D measurements. McLean et al. investigated 35° and 55° cutting and side-jump tasks in healthy male and female collegiate basketball players, and reported moderate correlations r = 0.58 and r = 0.64 for the 35°and 55° cutting tasks and side jump, respectively. Havens et al.26 demonstrated 35° greater pelvic rotation to the intended direction during 90°cutting compared with 45° cutting. The current study showed strong correlations in 90° cutting, moderate correlations at 60°, and poor correlation at 30° cuttings (Table 2). The difference seen could be due to the difference in tasks explored. Schurr et al.34 and Maykut et al.20 studied single-leg squat and running, respectively.
Regarding multi-directional cutting maneuvers, Dos santos et al.24 stated that there was a relationship between directions and biomechanical demands. Greater hip abduction and knee valgus angles were observed as the angle of directional change increases. The current findings indicate that knee valgus screening using 2D measurements for 60° and 90° cutting tasks could be considered as a suitable assessment for use in clinical settings, and may be useful as an injury screening tool to help health professionals observe frontal knee projection during cutting. The possible explanation of poor correlation in 30° cutting might due to the athlete’s pelvic rotation to the intended direction prior to initial contact. Rotational movement could lead to a bit of difficulty of maker capture for 2D measurement. Comparing results of 2D knee valgus between studies should be interpreted with caution due to previous limitations reported when examining 2D measurements, and further work is required to explore the clinical utility of such measures in term of knee valgus magnitude.35
In addition, 2D knee valgus measurements in this study showed good-to-excellent intra-rater and excellent inter-rater reliabilities. This suggests that 2D knee valgus measurement of the current study is fit for repeated measurements in clinical evaluation. The method of 2D testing used in this study is highly reliable and is therefore acceptable for assessing before and after provision of targeted intervention such as neuromuscular training and corrected cutting training.
Application of the findings to other sport tasks and to female athletes should be performed carefully. It would be interesting to perform a future study in which more participants are recruited to investigate limb dominance.
CONCLUSION
The current study demonstrated that concurrent validity of 2D and 3D knee valgus measurements is moderate-to-strong when considering 60° and 90°cutting maneuvers. Poor correlation was observed in 30° cutting maneuver. The 2D measurement of the FPPA demonstrated good-to-excellent intra-rater and excellent inter-rater reliabilities. This suggests that 2D knee valgus measurements could be used as an easy and inexpensive screening tool for injury risk identification and evaluation of change after targeted interventions such as neuromuscular training and corrected cutting training. In clinical application, knee valgus screening using 2D measurements for 60° and 90° cuttings could be performed and considered as a suitable assessment.
Conflict of interest
No conflict of interest
Acknowledgments
All authors would like to thank all participants, and members of the Biomechanics and Sports Research unit, Faculty of Physical Therapy, Mahidol University, to support the study.