


Introduction
After anterior cruciate ligament reconstruction (ACLR), several clinical outcome measures, such as patient reported outcomes (Lysholm score, International Knee Documentation Committee subjective score, Tegner activity score, etc.), joint instability, muscle strength, and balance, are used to evaluate knee and functional performance.1 Based on the evaluation results, a milestone-based return-to-sports (RTS) program is constructed.2 Balance is an important factor for performance of activities of daily living and sports in patients with ACLR.3 However, balance is difficult to maintain after anterior cruciate ligament (ACL) injury owing to the decreased hamstring muscle activation and lack of joint position sense.4
The Y-Balance test (YBT) is used to assess dynamic balance impairments associated with lower extremity injuries such as ACL injury, patellofemoral pain syndrome, and ankle instability.5–7 The YBT is commonly applied to musculoskeletal injuries because it is relatively inexpensive, portable, easy to administer, and shows good interrater test-retest reliability (intraclass correlation coefficient, 0.85–0.93).8,9 Furthermore, the YBT score is useful as a component of the criterion for RTS and as an indicator of neuromuscular training results.10,11 The YBT is commonly used to evaluate the outcome of reconstruction after ACL tear, which has a high incidence of occurrence during sports activities.6,12
The YBT scores relate not only to balance, but also to various other factors. Previous authors have reported that the YBT scores were not correlated with the Biodex Balance System (BBS)-measured balance in healthy subjects3 and no correlation with the hamstring-to-quadriceps (HQ) ratio, but is correlated with knee extensor and flexor peak torque in patients who underwent ACLR.6,12 Functional movement (hurdle step, in-line lunge, shoulder mobility, and deep squat) was associated with greater anterior reach on the YBT,13 and the YBT scores were also a significant predictive factor of joint instability.14 As the YBT scores are related to various factors such as joint instability, balance, muscle strength, and functional performance, it is unlikely that this measure is solely representative of balance for ACLR patients.
Therefore, there is a need to identify the variables that are most related to YBT scores in patients who undergo ACLR. The aim of this study was to examine the relationship between YBT scores and measures of knee joint laxity, balance, knee flexor and extensor torque, HQ ratio, and functional performance tests (FPTs) after ACLR.
Methods
Subjects
This study retrospectively reviewed the medical records of patients who underwent primary ACLR by a single experienced surgeon (J.K.H.) between June 2016 and May, 2019. The inclusion criteria were as follows: (a) patients who underwent single-bundle ACLR using quadrupled semitendinosus tendon autograft from the hamstrings; (b) patients who were followed for one year or more; (c) patients aged 18–45 years; and (d) patients who completed all the required tests at the hospital. Patients with multiple concomitant ligament injuries and fractures, those who underwent meniscal root repair, cartilage repair, osteotomy to correct mechanical alignment, revision ACLR, subtotal or total meniscectomy, or those with a history of prior knee surgery were excluded. All the patients underwent the same follow-up protocol. The KT-2000 arthrometer, BBS, isokinetic muscle strength test at 60°/s for quadriceps and hamstring, single-leg hop test (SLHT), and single-leg vertical jump test (SLVJT) were all assessed by one of the authors (M.Y.C.) who were blinded to the evaluation procedures after ACLR. All tests were conducted at a sports medicine center in the hospital and at a similar time (approximately one year) postoperatively. The order of the tests was randomized using a randomization website (www.randomization.com). The study protocol was approved by the Inje University Seoul Paik Hospital Institutional Review Board (number 2020-06-002). Written informed consent was obtained from all the patients.
Surgical techniques
All surgical procedures were performed using the outside-in technique. A quadrupled semitendinosus tendon autograft with remnant preservation was harvested. A single surgeon (J.K.H.) performed all the operations. The reference points of the femoral and tibial tunnels were based on the anatomical center. The femoral tunnel was drilled using a flip-cutter. After graft passage, femoral fixation was achieved using TightRope RT (Arthrex, Naples, FL, USA). A hydroxyapatite interference screw (S&N Corp., Andover, MA, USA) was used for tibial fixation. In all cases, post-tie fixation was performed using a cortical screw for additional tibial fixation.
Postoperative rehabilitation
All patients underwent the same rehabilitation program, which comprised home-based exercises. Range of motion (ROM) exercises were initiated three–five days after the operation. One to two days after the operation, weight-bearing was initiated. The patients wore a functional knee brace held in full extension for three weeks. Full weight-bearing was allowed at three weeks, and the brace was removed after four to six weeks depending on the patient’s feeling of knee instability. Six weeks after the operation, open kinetic chain exercises for the quadriceps were allowed within a 90°–45° range of flexion. The perturbation training program was performed progressively six weeks after surgery. Three months after the operation, light running and side-cutting activities were allowed, and functional exercises emphasizing proprioception was initiated. Six months after the operation, RTS with no competition was allowed.
Tests
All tests were conducted one year after the operation by one of the authors (M.Y.C.) who was blinded to the patients’ surgical information. The tests included the YBT, KT-2000 arthrometer testing, static balance via the BBS, isokinetic muscle torque (as a measure of strength from which HQ ratios were calculated), and the SLHT and SLVJT. The order of the tests was randomized using a randomization website (www.randomization.com).
_anterior__b)_posterolateral__and_c)_posteromedial.png)
Y-Balance test
The patients performed six practice trials and three measurement trials of the YBT using the YBT test kit, administered per standardized instructions for performance (Move2Perform, Evansville, IN, USA), and the average of the three measurements was used for the data analysis (in cm).15 The patients stood barefoot with the involved side bearing their weight and placed both hands on their chest. The patients were instructed to push the box as far as possible in the anterior (ANT), posteromedial (PM), and posterolateral (PL) directions (Figure 1). The tester provided patient feedback and proper guidance to reduce mistakes such as kicking or stepping on the box during practice trials. The YBT-ANT, PM, PL, and composite scores were used for the analyses. The YBT scores were normalized to the limb length measurement of the patients. To calculate the composite score, the sum of the maximum reaches in each of the three directions was divided by three times the leg length.16
Joint laxity assessment
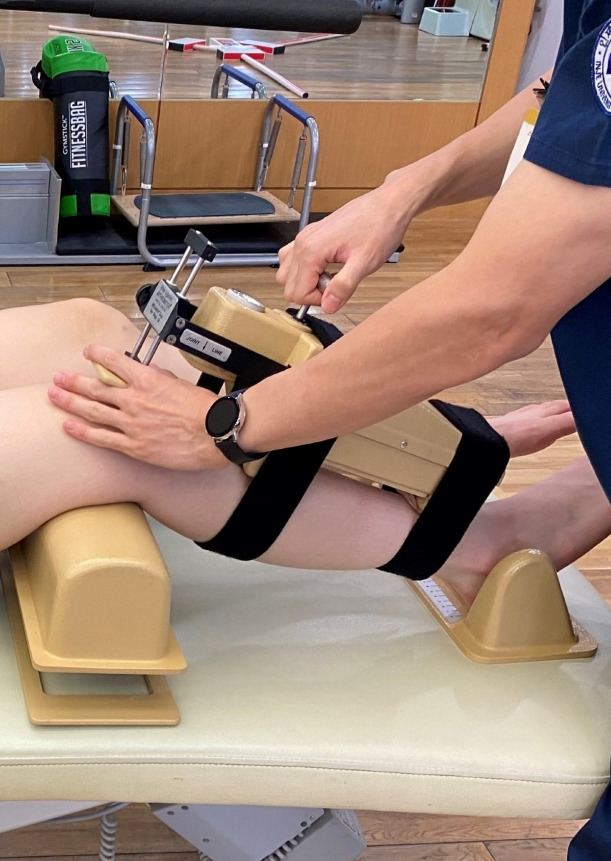
The side-to-side difference was measured (in mm) using a KT-2000 arthrometer (Med Metrics Corp., San Diego, CA, USA) with the knee at 30° flexion in the supine position. After the patients had fully relaxed, the tibia was pulled in the anterior direction as far as possible (Figure 2). The tibia was pulled with a force of 13.6 kg for three trials and the distance was recorded. The mean distance from the three trials was used for the analysis.
Biodex Balance System
Balance was evaluated using the BBS (Shirley, NY, USA) (Figure 3). The BBS consists of a mobile platform and 12 levels of difficulty, with Level 12 being the most stable and Level 1 as the most unstable. The test was initiated at Level 8 to measure balance.17 The following three indices were electronically generated by the BBS software: (1) anterior/posterior index (API), (2) medial/lateral index (MLI), and (3) overall index. These indices are unitless and calculated according to the degree of platform oscillation during one-leg standing. Higher index scores on the BBS indicate greater instability. The reported reliability coefficients were 0.77 and 0.99.3 The patients were instructed to stand barefoot, with the knees slightly bent and both hands placed on the chest, with the non-weight-bearing leg off the ground with the knee flexed and placed behind the weight-bearing leg. Each patient was encouraged to try to keep the platform in a neutral or stable position. The patients were instructed to maintain their balance in the smallest concentric ring (balance zone) on the BBS monitor.5 Each testing trial lasted for 30 s, and three testing trials were conducted to obtain reliable measurements. During the 10 s rest period between the trials, the contralateral leg was placed on the floor to prevent fatigue. During the test, the patients maintained an upright position on the unstable surface of the BBS.

Isokinetic muscle strength test
Isokinetic muscle strength was measured using the HUMAC-NORM isokinetic extremity system (Computer Sports Medicine Inc., Stoughton, MA, USA). Isokinetic muscle strength was measured at an angular velocity of 60°/s within 0°−90° of knee flexion with the patients in a sitting position. The extensor peak torque per unit of body weight (PT/BW, Nm/kg) and the flexor PT/BW and HQ ratio at angular velocities of 60°/s were calculated. For each session, the concentric quadriceps and hamstring contractions were repeated for four times, and the highest values were recorded and used for analysis.
Functional performance tests
The FPTs selected for comparison with the YBT in this study included the SLHT and SLVJT (in cm) of the involved side. The SLHT and SLVJT are commonly used tests to measure functional performance.18–21 In the SLHT, the patients stood on the involved leg and hopped as far as possible in the forward direction, landing on the same leg. Both hands were placed on iliac crests to restrict arm swing for counter movement. The distance was measured from the toe during push-off to the heel at the landing site.22 InBody u-Town (InBody Corp., Seoul, Korea) was used to assess SLVJT ability. The patient stood on one leg in the middle of a pressure sensitive mat (90 × 60 cm) and was asked to perform three maximal vertical jumps, with the knee extended, for as high as possible. Both hands were placed on iliac crests to restrict arm swing for counter movement. Height was automatically calculated at the highest point the patient has jumped. Jump height (cm) = 0.5 × 9.799611 × (time × 0.5)2 × 100. These tests were performed for a total of three times, and the longest and highest distances were used for the data analysis.
Statistical analysis
All statistical analyses were performed using the SPSS software for Windows (ver. 22.0; IBM Co., Armonk, NY, USA). Sex, age, height, weight, body mass index, and average final follow-up period were calculated as means and standard deviations to identify patient characteristics. The Pearson correlation coefficient was used to determine the strength of the association between YBT scores (ANT, PM, PL, and composite) and selected outcome measures. The outcome measures included the KT-2000 arthrometer, three-index BBS (overall, API, and MLI), three-component isokinetic muscle strength test at 60°/s (extensor PT/BW, flexor PT/BW, and HQ ratio), and two FPTs (SLHT and SLVJT). The r values were defined as follows: 0.00−0.19, no to slight correlation; 0.20−0.39, weak correlation; 0.40−0.69, moderate correlation; 0.70−0.89, strong correlation; and 0.90−1.00, very strong correlation.23 The statistical significance was set at p < 0.05.
Results
The subjects included 46 men and 13 women (mean age 29.6 ± 9.6 years; body mass index 25.9 ± 3.6 kg/m2; and follow-up period of 12.4 ± 2.1 months) (Table 1).
Static balance, knee joint laxity, and HQ ratio did not correlate with YBT scores on the involved extremity (Table 2). The isokinetic extensor and flexor PT/BW at 60°/s had significant weak correlations with the YBT-PM, YBT-PL, and YBT-composite. YBT-PM correlated with extensor PT/BW (r = 0.271) and flexor PT/BW (r = 0.365); YBT-PL, with the extensor (r = 0.273) and flexor PT/BW (r = 0.285); and YBT-composite, with the extensor (r = 0.288) and flexor PT/BW (r = 0.336) (Table 3).
The SLHT score had significant weak-to-moderate correlations with all YBT scores, as follows: YBT-ANT (r = 0.303), YBT-PM (r = 0.475), YBT-PL (r = 0.525), and YBT-composite (r = 0.520). The SLVJT score also had significant weak to moderate correlations with all YBT scores, as follows: YBT-ANT (r = 0.258), YBT-PM (r = 0.412), YBT-PL (r = 0.377), and YBT-composite (r = 0.412) (Table 3).
Discussion
The current study results indicate that the scores in YBT performed by patients one year after ACLR exhibited no significant correlation with static balance, joint laxity, and knee muscle strength ratio measures. The tester performed the examinations using the KT-2000 arthrometer to measure joint laxity, the BBS for static balance, and the HQ ratio at 60°/s for the knee muscle strength ratio. Although the YBT scores did not correlate with static balance, joint laxity, and knee muscle strength ratio, they exhibited weak correlations with knee muscle strength and weak-to-moderate correlation with functional performance tests. The YBT scores were more strongly associated with functional performance than with other outcome measures. Although the YBT is considered a balance test, based on the current results, the YBT performed after ACLR may be appropriately considered as an FPT.
Studying the correlation between the YBT and balance-related test scores in patients who underwent ACLR is a valuable point of this study, which demonstrated that the YBT scores correlated with other FPT scores and knee muscle strength. The clinical relevance of this is that the YBT is related more to physical function, such as knee muscle strength and functional performance, than it is to balance.
The YBT scores did not correlate with any index of the BBS, which are considered static balance assessments, used for patients after ACLR. Although the BBS is static and the YBT is dynamic, both are tools are used for assessing balance ability. Therefore, the authors of the current study expected a correlation between the YBT scores and BBS index, especially BBS-API, because ACL restricts the anterior tibial translation, and the anterior-posterior stability of the knee is an important factor for successful treatment.24 However, Almeida et al. reported that the YBT scores had no correlation with the BBS score in healthy subjects because the YBT required more dynamic movements than did the BBS.3 This was similar to the results of our study.
The HQ ratio of knee muscle strength and the KT-2000 arthrometer measures of joint laxity were also not correlated with the YBT scores. A high HQ ratio means that the hamstring restricting the anterior tibial translation functions well, but may also indicate relative quadriceps weakness. Kim et al. reported that the HQ ratio slightly increases in patients with ACL injury because quadriceps weakness is threefold greater than hamstring weakness.25 Therefore, a high HQ ratio was inadequate data. An appropriate HQ ratio for ideal knee muscle balance is known for 0.6,26 but an HQ ratio that is too high or low could mean muscle imbalance of the quadriceps and hamstrings. Since the correlation analysis is a linear relationship, the YBT scores might not be correlated with the HQ ratio, which requires an appropriate, rather than a high ratio.
Regarding joint laxity, Lee et al. reported that knee joint laxity did not correlate with dynamic standing balance in patients with chronic ACL deficiency,27 and Lephart et al. reported that patients with ACL injury had no significant difference in functional performance despite the significant knee joint laxity on the involved side,28 because they appeared to have adopted compensatory mechanisms of increased hamstring activity to achieve functional joint stabilization.29 Therefore, it is difficult to believe that joint laxity, which is static ligamentous stability, is correlated with the YBT, which is dynamic movement control, influenced by the neuromuscular system.
The extensor and flexor PT/BW values in the isokinetic muscle strength test at 60°/s correlated with the scores in all the YBTs, except for the YBT-ANT. Unlike this study, a previous study reported that the YBT-ANT, YBT-PM, and YBT-PL scores were all related to the extensor and flexor PT/BW in patients with ACLR.6 However, the extensor PT/BW of the contralateral side was only related to the YBT-PM, and the follow-up period of the study was short at 5–12 months, which may be an insufficient time frame for ACL recovery. During the YBT, multiple joints are involved, not a single joint. However, the YBT-ANT is most affected by ankle dorsiflexion,30 and when performing the YBT-PM or YBT-PL, hip muscle strength is required because the trunk is farthest from the center of mass in the sagittal plane.31 Nevertheless, in all YBT directions, the hip muscles and hip external rotator have been reported to be less activated than the quadriceps and hamstring muscles,32 and as the knee angle increased in the sagittal plane, the YBT scores were higher.31 Therefore, although multiple joints and muscles in the lower extremity affect YBT scores, extensor and flexor PT/BW might have a significant influence.
The scores in both the SLHT and SLVJT, were significantly correlated with the YBT scores. After ACL injury, a lack of proprioception and transmission of information about joint movement occurs. Consequently, these factors are proposed to decreased balance, and thus functional performance, which may increase the risk for musculoskeletal injuries.4,21 Thus, the accurate evaluation of functional performance ability is important, for which various examinations are available. Teyhen et al. reported the correlation between the YBT and FPT scores including the crossover and 6-m timed hop test results, to verify the usefulness of the YBT.13 Their results were similar to that observed in this study, even though the FPT using Teyhen’s study was a more advanced performance. Therefore, in the early rehabilitation stage, because the YBT scores correlate with the FPT scores and the YBT is easier to start with and hop/functional tests come later, it could be a good addition for measuring functional performance after ACLR.
Previous researchers have reported correlations between the YBT and single-leg hop test scores of 0.35, and isokinetic muscle strength ranging from 0.294 to 0.591.6,13 Those results are similar to that of this study. Furthermore, the current study found that the YBT was closer to a dynamic test than to a static test, which matches the original purpose of the YBT.
This study had some limitations. First, this was a retrospective study. Therefore, a selection bias may have been present. Second, the activity level before surgery was not considered. The results of the evaluations may have varied depending on the physical ability of the patients, as well as their sex. Thus, further studies must be conducted on the general population as well as healthy athletes for comparison. Third, the one-year follow-up period was relatively short. Fourth, this study did not consider the influence of ankle and hip ROM and strength on the YBT scores.
Conclusion
The results of the current study demonstrate that post-ACLR YBT scores were correlated with functional performance tests and isokinetic measures of muscle strength, but not with static balance, joint laxity, and the HQ ratio. The YBT scores as a measure of balance are related to improved functional performance and isokinetic torque measures.
Acknowledgements
We would like to thank all the patients for their time and commitment to the present study.
Funding
Not applicable
Conflict of Interest
The authors declare that they have no potential conflicts of interest with respect to the research, authorship, or publication of this article.