


INTRODUCTION
The high and repetitive patellofemoral forces that occur during sport often results in high patellofemoral joint stress (patellofemoral force/patella contact area), which over time can lead to patellofemoral pain syndrome (PFPS). Lunging exercises, such as the side lunge and forward lunge, strengthen both hip and thigh musculature and are important rehabilitation and training exercises to enhance patellofemoral joint stability and improve optimal interaction between the femur and patella during activity and sport.1,2 Understanding what patellofemoral force and stress magnitudes are generated and how they vary while employing the forward and side lunge with step height variations may help clinicians better prescribe and progress lunging exercises to individuals with PFPS.
Although a few studies have examined patellofemoral biomechanics during the lunge exercise,3–5 patellofemoral force and stress has been examined only once in the literature during the side lunge exercise6 and only twice in the literature during the forward lunge exercise.7,8 Escamilla and colleagues7 employed a 12 repetition maximum (12 RM) weight to assess patellofemoral force and stress while performing the forward lunge using a long step and short step. In addition, Escamilla and colleagues6 employed a 12 repetition maximum (12 RM) weight to assess patellofemoral force and stress between the forward lunge and the side lunge, and both patellofemoral force and stress were greater in the side lunge compared to the forward lunge. Hofmann and colleagues8 examined patellofemoral force and stress for both the lead and trail limb while performing the forward lunge with no external resistance between forward and vertical trunk and shank positions.
In patellofemoral rehabilitation progression, lunging exercises are initially performed with no external resistance (bodyweight only) and progressed to using weights (dumbbells or barbells) or other external resistance, such as resistance bands, and this progression increases both hip and thigh muscle recruitment and patellofemoral force and stress.2,6,7 Moreover, both forward and side lunge exercises are commonly performed and progressed in knee rehabilitation settings using different step heights (ground level versus elevated platform). However, there are currently no studies in the literature that have examined patellofemoral force and stress during the bodyweight forward lunge and the bodyweight side lunge, or while lunging with step height variations. Therefore, the purpose of this study was to quantify, via calculated estimates, patellofemoral force and stress between two lunge type variations (forward lunge versus side lunge) and between two step height variations (ground level versus 10 cm platform). The hypotheses were that patellofemoral force and stress would be significantly greater throughout the knee range of motion when performing the bodyweight side lunge compared to the bodyweight forward lunge, and significantly greater when performing the forward and side lunge at ground level compared to up to a 10 cm platform.
METHODS
Subjects
Sixteen healthy participants (eight males and eight females) without a history of patellofemoral pathology participated with a mean (±SD) age, mass, and height of 28.9±7.9 y, 77.3±6.6 kg, and 175.9±2.3 cm, respectively, for males, and 30.6±9.8 y, 61.2±6.8 kg, and 166.4±8.5 cm, respectively, for females. Inclusion criteria included all participants being able to perform forward and side lunge pain-free with proper technique for 12 repetitions using bodyweighst and having at least five years’ experience in performing the forward and side lunge, and exclusion criteria included not achieving a 0°-20° forward trunk tilt or 0°-20° forward tilt of the tibia (which keeps the knee over the foot) at the lowest position of the forward and side lunge. All participants provided written informed consent in accordance with the Institutional Review Board at California State University, Sacramento.
Exercise Description
Each participant attended a pre-test session one week prior to testing and practiced performing the forward and side lunges at ground level (Figures 1A, B) and up a 10cm platform (Figures 1C, D). The starting position all four forward and side lunge variations were standing upright with both feet together. From the starting position, the participant lunged forward (forward lunge) or to the side (side lunge) with the right lower extremity towards a securely mounted force platform at ground level ([Figures 1]A, B) and to a securely mounted force platform 10 cm above ground level (Figures 1C,D), and then pushed back to the starting position. A metronome was used to help ensure the right knee flexed and extended at approximately 45°/s. The mean (±SD) step length (measured from left toe to right heel and based on participant preference) was 91.7±5.2 cm for males and 89.3±7.1 cm for females for the forward lunge and 99.3±4.9 cm for males and 98.4±5.8 cm for females for the side lunge. Each participant’s preferred step length measurement was used during data collection.
__side_lunge_at_ground_level_(b)__forward_lunge_up_to_a_1.png)
Data Collection
Blue Sensor (Ambu Inc., Linthicum, MD) disposable surface electrodes (type M-00-S; 22 mm wide and 30 mm long) were used to collect EMG data and were placed in a bipolar configuration along the longitudinal axis of each muscle, with a center-to-center distance of approximately 3 cm between electrodes.
Prior to applying the electrodes, the skin was prepared by shaving, abrading, and cleaning with isopropyl alcohol wipes to reduce skin impedance. Electrode pairs were then placed on the participant’s right side using previously described locations,6,7 for the following muscles: a) rectus femoris; b) vastus lateralis; c) vastus medialis; d) medial hamstrings (semimembranosus and semitendinosus); e) lateral hamstrings (biceps femoris); and f) gastrocnemius (middle portion between medial and lateral bellies).
For three-dimensional (3D) motion capture, spheres (3.8 cm in diameter) covered with reflective tape were attached to adhesives and positioned over the following bony landmarks as previously described:6,7 a) third metatarsal head of the right foot ; b) medial and lateral malleoli of the right leg; c) upper edges of the medial and lateral tibial plateaus of the right knee; d) posterosuperior greater trochanters of the left and right femurs; and e) lateral acromion of the right shoulder.
Once the electrodes and spheres were positioned, the participant warmed up and practiced the exercises as needed, and data collection commenced. An eight camera Vicon-Peak Performance motion analysis system (Vicon-Peak Performance Technologies, Inc., Englewood, CO) was used to collect 60 Hz video data. Force data were collected at 960 Hz using an AMTI force platform (Model OR6-6-2000, Advanced Mechanical Technologies, Inc.). EMG data were collected at 960 Hz using a Noraxon Myosystem unit (Noraxon USA, Inc., Scottsdale, AZ). The EMG amplifier bandwidth frequency was 10-500 Hz with an input impedance of 20,000 kΩ, and the common-mode rejection ratio was 130 dB. Video, EMG, and force data were electronically synchronized and simultaneously collected as each participant performed one set of three repetitions of the forward and side lunge at ground level and up a 10 cm platform, assigned in a random order.
Subsequent to completing all four lunge type and step height variations, EMG data were collected during maximum voluntary isometric contractions (MVIC) to normalize the EMG data collected during each lunge type and step height variation, as previously described.6,7 The MVIC for the rectus femoris, vastus lateralis, and vastus medialis were collected in a seated position at 90° knee and hip flexion during a maximum effort knee extension. The MVIC for the lateral and medial hamstrings were collected in the same seated position during a maximum effort knee flexion. MVIC for the gastrocnemius was collected during a maximum effort standing unilateral stance toe raise with the ankle positioned approximately halfway between neutral and full plantar flexion. Two trials (five second each) were collected for each MVIC of each muscle in a randomized order for the three muscle groups.
Data reduction
Video images for each reflective marker were tracked and digitized in 3D space with Vicon-Peak Performance software, utilizing the direct linear transformation calibration method. Testing of the accuracy of the calibration system resulted in reflective markers that could be located in 3D space with an error less than 0.3 cm. The raw position data were smoothed using a double-pass fourth order Butterworth low-pass filter with a cut-off frequency of 6 Hz.6,7,9 Joint angles, linear and angular velocities, and linear and angular accelerations were calculated in a 2D sagittal plane of the knee utilizing appropriate kinematic equations, as previously described.6,7,9
Raw EMG signals were full-waved rectified, smoothed using a 10 ms moving average window, and linear enveloped throughout the knee range of motion for each repetition.6,7,9 EMG data were then normalized for each muscle and expressed as a percentage of each participant’s highest corresponding MVIC trial. The MVIC was calculated using the highest EMG signal over a one second time interval throughout the five second MVIC trials, as previously described.6,7,9 Normalized EMG data for the three repetitions (trials) were then averaged at corresponding knee angles between 0-100° with 0° defining full knee extension, 0-100° defining the lunge descent, and 100-0° defining the lunge ascent. The EMG data were used only to calculate patellofemoral force and stress in a biomechanical knee model (see Appendix) and were not analyzed separately.
Data Analysis
A repeated measures 2-way analysis of variance (ANOVA) was initially employed (p < 0.05) for each 10° knee angle (from 10° to 100°) during the lunge descent and each 10° knee angle (from 100° to 10°) during the lunge ascent to assess the effects of lunge type (forward versus side lunge) and step height (ground level versus 10cm platform) on patellofemoral compressive force and stress. Subsequently, the Holm-Bonferroni sequential correction was employed to adjust the significance level secondary to multiple ANOVA’s being tested. Bonferroni t-tests were used to assess pairwise comparisons among the lunging conditions.
RESULTS
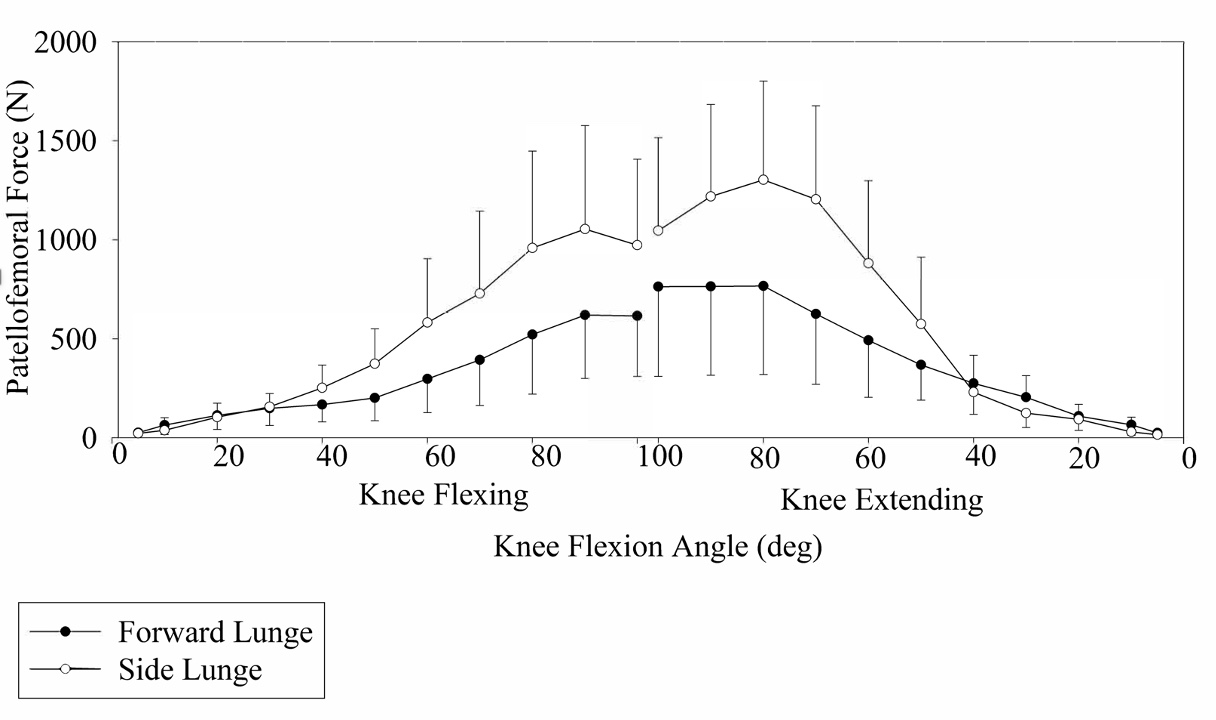
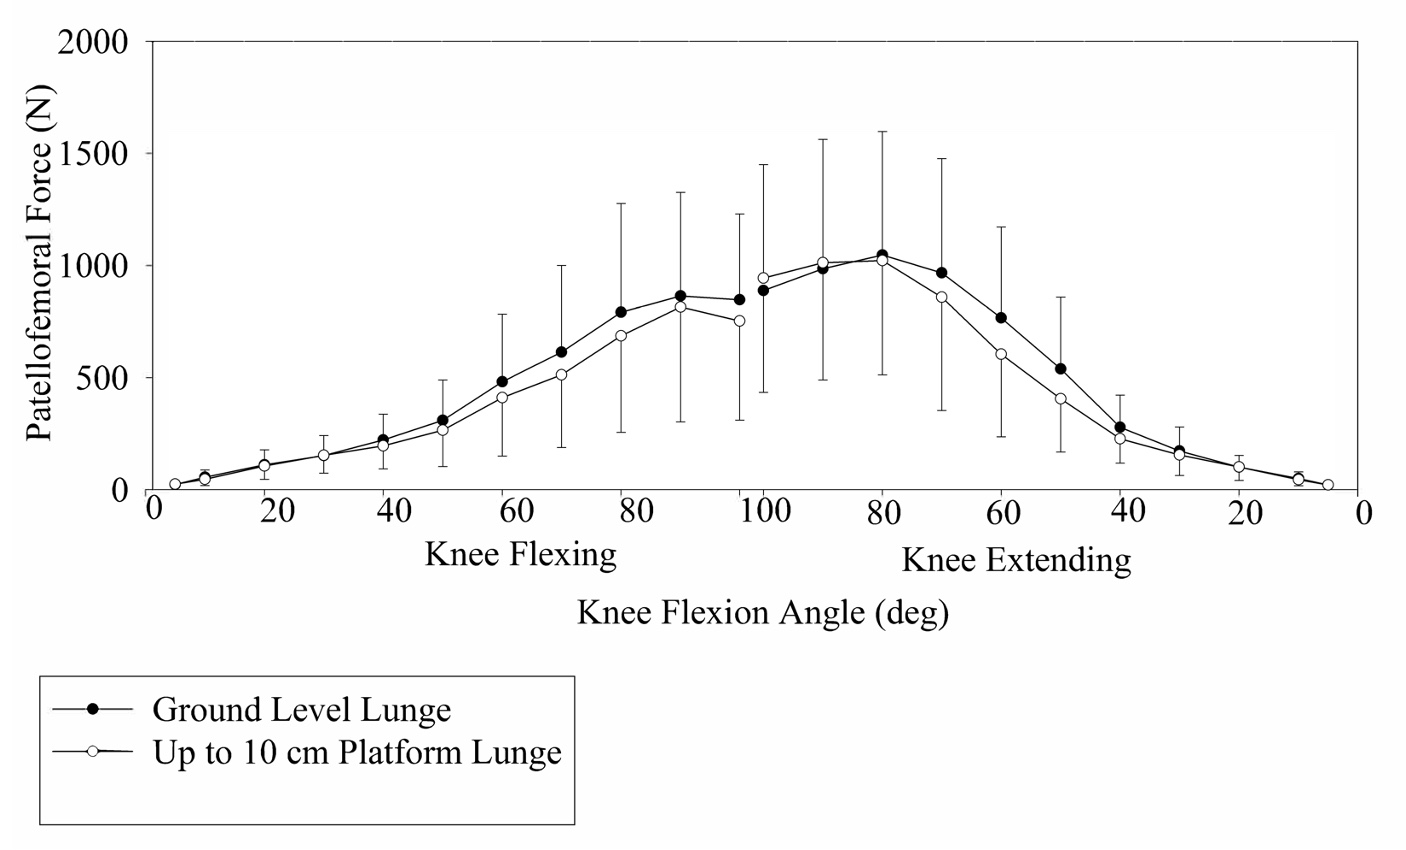
Descriptive data for calculated patellofemoral joint force and stress for each lunge type and step height condition are provided in Figures 2A-3B. Visual observation of the data suggest that patellofemoral joint force and stress generally increased progressively as knee flexion increased during the descent phase and decreased progressively as knee flexion decreased during the ascent phase. Moreover, for a given knee angle, patellofemoral joint force and stress were generally slightly greater during the ascent phases compared to the descent phases.
Tables 1 and 2 and Figures 2A and 2B provide patellofemoral joint force and stress values between the two lunge type conditions (forward versus side lunge) collapsed across the two step height conditions.
_patellofemoral_compressive_force_between_forward_lunge_and_side_lunge_collapsed.jpeg)
_patellofemoral_stress_between_forward_lunge_and_side_lunge_collapsed_across_ste.jpeg)
_patellofemoral_compressive_force_between_lunging_at_ground_level_and_up_to_10cm.jpeg)
_patellofemoral_stress_between_lunging_at_ground_level_and_up_to_10cm_platform_c.jpeg)
The p-values shown for the lunge type conditions represent the main effects of the ANOVA, with the results of the Holm-Bonferroni sequential correction showing significant differences for p-values less than or equal to 0.006.
At 10° knee angle during the lunge descent and at 10° and 30° knee angles during the lunge ascent patellofemoral force and stress were significantly greater in the forward lunge compared to the side lunge. In contrast, at 40°, 50°, 60°, 70°, 80°, 90°, and 100° knee angles during the lunge descent and at 50°, 60°, 70°, 80°, and 90° knee angles during the lunge ascent patellofemoral joint force and stress were significantly greater in the side lunge compared to the forward lunge.
Tables 1 and 2 and Figures 3A and 3B show patellofemoral joint force and stress values between the two step height conditions (ground level versus 10cm platform) collapsed across the two lunge type conditions. The p-values shown for the step height conditions represent the main effects of the ANOVA, with the results of the Holm-Bonferroni sequential correction showing significant differences for p-values less than or equal to 0.009. At 60° knee angle during the lunge descent and at 40°, 50°, and 60° knee angles during the lunge ascent patellofemoral joint force and stress were significantly greater lunging at ground level compared to lunging up to a 10 cm platform. There were no significant interactions between lunge type and step height.
DISCUSSION
This is the only known study that has examined the effects of lunging with various step heights on patellofemoral joint loading (compressive force and stress). Key findings include that there were greater patellofemoral force and stress at 1) lower knee angles (0° - 30°) for the forward lunge; 2) higher knee angles (40° - 100°) for the side lunge; and 3) middle knee angles (40° - 60°) lunging at ground level compared to lunging up a 10 cm platform. These findings provide insights to how the patellofemoral joint can be loaded and progressed in PFPS rehabilitation as a function of knee angle and step height. Early in PFPS rehabilitation where the initial goal is to minimize patellofemoral joint loading in order to minimize patellofemoral pain,10,11 performing “mini” lunges with lower knee angles between 0° - 40° may be appropriate given patellofemoral joint loading is relatively low (Figures 3A and 3B). Lunging within this lower knee angle range either at ground level or up to a 10 cm platform may both be appropriate given during this knee range patellofemoral joint loading was similar between step heights. As lunging progression moves beyond 40° knee angle towards higher knee angles, patellofemoral joint force and stress progressively increases exponentially (Figures 3A and 3B), and is greater lunging at ground level compared to up to a 10 cm platform, and is greater during the side lunge than the forward lunge. The lack of significant interactions implies the effects of step height variations were not affected by lunge type variations. Therefore, lunging progression as a function of knee angle and step height during PFPS rehabilitation may proceed as follows: 1) forward lunge at lower knee angles (0° - 30°) both at ground level and up to a 10 cm platform; 2) forward lunge at middle knee angle (0° - 60°) up to a 10 cm platform; 3) forward lunge at middle knee angle (0° - 60°) at ground level; 4) side lunge at middle knee angle (0° - 60°) up to a 10 cm platform; 5) side lunge at middle knee angle (0° - 60°) at ground level; 6) forward lunge at higher knee angle (0° - 100°) up to a 10 cm platform; 7) forward lunge at higher knee angle (0° - 100°) at ground level; 8) side lunge at higher knee angle (0° - 100°) up to a 10 cm platform; and 9) side lunge at higher knee angle (0° - 100°) at ground level*.*
In spite of lunging exercises being performed in training for sport and during PFPS rehabilitation, this is the first study to examine patellofemoral joint loading during the bodyweight lunge. Escamilla and colleagues6 did examine patellofemoral joint loading during the forward and side lunge, but these authors used a 12 RM external load, which is more appropriate in the latter stages of PFPS rehabilitation. In contrast, the bodyweight lunge, as studied herein is more appropriate earlier in PFPS rehabilitation. Like the current study, Escamilla et al.6 also reported significantly greater patellofemoral joint force and stress at higher knee angles (80° and higher) for the side lunge compared to the forward lunge, but unlike the current study these authors reported no significant differences in patellofemoral joint force and stress at middle knee angles between 40° -70°, which in the current study were greater in the side lunge compared to the forward lunge. Moreover, in Escamilla et al.6 there were no significant differences in patellofemoral joint force and stress between side and forward lunging at low knee angles between 0° -30°, while in the current study patellofemoral joint force and stress was greater in the forward lunge compared to the side lunge at 10° and 30° knee angles. Using external resistance versus bodyweight only not surprisingly increases patellofemoral joint force and stress, which at similar knee angles were two to three times greater in Escamilla et al.,6 who used a 12 RM lunging intensity, compared to the current study, which used the bodyweight lunge. Interestingly, the magnitudes of patellofemoral joint loading from Hofmann and colleagues,8 who also examined the bodyweight lunge, were more similar to patellofemoral joint loading of the 12 RM lunging intensity employed by Escamilla et al.6 compared to the bodyweight lunge in the current study. It is likely these differences in patellofemoral joint loading between these two studies are due to methodological differences.
Patellofemoral joint force and stress curves were similar in shape to each other due to near proportional increases in patellofemoral joint forces and patellar contact areas with increased knee flexion. One exception was at higher knee angles between 70-100°, in which patellofemoral joint stress began to plateau or decrease. This occurred because although patellar contact area increased nearly linearly between 70-100°, patellofemoral joint force did not increase proportionally, but instead began to plateau or decrease around 70° in the current study and around 70°-80° in numerous squat and lunge studies in the literature which quantified patellofemoral compressive force and stress.7,8,12 Therefore, injury risk to the patellofemoral joint may not increase with knee angles between 70-100° or greater due to similar magnitudes in patellofemoral joint stress during these knee angles, with the benefit of increased quadriceps, hamstrings, and gastrocnemius activity when training at higher knee angles 70°100° or higher compared to lower knee angles between 0°-60°.7,8,12
Because patellofemoral joint force and stress both increased with knee flexion and decreased with knee extension (Figures 2A-3B, Tables 1-2), a more functional knee flexion range between 0-50° may be appropriate during the early phases of patellofemoral rehabilitation when the goal is to minimize patellofemoral joint force and stress. High and repetitive patellofemoral stress may exacerbate PFPS and adversely affect numerous soft tissues, such as synovial plicae, infrapatellar fat pad, retinacula, joint capsule, and patellofemoral ligaments.13 High patellofemoral joint force can also elevate subchondral bone stress in the patellofemoral joint.14 Because the subchondral bone plate is rich in pain receptors,15 increased subchondral bone stress may also result in or exacerbate PFPS.13 Patellofemoral joint stress can result in cartilage degeneration and a decrease in the ability of the cartilage to absorb and distribute patellofemoral force.14 Higher knee angles between 60-100° may be more appropriate later in the rehabilitation process due to higher patellofemoral joint force and stress. This same pattern of increased patellofemoral joint force and stress with increased knee flexion during the forward and side lunge6–8 has been reported during the squat and leg press.9,12,16
Peak patellofemoral joint force and stress magnitudes from the current study for the bodyweight lunge are less than some weight bearing exercises, such as the weighted barbell squat and leg press,9,16,17 and going up and down stairs,18 but more than other weight bearing functional activities, such as walking.19 Escamilla et al.9 reported peak patellofemoral joint force and stress magnitudes of 4500-4700 N and 11-12 MPa, respectively, at 90° knee angle during the 12 RM barbell squat and machine leg press, and which are approximately 3-4 times greater than the peak force and stress magnitudes seen in the current study. Escamilla et al.16 also reported peak patellofemoral joint force and stress magnitudes of approximately 3500 N and 9 MPa, respectively, between 70°-80° knee angles during the 12 RM wall squat and one leg squat. Wallace et al.17 reported peak patellofemoral joint force and stress magnitudes of approximately 2400 N and 13 MPa, respectively, for the barbell squat using a 35% bodyweight external load, and approximately 1700 N and 9.3 MPa, respectively, for the bodyweight squat occurring at 90° knee angle. The approximate 1700 N peak patellofemoral compressive force during the bodyweight squat17 is similar although slightly more than the approximate 1300 N peak patellofemoral compressive force during the bodyweight side lunge in the current study. Peak patellofemoral joint force and stress in healthy participants during fast walking reportedly are approximately 900 N and 3.13 MPa, respectively,19 which is approximately 30% lower than the peak patellofemoral joint force for the side lunge in the current study and approximately 15% higher than the peak patellofemoral joint force for the forward lunge in the current study. However, the peak patellofemoral stress of 3.13 MPa during fast walking19 is similar to the peak patellofemoral stress of 3.25 MPa in the side lunge from the current study, but 35-40% higher than the patellofemoral peak force of 1.91 MPa in the forward lunge in the current study. Peak patellofemoral joint force and stress magnitudes in healthy participants going up and down stairs are approximately 2500 N and 7 MPa, respectively,19 which are similar to the peak patellofemoral joint force and stress magnitudes measured in the 12 RM forward lung reported by Escamilla et al.,6,7 but approximately two to three times as great as the peak force and stress magnitudes for the bodyweight side and forward lunge in the current study.
Unfortunately, it is currently unknown what patellofemoral joint force or stress magnitudes, and over what time duration, can ultimately lead to patellofemoral pathology. There are many factors that may contribute to patellofemoral pathology, such as overuse or trauma, dysfunctional extensor mechanism, weakness in the quadriceps or hip external rotators, tight quadriceps, hamstrings, or iliotibial band, lower extremity malalignment, and excessive rear-foot pronation. Nevertheless, clinicians can use information regarding patellofemoral joint force and stress magnitudes among different weight bearing exercises, technique variations, and functional activities to be able to make informed decisions regarding which exercise they choose to employ during patellofemoral rehabilitation.
There are limitations in the current study. Firstly, MRI knee kinematic data have shown during the weight bearing squat that the femur moves and rotates underneath a relatively stationary patella, and excessive femoral rotation may increase patellofemoral joint stress on the contralateral patellar facets.20 Unfortunately, MRI knee kinematic data do not currently exist while performing the forward or side lunge exercises. Therefore, it is unknown how much femoral rotation occurs during the forward and side lunge and how this rotation varies among healthy individuals and those with pathologies. Secondly, all biomechanical models also have limitations (see Appendix for biomechanical model and its limitations). Thirdly, patellofemoral joint stress magnitudes were measured using patellar contact area values from MRI data from the literature and were not measured directly for the included subjects. However, the contact areas used from the literature were determined during loaded weight bearing exercise in healthy male and female participants, similar to the current study. Moreover, the near linear and direct relationship between contact area and knee angle has been shown to be similar among studies.14,21,22 This implies that the patellofemoral joint stress curve patterns shown in Figures 2B and 3B using contact areas from the literature will be similar to patellofemoral joint stress curve patterns if contact areas were measured directly using MRI. The patellofemoral joint stress patterns are important to clinicians in determining what knee range of motions that patellofemoral joint stress increases or decreases.
CONCLUSIONS
Patellofemoral joint loading during lunging changes according to lunge type, step height, and knee angle. Patellofemoral compressive force and stress were greater while lunging at ground level compared to lunging up to a 10 cm platform between 40° - 60° knee angles, and greater while performing the side lunge compared to the forward lunge between 40° - 100° knee angles. The current findings can be used to help guide patellofemoral rehabilitation regarding the selection of forward and side lunge techniques involving lunging with different step heights. Furthermore, the results will assist exercise specialists who prescribe and progress forward and side lunge exercises in order to optimize hip and thigh strengthening and patellofemoral joint loading. These results may benefit athletes who employ sport specific lunging movements to enhance their return to sport and performance while optimally loading the patellofemoral joint.
Conflict of Interest
The authors of this manuscript affirm we have no financial affiliation (including research funding) or involvement with any commercial organization that has a direct financial interest in any matter included in this manuscript. The authors of this manuscript also affirm they have no conflict of interest of any kind.
Protocol used in current study was approved by Institutional Review Board at Sacramento State.