INTRODUCTION
Baseball throwing generates high velocity and forces through the arm,1–3 which contribute to unique osseous and soft tissue glenohumeral joint adaptations.4,5 These shoulder adaptations contribute to changes in shoulder range of motion, specifically to increased external rotation and decreased internal rotation in comparison to the nondominant arm.6 These unique throwing specific shoulder adaptations have been associated with arm injuries in baseball players.4,7
While soft tissue adaptations affect throwing specific shoulder range of motion,8 the underlying osseous structural transformations also contribute to throwing shoulder range of motion.9 These osseous shoulder structural adaptations are termed humeral torsion (HT). HT is measured through the line that bisects the humeral head articular surface and the transepicondylar axis.10 During youth and adolescence, the high humeral forces generated during pitching effect osseous growth and development, contributing to the diminution of humeral anatomical neck and head antetorsion that occurs with aging.11 These structural adaptations are important for throwing development12; however, they are also linked to arm injury risk.9
Within clinical practice, HT can be calculated indirectly through ultrasonic methods.5 However, this equipment is expensive, preventing many clinics and clinicians from assessing HT, hindering clinical examination. One way to arrive at clinical measures is through prediction modelling.13 Statistical prediction modelling uses traditional regression based methods to obtain a risk or probability.14 More recently, machine learning algorithms (such as random forests, gradient boosting machines, support vector machines, and neural networks) have been purported to offer increased flexibility to capture nonlinearities and higher order interactions.15,16 Machine learning uses general purpose algorithms that identify data patterns, using minimal data assumptions,17 and are being increasingly used in the medical setting.18,19 As a result, there is widespread interest in exploring the usefulness of modern machine learning methods for increasing prediction accuracy compared to more regression based statistical approaches.20
Humeral torsion is an important osseous adaptation in throwing athletes that can contribute to arm injuries.9 Machine learning algorithms offer an alternative strategy to predict outcomes in data with high complexity. Comparing and contrasting regression based statistical and machine learning approaches can help identify the most promising prediction model to be implemented in the clinical setting. Therefore, the purpose of this study was to develop prediction models using a range of machine learning methods to predict professional baseball pitcher HT and compare these models to a traditional regression-based prediction model.
METHODS
Study Design
A prospective cohort study was conducted from 2009 to 2019 on Minor League pitchers in one Major League Baseball organization. Only preseason data were utilized in this study and pitchers were only included once within the dataset. Participants were excluded from the study if 1) the athlete played a primary position other than pitcher, 2) they were being treated for a shoulder or elbow injury at the beginning of the season, or 3) they were unable to participate on the first day of practice because of upper extremity injury. Prior to data collection, all participants were informed of the risks and benefits of study participation and participants gave verbal and written consent to study participation. The PRISMA health system Institutional Review Board approved this study.
Data Collection
Before the beginning of the season, all baseball players were questioned for arm dominance, prior baseball experience, injury history, and position(s) played. Participants were then examined for current height (cm) and mass (kg). Participants were then examined for passive shoulder PROM and HT. Shoulder PROM testing was randomized for each participant, and examiners were blinded to hand dominance throughout the study.21 Two examiners performed all measurements for the entire cohort.
Predictors
Predictors included player demographics (age, hand dominance, previous baseball participation, injury history, position played, and continent of origin), shoulder PROM, and injury history. Shoulder ROM and injury history are further described below.
Shoulder Range of Motion
All shoulder PROM (external rotation [ER], internal rotation [IR] and horizontal adduction [HA]) was measured supine on a standardized plinth table by two examiners using a digital inclinometer per previously described methods.22–25 Two trials were performed per shoulder measurement, and the average of these two trials was used for data analysis. Shoulder PROM was calculated on 10 participants prior to data collection for the two examiners. Shoulder PROM intra- and inter-rater reliability was excellent for ER and IR (ICC(2,1) and ICC (2,k) = 0.92-0.99) and HA (ICC(2,1) and ICC (2,k) = 0.92-0.99), and the standard error of measurement was 2°-4° for shoulder ER, IR, and HA.
Injury History
A shoulder or elbow injury was defined as any traumatic or overuse injury that occurred during any baseball team sponsored activity (from the beginning of preseason through the last post season game) to any muscle, joint, tendon, ligament, bone, or nerve that required medical attention.26 Injuries were further designated by dominant and nondominant arm. An independent examiner, blinded to physical measurements, reviewed medical documents to determine the diagnosis, duration of treatment, and the time to clearance for return to full sport participation.
Outcome
Humeral Torsion (HT)
Dominant HT was measured supine on a standardized plinth table with the shoulder in 90° of abduction. One examiner, using a 5 mHz ultrasonographic transducer (Sonosite Inc, Bothell, WA, USA) measured HT. The ultrasonographic transducer was placed level, confirmed with a bubble level, on the anterior shoulder, perpendicular to the long axis of the humerus. The humerus was then rotated until the apexes of the greater and lesser tubercles could be visualized parallel to the horizontal plane. The second examiner placed a digital inclinometer on the ulnar side of the forearm, measuring the forearm inclination angle with respect to the horizontal, which indirectly measures HT.5 Two trials were performed per HT measurement, and the average of these two trials was used for data analysis. HT reliability was calculated on 10 participants prior to data collection for the two examiners. Humeral torsion intra- and inter-rater reliability was excellent (ICC(2,1) and ICC (2,k) 0.93-0.97) and the standard error of measure was 2-4°.
Statistical Analyses
All data were investigated for missingness prior to analyses, using the R package naniar. Missing data were low (Shoulder ROM: 3%, age: <1%, HT: 2%), thus complete case analyses were performed. Descriptive statistics were reported by mean (standard deviation), median (interquartile range), and frequencies and percentages for categorical variables.
Sample Size Considerations
For the statistical modelling, an a priori sample size calculation was performed with the R package pmsampsize.27 Referencing a previous meta-analysis and meta-regression,9 mean HT was 28°, standard deviation was 4°, and R2 was 0.38. The a priori statistical regression prediction model was determined to incorporate ten degrees of freedom (i.e., parameters). As a result, a total of 246 baseball players were required to reduce the risk of overfitting.
Model Development
The transparent reporting of a multivariable prediction model for individual prognosis or diagnosis (TRIPOD) were followed for all model development.28
Statistical Model
A linear regression model to predict HT was developed, using predictor variables including: Predictor variables included: (1) age,29 (2) arm dominance (Left or Right handed),30,31 (3) shoulder IR,9 (4) shoulder ER,9 (5) shoulder HA,32 (6) continent of origin (North America or Latin America),33 (7) previous shoulder or elbow injury.34 Linearity was not assumed; as a result, continuous predictors were assessed for non-linearity with restricted cubic splines. Restricted cubic splines were calculated with three, four, and five knots with the R package rms. All continuous predictors demonstrated a linear relationship to HT. Interactions were also analyzed, with no predictors observed to have an interaction relationship with HT. Internal validation was performed with a 10-fold cross validation. Internal validation is performed to reduce optimism bias, as models are overly optimistic on the developed dataset.35,36 The R package caret was used to performed cross validation.
Four machine learning models (Random Forest, Gradient Boosting Machine [GBM], Support Vector Machine Regression [SVM], and Artificial Neural Networks [ANN]) were developed to predict HT using an iterative hyperparameter tuning process. Hyperparamter tuning consisted of using a grid search process. All machine learning models incorporated all the same predictors used to develop the linear regression model. The R packages randomForest, gbm, kernlab and e1071, and neuralnet were used for random forest, GBM, SVM, and ANN models. For full description of the machine learning models, tuning variables, final hyperparameters, and complete code, please refer to the Appendix. Following model development, all machine learning models, besides ANN, were internally validated with a 10-fold cross validation. The ANN model was replicated 100 times.
Model performance was assessed with root mean square error (RMSE), calibration and R2. Root mean square error is the error of the model reported in outcome units (i.e., degrees), with lower error demonstrating improved prediction performance. Calibration is the agreement of predicted and actual outcome (i.e., HT), with a calibration of 1 equalling best calibration.35,36
RESULTS
A total of 407 pitchers with a mean age of 23.2 years (sd = 2.4), BMI of 25.1 km/m2 (sd = 2.3) were eligible and included (Table 1).
Generalized Linear Regression Model
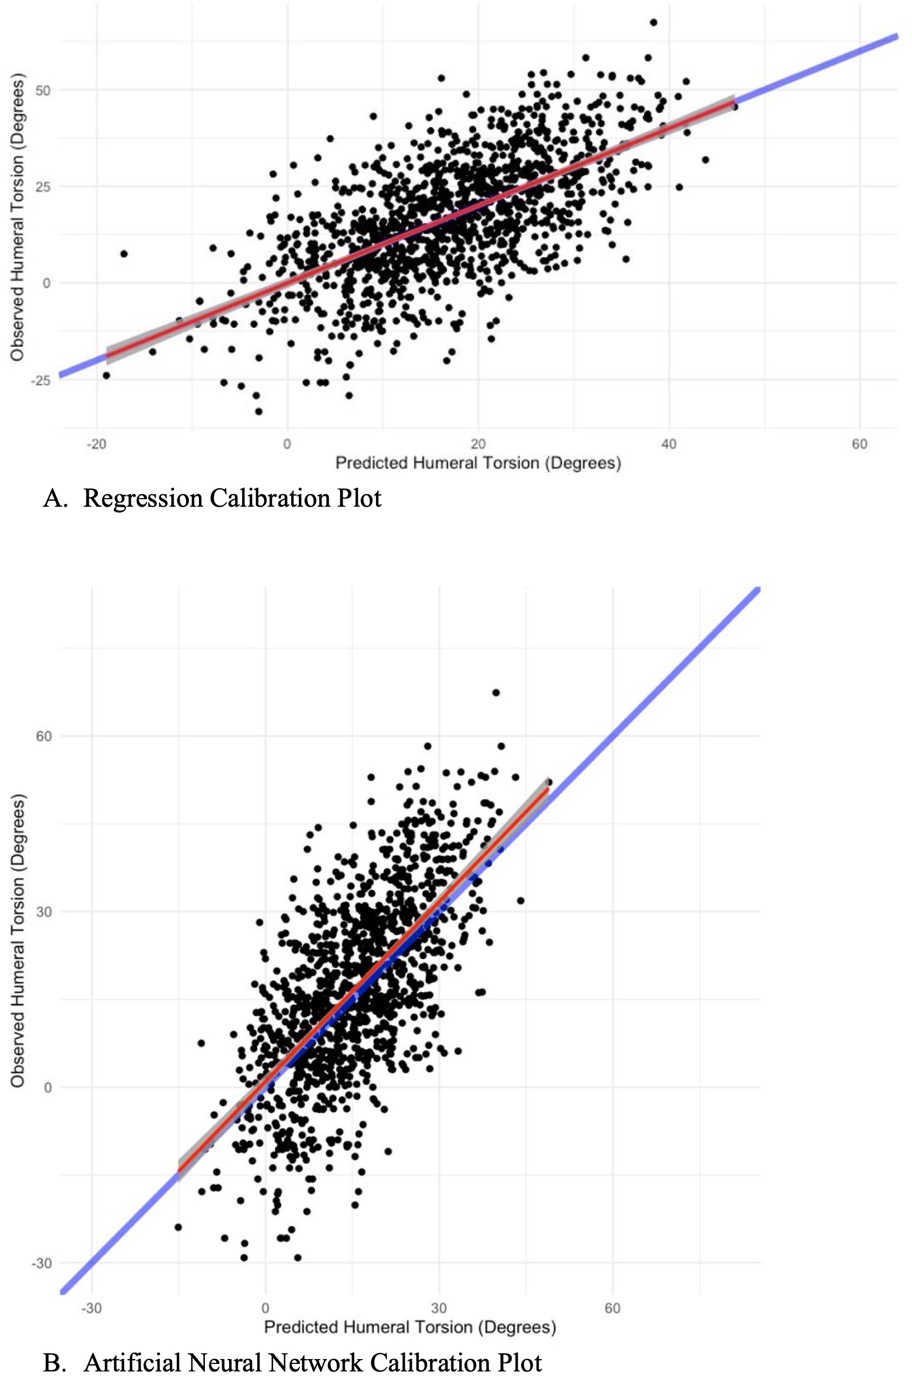
Final model RMSE was 12°, calibration was 1.00 (95% CI: 0.94, 1.06); Table 2; Figure 1A), and R2 was 0.41. The mean distribution of the final model linear predictors was 17°, the standard deviation was 10°, the minimum was -19°, and the maximum was 48°. For full model report, please refer to the Appendix.
_and_artificial_neural_network_(b).jpeg)
Machine Learning Models
The random forest and GBM demonstrated the best RMSE (Table 2). The random forest demonstrated the worst calibration (Table 2) and the ANN demonstrated the best calibration (Table 2; Figure 1B). The mean distribution of the final model linear predictors was 16° to 17°, the standard deviation was ranged from 9° to 10°, the minimum ranged from -2°1 to -11°, and the maximum was ranged from 44° to 52°. For each calibration plot and a full pictorial description of the final ANN architecture, please refer to the Appendix.
DISCUSSION
The machine learning models, besides ANN, demonstrated improved RMSE, compared to the statistical prediction model. Interestingly, the random forest and GBM RMSE difference compared to the linear regression model was similar to the HT standard error of measure (2-4°). However, all machine learning models demonstrated poor calibration compared to the linear regression prediction model. All prediction models demonstrated similar mean and variance calculations for predicted values. These findings suggest that prediction model performance should be evaluated through multiple performance metrics.
The machine learning models demonstrated decreased RMSE compared to the linear regression model. RMSE reports the average prediction model error in the units of the outcome of interest, which in this case is degrees of HT.37 This allows for a clinically pertinent and interpretable comparison of model performance. The random forest and GBM demonstrated decreased RMSE similar to the reliability HT standard error of measure, which may demonstrate a clinically significant difference. Both the random forest and GBM methods employ ensemble methods to generate prediction models.38,39 Ensemble methods have been shown to increase overall prediction precision due to the meta-aggregation of multiple models, allowing for increased generalizability in highly complex data.40 Further, the SVM model demonstrated a RMSE difference just below to the standard error of measure in comparison to the statistical model. SVMs utilize spatial kernel-based methods to inform predictions. Due to the individuality affecting HT development,12 the visual hyperplane demarcation methods used by SVM may generate improved HT prediction.
Although ML methods demonstrated decreased RMSE, calibration was poor. All machine learning methods demonstrated worse calibration compared to the statistical model, with the ANN a three-point slope difference. Calibration assesses the prediction outcome versus the actual outcome, and is important in understanding the accuracy of predictions.41 Over calibration has been reported as potentially harmful in the clinical setting, with miscalibration above 5% potentially affecting clinical decisions.42 These worse calibration performing machine learning methods, besides the ANN model, demonstrated a calibration slope in excess of 1.09, with the random forest model having a calibration slope of 1.33. Upon visual inspection of the calibration plots, all three models had significant demarcation at both tails of the calibration slope. These calibration discrepancies may be due to the biological volatility of individual outliers. Baseball players may have different genetic, environmental, and overall baseball loading factors, which all contribute to HT. Due to the algorithmic nature of machine learning, these outliers may have indiscriminately affected overall calibration. However, the ANN model had similar calibration compared to the statistical mode. ANN’s are high performers in predictions involving complex and multiple interaction data.43 As stated above, the complex issue individual variability, may allow for ANN’s to demonstrate high calibration performance.
All machine learning and linear regression models demonstrated similar mean and variance of predicted outcomes. These predictions are greater than those reported in a previous meta-analysis.9 While all models demonstrated similar prediction HT outcomes, there were distinct differences in model performance parameters. These findings highlight that model performance should be evaluated on multiple parameters, and not just on one specific performance finding. Clinicians need to integrate multiple prediction model performance outcomes, including discrimination, calibration, and model error, where appropriate, when evaluating the efficacy of a prediction model.41
These findings warrant future research. External validation is required to evaluate the generalizability of these models. HT development may be influenced by the volume and speed of throwing.12 Further research is needed to decipher if incorporating lifetime baseball exposure and throwing velocity could aid in prediction model precision. Other genetic factors such as collagen phenotype and familial history may also affect HT. Incorporating these predictors would be beneficial in evaluating the prediction ability of these models. Finally, the clinical utility of these prediction models needs to be evaluated. Understanding how these models may affect clinical practice and decisions in comparison to standard evidence-based practice is needed.
Clinical Implications
Model RMSE ranged from 9° to 15° for all models, with the statistical regression model RMSE was 12. The HT standard error of measure in professional pitchers is 2 degrees.44 Professional pitchers with 5 degrees HT difference between their throwing and non-throwing arms has been previously determined to pose greater risk for arm injury.45 As RMSE was reported in degrees, the RMSE may be beyond the clinically important error, and affect pitching arm risk assessment.5 However, arm injury examination encompasses multiple factors,4,46,47 and this HT prediction model could be used in conjunction of multiple other clinical tests and measures in order to prescribe a personalized injury mitigation program.
Practical Example
To aid in clinical applicability an example is described. As the machine learning models did not improve HT prediction, the ease of use and interpretability of the statistical model is recommended for clinical implementation. The statistical model is calculated through a mathematical equation to predict HT. This equation can be inputted into a standardized Excel or other basic computer program. For example, consider a 22-year-old right-handed pitcher from North America, with 35 degrees of IR, 103 degrees of ER, and 2 degrees of HA. During the clinical interview, the pitcher did not report any current or prior arm injuries. Using the equation reported in the supplement: 33.01 (The Intercept) + 22*0.15 (Age) – 1.83 (Right-Handed) + 35*0.37 (IR) - 103*0.30 (ER) + 2*0.31 (HA) + 0 (North America) + 0 (No Injury History) the model predicts this pitcher’s right HT is 18 degrees.48
Strengths and Potential Limitations
This study utilized a large sample of professional baseball pitchers that exceeded the a priori required sample size which increases the precision of these results. Multiple models were performed, incorporating both machine learning and statistical prediction model techniques, which increases the comparability of these findings. Internal validation was performed on all findings, allowing for a realistic optimism corrected model estimate, increasing the validity of these results. External validation was not performed on these models, decreasing the generalizability of these models. While many machine learning methods suggest splitting data into training and testing sets,49,50 this decreases the power and precision of these models.51,52 While this data met the a priori sample size calculations for linear regression, this sample size calculation may be too small for machine learning models.53 Further, these data did not allow for a training and testing split to maintain proper power. Previous authors51,52,54 have recommended to utilize all data during model development, and use robust internal validation methods to correct for optimism. As a result, cross-validation was used for internal validation on these prediction models.
Conclusions
Machine learning models demonstrated improved root mean square error and poorer calibration compared to the statistical model. Machine learning did not improve HT prediction in professional baseball players compared to a traditional statistical model. The root mean square error of all models was greater than the standard error of measure and clinically important difference, which may hinder the clinical usefulness of these models. It is recommended that clinicians use the statistical model in practice in conjunction with other examination factors, as this model provides an easy-to-use equation, that can quickly and efficiency be integrated within a clinical setting. Future research is needed to evaluate if environmental and genetic factors can improve HT prediction.
Declarations of interest
The authors declare no conflicts of interest.
Funding
This research did not receive any specific grant from funding agencies in the public, commercial, or not-for-profit sectors.