
Introduction
Prevalence
Awareness of concussions is at an all-time high. Since 2000, more than 360,000 traumatic brain injuries (TBI) have been diagnosed within the Department of Defense (DoD), and over 315,000 of those are considered to be mild TBI (mTBI), otherwise known as concussion.1,2 Over a five-year period these injuries accumulate medical and disability costs to the DoD exceeding $700,000,000.3 Concussion injury, diagnosis, and care are being closely monitored by a network of DoD and National Collegiate Athlete Association (NCAA) entities operating with a renewed grant of $22,500,000.4 At a military service academy, about two cadets per 100 are reported concussed each year during boxing class, a required 20-hour instructional course.5 In a systematic review by Koh et al the greatest frequencies of concussive episodes were observed with recreational male boxers and female taekwondo participants.6 Boxing has been demonstrated to cause half the impact but twice the rotational force as contact injuries in football.7 The rotational and shearing forces applied to the brain during head trauma can be detrimental resulting in concussion.8 These are forces such as a whiplash effect in the sagittal plane or rotation in the transverse plane. There are concerns that repeated episodes of concussion may lead to cumulative and worsening effects including increased neuropsychological deficits and decreased postural stability.9–12 Impaired postural stability following concussion may be a result of inaccurately processing information from the somatosensory, visual, and vestibular systems manifesting as balance deficits.10,13–16 Considering the multiple repercussions of concussion injury to include affecting somatosensory, visual, and vestibular components of balance, it is important for clinicians to incorporate balance assessment.
Need for Standardized Assessment
As concussion evaluation becomes more commonplace, the need for a standardized assessment tool or protocol becomes apparent. A major factor of a concussive episode, and the recovery from it, is vestibular function.8,17,18 The vestibular system, consisting of semi-circular canals which sense rotational movements and otolith organs that sense linear acceleration, provide a sense of balance and spatial orientation for the purpose of coordinating movement. Vestibular function is best measured by caloric testing as the gold standard.19 Rotary chair or vestibular-evoked myogenic potentials are also reliable tests of vestibular function.20 However, a more practical approach may be to evaluate an individual’s balance instead. Although not an exact measure of vestibular function, balance is a component that may be easily quantified.21 Vestibular testing is a critical part of determining the extent of a concussive episode and several tests have been proposed as possible solutions including Vestibular Ocular Motor Screening Assessment (VOMS), Balance Error Scoring System (BESS), and the Post-Concussion Symptom Scale (PCSS).22–24 Balance has been observed to recover quickly, and the timing of recovery has been serially studied by quantifying postural sway with BESS and Sensory Organization Test (SOT) by Guskiewicz et al.25 Another study observed that acute mild head injury produced decreased stability until approximately three days post injury.10 While useful, the BESS, VOMS, and PCSS may be subject to the concussed individual’s perceptions with moderate to poor reliability and are prone to human error dependent upon the experience and ability of the evaluator.10,24,26–29
Baseline Testing
The NeuroCom SOT is computer-controlled balance machine used to objectively quantify the balance component of the vestibular system’s functionality and impairment. Because it is computerized, it reduces chance for human error. It has demonstrated test-retest reliability for the measure of balance function in several studies, although Broglio et al questioned whether the NeuroCom could be used as a sole measure of vestibular function.23,30,31 Ferber-Viart et al observed SOT scores for 64 participants 20 years of age, and current manufacturer baseline measures for the SOT were established for 195 participants age 20-79.32,33 However, these sample sizes are too small in number and age ranges used for baseline measurements are too broad to determine generalizable normative values for this population. The young, active, healthy military population that will be expected to lead future armed forces requires its own normative values.
Need for Reliability Measures
The SOT has previously been utilized in highly-trained groups of experienced special operations military personnel with the intent to establish baseline results, provide data for future studies, and to identify those at risk for lower extremity injury.30 Since the SOT measures balance from visual, vestibular, and somatosensory contributions, it may be more suited to concussion evaluation than prediction of musculoskeletal injury. Clinically, the SOT has been shown to be sensitive to functional deficiencies in the visual, vestibular, and somatosensory systems often seen after concussion, and has been used to track recovery from concussion.34,35 The primary outcome of the SOT is the equilibrium score, a composite (COMP) of all three balance components.
To the knowledge of the authors, baseline SOT measures for balance function of young, healthy, active, military 17-23-year-old individuals have not been previously reported. The primary purpose of this study was to establish baseline SOT measures for the population that will be useful in the concussion assessment, diagnosis, and return to duty decisions following a concussion. Furthermore, secondary aims are to determine if there are differences in SOT scores between females and males, or in those with and without a concussive history. Females are grossly under-represented in the available concussion literature.6 In a time where females are included in combat arms and exposed to increased possibility of head injury, more data of baseline balance function in women may prove useful in the evaluation and recovery of concussion.
Methods
This study was a cross-sectional design for obtaining normative values. The authors established baseline measures for this group in preparation for future studies of balance associated with concussion.
Participants
All participants were screened for the following inclusion criteria: 1) between the ages of 17-26 years old, 2) enrolled in boxing class at this service academy, and 3) read and speak English well enough to provide informed consent and follow study instructions. If a cadet had a lower extremity, low back, or concussion injury that precluded NeuroCom testing they were excluded. All participants were informed of the testing procedures and signed a written consent form approved by the institutional review board. All testing was conducted at the physical therapy clinic at this service academy.
Procedures
Participants were recruited from a required boxing class at the academy. This service academy conducted 16 boxing classes of 16-22 cadets twice every semester beginning in August, October, January, and March of the 2018-2019 academic year. Participants were recruited by direct contact during the first two days of class, prior to any striking taking place. Data were collected by four members of the research team, all trained in operation of the NeuroCom Balance Manager by the same NeuroCom continuing education instructor. Prior to testing, each participant completed a short questionnaire regarding their concussion history and demographic information to include age, height, mass, and year in college. Participants were placed in a safety harness and positioned barefoot on the NeuroCom Balance Manager with standardized foot placement relative to their height. Data collectors followed standardized written instruction following the SOT protocol to include verbal cues for each trial of each condition.33 Participants stood with arms relaxed at the side, looking straight forward as still as possible. The participants performed all six of the SOT conditions repeating each 20-second trial three times. Each person completed testing as shown in Figure 1 and Table 1.30,33

Instrumentation
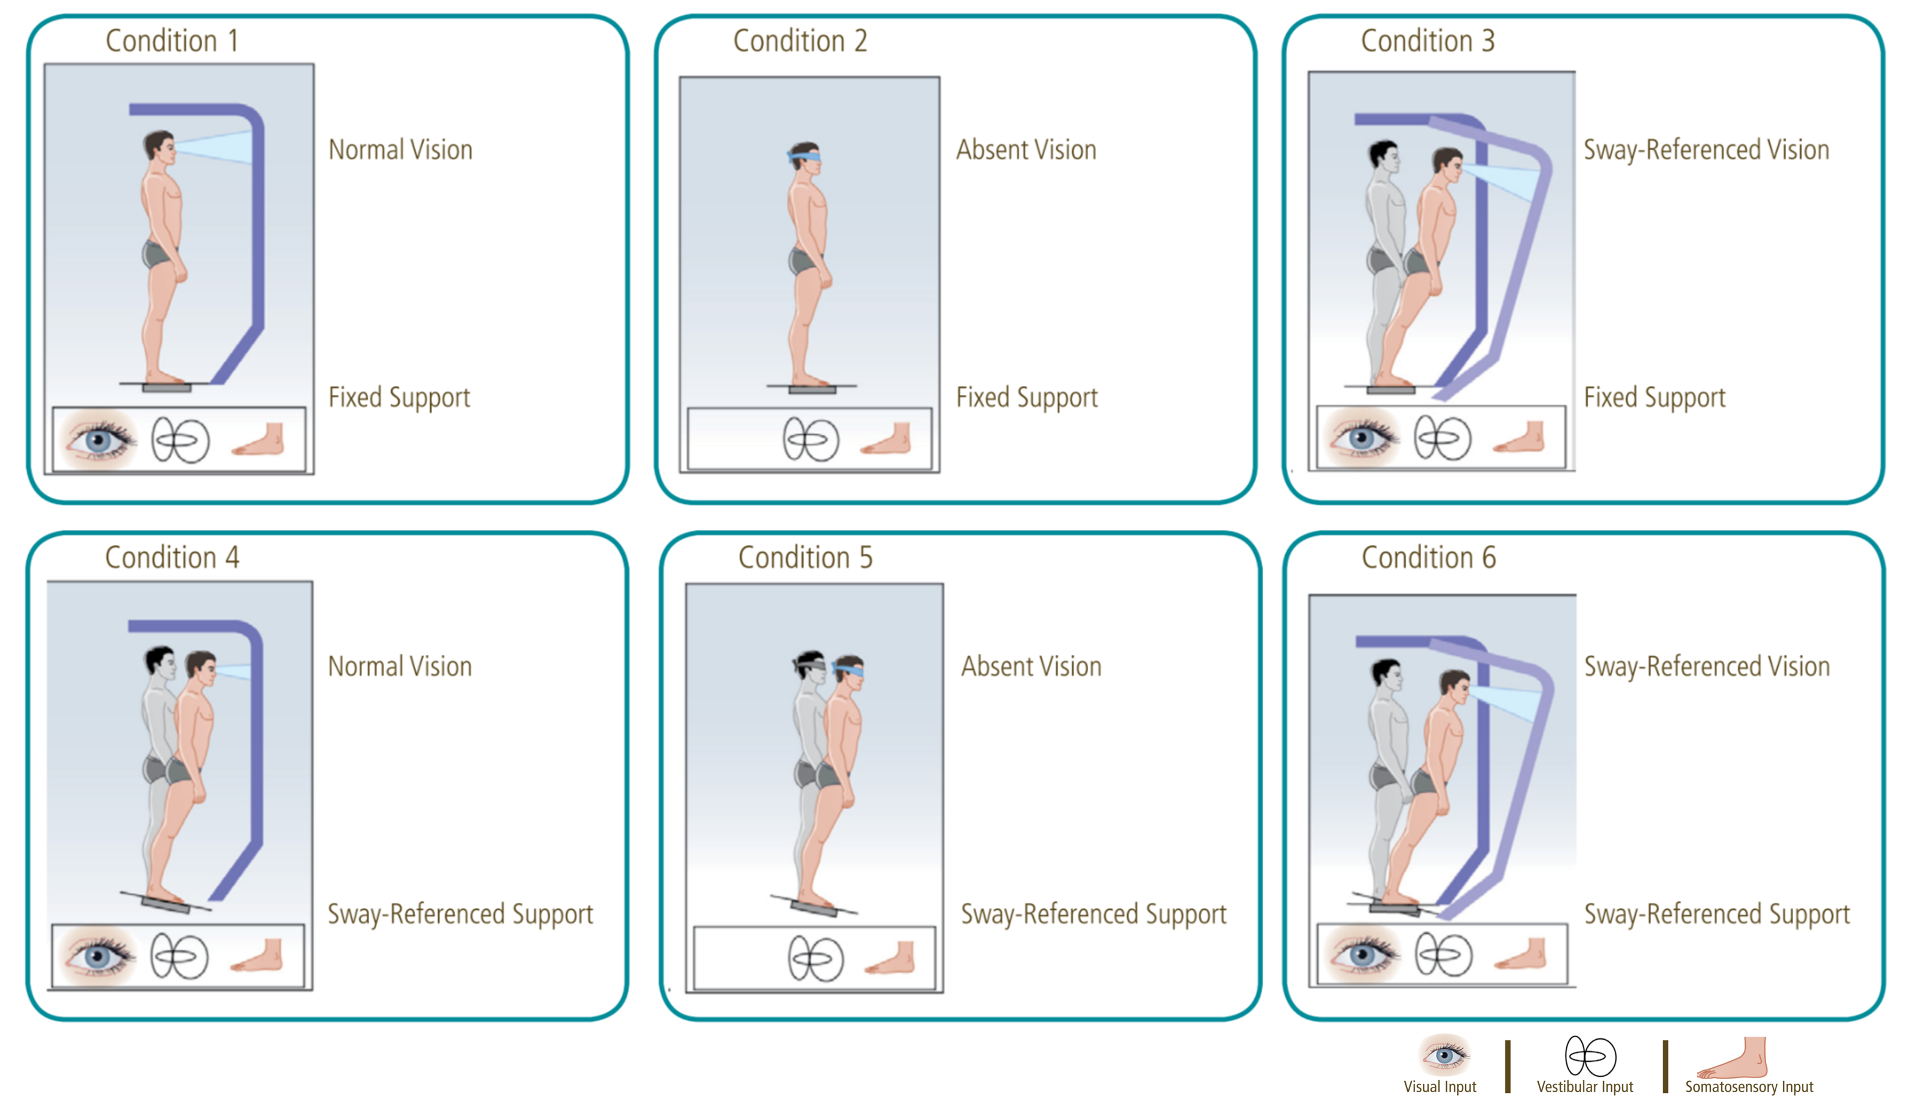
A NeuroCom Balance Manager (Natus Medical Inc., Seattle, WA) equipped with SMART EquiTest/InVision/HS-SOT (software version 9.2, 2014) was used to assess postural stability. The Balance Manager is equipped with two 9 x 18 inches (23 x 46 centimeters) force plates connected by a pin joint.37 Both the support surface and the visual surroundings rotate in the sagittal plane referenced to the participant’s sway and sway velocity. Visual stabilization synchronizes center of gravity (COG) movement in the sagittal plane with the participant’s visual surround. Somatosensory stabilization tilts the support surface about a sagittal axis parallel to the axis through the ankle joints.38 The individual is presented with six conditions of varying sensory input including eyes open with fixed support (Condition 1), eyes closed with fixed support (Condition 2) , sway surround with fixed support (Condition 3), eyes open with sway support (Condition 4), eyes closed with sway support (Condition 5), and sway surround with sway support (Condition 6). This test is used to evaluate the individual’s use of somatosensory, visual, and vestibular input to maintain their balance.30
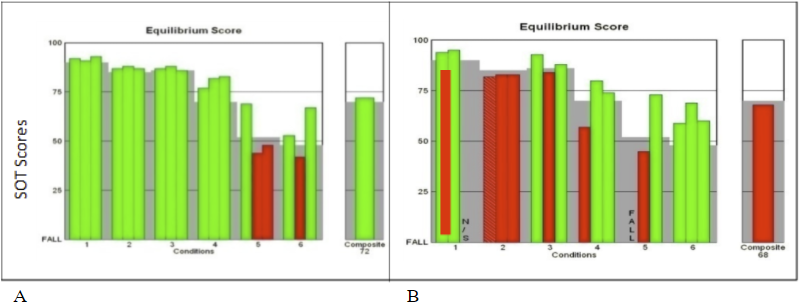
In this way, the SOT conditions create sensory-conflict situations.30 Participants need to compensate for these sensory conflicts and maintain their balance. An equilibrium score is given based on staying within 8.5 degrees in the anterior direction and 4 degrees in the posterior direction as previously established on the SOT and measured by the automated device. Less postural sway indicates better postural stability in the sagittal plane, producing a commensurate equilibrium score (greater is better). If the participant falls (lifts the toes or heels from contact with the force plate, takes a step, touches the surround, or falls to the point of the harness taking weight) or receives a negative value by swaying outside 12.5 total degrees, they receive an equilibrium score of 0 for that trial. The more difficult conditions (3-6) receive greater weights, and an overall composite equilibrium (COMP) score uses the weighted average of all scores (see Figure 2).30,39 A greater composite score indicates better postural control. Specific sensory systems are identified by using ratio combinations of average equilibrium scores for each condition (see Table 2).30,33

The sensory analysis ratio scores for the somatosensory, visual, and vestibular systems express how well a participant is able to use those specific cues for balance. The somatosensory ratio (SOM) compares Condition 2 with Condition 1 and reflects the participant’s ability to use input from the somatosensory system to maintain balance. The visual ratio (VIS) is obtained by comparing Condition 4 with Condition 1. The VIS ratio reflects a participant’s ability to use input from the visual system to maintain balance. The vestibular ratio (VEST) is computed from scores obtained in Condition 5 and Condition 1. This ratio indicates the relative reduction in postural stability when visual and somatosensory inputs are simultaneously disrupted. The preference ratio (PREF) compares Conditions 3 and 6 with Conditions 2 and 5. The PREF ratio indicates the extent to which the participant relies on visual information to maintain balance, even when this information is incorrect.33
Statistical Analysis
Descriptive statistics for all participants were computed. Means and standard deviations, as well as medians and interquartile ranges, for the descriptive evaluation and the normative SOT data were produced for females and males separately, concussive history and never concussed separately, and for all participants combined. Normality was examined with a Shapiro-Wilk test. Levene’s test was utilized to measure homogeneity of variance. Skewness and kurtosis were calculated. SOT output was collected and electronically imported into Excel (Microsoft Office 2016). Data include equilibrium scores as described above. These data were entered in the statistical package R version x64 (3.4.4.) and SPSS version 25. The non-parametric Mann-Whitney U test (known as two-sample Wilcoxon test in R) was used for comparison of SOT condition scores and ratio scores between genders, as well as between those with concussive history and those never concussed. A Bonferroni-Holm correction was planned to mitigate risks associated with multiple comparisons (α = 0.002).
Results
Participants included 253 cadets ages 17-23, 70 females (mean age 18.77 ± 1.00 years, height 173.55 ± 9.86 centimeters, mass 74.89 ± 13.74 kilograms) and 183 males (mean age 18.85 ± 1.12 years, height 175.66 ± 9.05 centimeters, mass 76.07 ± 12.81 kilograms). Male and female populations were proportionally represented, as the freshman class at the service academy approached 25% female in the 2018-2019 academic year. Forty-one participants (16%) reported a lifetime history of concussion prior to the study, five of which had had a concussive episode within the previous six months, and 212 had never experienced a concussion. Descriptive statistics for demographics of the sample are reported in Table 3. The combined group COMP score on the SOT was 76.60 ± 7.61. Mean scores between females (COMP = 76.67 ± 7.25) and males (COMP = 76.57 ± 7.77) were not different (p = 0.76, see Table 4). The COMP score was not different between those with history of concussion (75.83 ± 7.90) and for those never concussed (76.75 ± 7.57; p = 0.55, see Table 4). Mean scores and standard deviations for the descriptive evaluation and normative SOT data are reported in Table 4. Although NeuroCom reports normative values by means and standard deviations, it is also appropriate to report normative values by medians and interquartile range (Appendix Table A-6).30,33,40
Due to lack of randomization and an abnormal distribution of data (see Shapiro-Wilk results in Appendix Tables A-1 and A-2 and skewness and kurtosis in Appendix Table A-5), non-parametric tests were used for between group comparisons. Groups were largely homogenous (see Levene’s test scores in Appendix Tables A-3 and A-4). Significant differences were observed only between males and females in Condition 3 of the SOT (p = 0.04). However, this was after 22 comparisons were made. A Bonferroni-Holm correction was performed to control for Type I error, and α was set at 0.002. No significant differences were observed in SOT condition, composite, or ratio scores between groups by gender or by history of concussion (see Table 5).
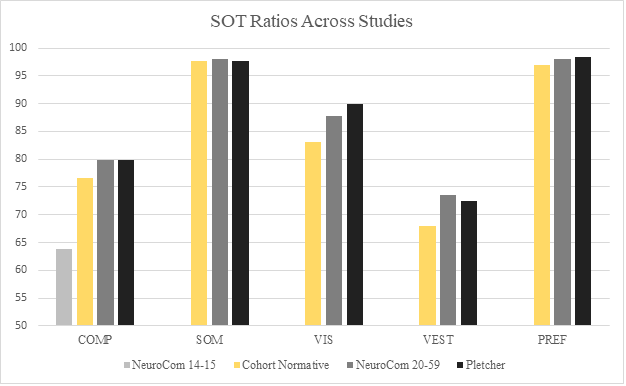
SOT ratio and condition scores from previously-published work are reported in Table 4.33 Additional data from two previous studies are visualized in comparison to SOT ratio and condition data from this study in Figures 3 and 4.30,33


Discussion
To the knowledge of the authors, there have been no reference data collected previously to assist clinicians to interpret and compare individual SOT data measures of a young, healthy, active, military population. Vander Vegt et al reported similar COMP scores (females = 76.85, males = 76.09, concussion history = 76.00, no concussion history = 76.47) for 207 collegiate athletes with mean age of 19.3 years (female = 72, male = 135) with and without history of concussion (no concussion history = 155, concussion history = 52).41 Average SOT scores for this sample were COMP = 76.60 (females = 76.67, males = 76.57, concussion history = 75.83, no concussion history = 76.75), SOM = 97.64, VIS = 83.17, VEST = 67.99, and PREF = 96.97 (see Table 4). Surprisingly, this young, healthy, active sample scored less than the NeuroCom normative data comparison population ages 20-59 (see Table 4 and Figures 3 and 4).33 Pletcher et al reported normative values for Special Operations personnel with an average age of 35 years old, and their sample also scored greater comparatively excepting the SOM score (Figure 3).30 For the six conditions, This study sample scored best in Conditions 1 and 2, but Conditions 3 through 6 were in between the younger and older samples of NeuroCom data, as well as less than the Special Operator scores (see Figure 4). One reason for this may be due to natural history of vestibular system development. Although Steindl et al assumed complete maturation of the vestibular system in adolescents, Hirabayashi and Iwasaki demonstrated that complete integration of vestibular function with visual and somatosensory inputs seemed to remain in developmental stages through ages 14-15, and they did not observe ≥16-year-olds.42,43 These data suggest that balance function may still be under development for 17-23-year-olds, especially visual and vestibular inputs as observed with conditions 4, 5, and 6 (Table 4) which are more dependent on visual and vestibular inputs (Table 1).
These data fit naturally between the available normative values for 14-15-year-olds and 20-59-year-olds. Current NeuroCom normative values include age ranges of 3-4, 5-6, 7-8, 9-10, 11-13, 14-15, 20-59, 60-69, and 70-79.33,43 Data for ages 16-19 are lacking. The number of participants reported in each age group is unclear, however for ages 20-59 the normative values are based on 112 participants, and for ages 14-15 they are based on 19 participants.33,43 This study informs the community of normative values of young, healthy, active, military individuals ages 17-23, a demographic not previously observed for normative values. These data bridge the gap between 14-15-year-olds and 20-59-year-olds, and they demonstrate that ages 17-23 persist as a period of balance skill development.
Another reason for resultant scores being less than 20-59-year-olds may be due to different sway strategies. Younger people in general possess greater ankle range of motion and may tolerate sway parameters outside of 12 degrees total. Younger athletic people may develop balance strategies based on sport-specific training. Chow et al observed that amateur rugby players may have developed more hip-centered balance strategies that tend towards lower scores on the SOT.13 Their balance strategies caused them to score lower than their non-rugby-playing counterparts. This sample of cadets is required to play intercollegiate and intramural sports and may have developed sport-specific balance strategies. Pletcher et al reported that the Special Operations sample demonstrated between-group differences in SOT scores that may have been due to their task-specific balance strategies given the weightbearing and athletic nature of their duties.30
Minimal detectable change (MDC) for SOT COMP scores has been reported as 3.97 points, and a learning effect for SOT COMP scores has been reported at 8 points.44,45 Comparing post-concussion patients to these baseline measures will assist in returning them to full duty, affecting deployability and readiness. Additionally, these data may be used for comparison in future studies and against other devices. (NeuroCom support will be available until 2026, at which time Bertec devices will supersede.)46
These data contain performance specific to female participants that may enter the combat arms branches where they are more likely to be exposed to head trauma. Females comprised 28% of this sample. Although no significant differences were demonstrated in comparison to males, this large sample of the age group provides baseline data for future comparisons.
This study has a few limitations. Although four different clinicians were simultaneously trained to evaluate participants on the SOT, inter-rater reliability for fall criteria was not tested. To limit this bias, clinicians referred to the NeuroCom manual for fall criteria. Motion artifact may have affected individual scores. Most participants were generally still in the upper body during testing. However, occasionally a participant adjusted their glasses or scratched their face during testing. Others flexed or extended at the spine or the knees without a frank fall. This may have produced less accurate measures on each test, but this is described in the NeuroCom Manual and is a primary reason for three trials for each condition.33
A possible confounding variable may have been the time of day in which testing took place. Cadets are fully scheduled each day so they were tested according to their availability, no matter the time of day. Heinbaugh et al observed that although time of day did not affect dynamic balance testing, a significant difference exists when testing for static balance in the morning versus the afternoon.47 Those tested in the morning tend to perform better with static balance evaluation. However, the authers did not encounter literature that suggests dynamic balance is affected by time of day. Also, it should be noted that the clinic in which the NeuroCom was located for this study is much busier and noisier in the afternoon. Due to scheduling constraints for the cadets, not all participants could attend in-clinic testing at the quiet hours of the morning. Time of day and atmosphere may have confounded some of the results.
Conclusion
This study is the first to provide normative values for the SOT in a young, active, healthy, military population. The sample size exceeds those used to provide the current normative values for all other age groups.32,33 These data may stand as a reference standard for military providers to allow meaningful comparisons in future studies and possibly against other devices.
Disclosure
The authors declare no conflicts of interest, remuneratively or otherwise, with regards to this publication.
IRB approval
Granted by Keller Army Community Hospital Institutional Review Board