
Introduction
The Y-Balance Test (YBT), derived from the Star Excursion Balance Test (SEBT), is an inexpensive and commonly used objective measure to assess lower extremity (LE) dynamic balance, functional symmetry, and stability.1–4 Due to the possibility of errors that may occur during the performance of the SEBT and the absence of a standardized protocol for the performance of the test, the YBT has been gaining popularity in clinical and research settings.3–5 The YBT was designed to standardize the SEBT test performance and to improve the reliability of the test. The YBT™ (Functional Movement Screen, Danville, VA) is an instrumented version of the modified SEBT that assesses an individual’s performance in the anterior (A), posterolateral (PL), and posteromedial (PM) directions. To perform the YBT, the individual stands on an elevated central plastic platform and pushes a rectangular reach block with the foot along a calibrated plastic tubing in each of the three directions.
The YBT has been documented as a reliable tool to assess balance in athletes.3,6 Smith et al.7 found that A reach direction asymmetry on the YBT was associated with an increased risk for injury across various sports. They concluded that the YBT could be a valuable tool when screening athletes across multiple sports. Similar results were found by Butler et al.8 who suggested that poor performance on the YBT is associated with an increased risk for LE injuries in college football players. Poor performance on the YBT has also been linked to an increased incidence of ankle injuries in collegiate athletes.9 Increased risk of injuries has also been documented in high school cross-country male runners who demonstrated greater asymmetries while performing the YBT.1
It seems reasonable that identifying the risk factors associated with sports-related injuries could help clinicians/trainers/coaches in designing programs/interventions to address those factors and overall decrease the injury rates. LE injuries have been attributed to poor neuromuscular (NM) control.5,7,10 Neuromuscular control is defined as the detection, perception, and utilization of relevant sensory information to perform specific tasks.11 To reduce injury risk, training programs should include diverse interventions to improve dynamic balance and control. The SEBT has been utilized as a training tool to improve trunk NM control and dynamic balance assessed by measuring trunk strength and endurance using a pressure biofeedback unit and with single leg stance time with eyes open and closed, respectively.12,13 Significant improvements in these outcomes were seen in the subjects who were trained using the SEBT. No such studies have been published utilizing the YBT tool kit as a training instrument.
Another way of improving dynamic balance is by introducing unstable surfaces to the training programs.14,15 Unstable surfaces cause a greater challenge to NM control in comparison to stable surfaces and hence are commonly used by clinicians and trainers in their protocols. While introducing instability to exercises may improve stability, the effect on muscle activation has not been completely described. Surface EMG has been extensively used to measure muscle activity (activation) during various activities. Muscle activation, as measured using surface electromyography (EMG), has been documented to vary significantly depending on the type of surface.14–16 Adding instability may be effective in increasing the muscle activation in stabilizing muscles.15
Rehabilitation professionals commonly use the intensity of exercise, defined as a given percentage of the maximal muscle contraction and measured by the EMG, to design protocols for strength and stability training.16–18 Previous researchers have documented parameters to determine sufficient EMG activation to achieve various training effects.17,19,20 Strength gains are expected from exercises that cause EMG activation levels greater than 40% however, activation levels below 40% are still beneficial in improving NM control.17,19,20 Authors have found EMG activation to be direction-specific when measured in subjects performing the SEBT.19,21,22 To the authors’ knowledge, no studies measuring the EMG activity while performing the YBT have been published. Knowing the muscle activation patterns while performing YBT on various surfaces may assist in utilizing this test as a training tool. Therefore, the purpose of this study was to compare the EMG activity of trunk and LE muscles during the YBT on stable and unstable surfaces.
Methods
Participants
Twenty healthy adults (10 males and 10 females) were recruited via email to the university community to participate in the study. The study was approved by the Institutional Review Board of the University of St. Augustine for Health Sciences, Austin, TX.
Protocol
The participants signed the informed consent before starting the test protocol. The participants were screened for the inclusion/exclusion criteria (Table 1).19 Lange® skinfold calipers (model # 68902, Fitness Mart®, division of Country Technology, Inc. Gays Mills, WI) and three site formula regression equations for men (chest, abdomen, and thigh) and women (triceps, supra-iliac, and abdomen) were used to assess body composition.23 Skinfold measurements were taken by the guidelines provided by the ACSM’s Guidelines for Exercise Testing and Prescription23 at the sites mentioned above for both the men and the women. The body composition of the participants was assessed to achieve the most accurate surface EMG (sEMG) signal by reducing the effects of body fat on the sEMG signal by excluding participants with body fat percentage above the “Fair” category by age (Men: Age 20-29: 18.6 %body fat; Age 30-39: 21.6 %body fat. Women: Age 20-29: 23.5 %body fat; Age 30-39: 24.8 %body fat).24
The Trigno wireless EMG system (Delsys Inc. Boston, MA, USA) was used to collect all the EMG data. The wireless electrodes used measured 37mm x 26mm x 15 mm and encompassed a hard-wired single differential amplifier and a four-bar (99.9% silver) contact area, with an inter-electrode distance of 10 mm (Delsys Inc. Boston, MA, USA). Surface EMG was collected from the erector spinae (ES), external oblique (EOB), and rectus abdominis (RA) bilaterally (ipsilateral and contralateral side of the stance leg). While, gluteus medius (GMED), gluteus maximus (GMAX), medial hamstrings (MH), biceps femoris (BF), vastus medialis (VM), rectus femoris (RF), vastus lateralis (VL), anterior tibialis (AT), and medial gastrocnemius (MG) on the stance leg during the YBT. The skin was cleaned with a skin prep pad, and the area was shaved if body hair was present. The electrodes were placed according to the procedure described by Cram et al.25 The participants performed light jumping jacks for 30 seconds for warm-up after the electrodes were placed.26 For normalization of the EMG data, maximum voluntary isometric contractions (MVIC) were performed for each muscle. The MVIC test positions were consistent with those demonstrated by Kendall27 and previous research.17,19 Proper electrode placements were also confirmed by observing the EMG amplitudes during the manual muscle tests before testing the MVIC. The participants were asked to perform primary muscle action of the neighboring muscles to assess for crosstalk. Manual pressure was gradually increased until maximum resistance was applied and then held for five seconds using a metronome. Each muscle test was repeated three times with the thirty-second rest between contractions. For all subjects, MVIC was averaged across the three intermediate seconds for each muscle to calculate the mean of the peak RMS value of the three trials. Two minutes of rest was provided between the MVIC testing of different muscles.
Y-Balance Performance
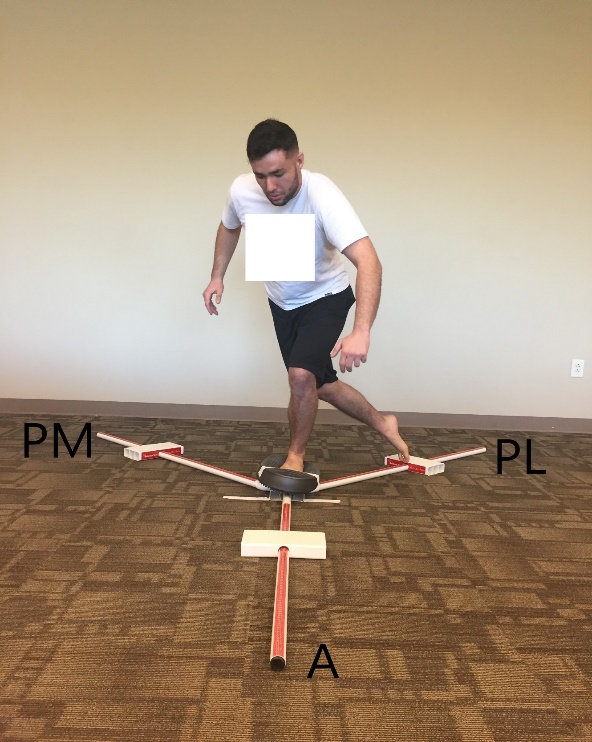
A YBT kit™ was placed on the floor. This requires participants to stand on one limb and to perform a reaching task in three directions with the other lower limb while maintaining balance on the stance leg (Figure 1).3,4,6,10 The preferred stance leg was defined as the leg participant would stand on to kick a ball because it would simulate unilateral weight-bearing activities of the participants and also to make comparisons with previous EMG studies performed during the SEBT.19 Participants were asked to place the foot of their stance leg behind the designated line on the central platform on the tool kit. Participants completed the test barefoot. Participants were instructed to keep their arms by the side so their shoulder flexion and abduction did not exceed 45° while performing the YBT. No specific instructions were provided for trunk motion. An unstable surface was introduced by placing a Theraband™ stability trainer on top of the central platform (Figure 2). The order of the reach directions and surface conditions were randomized using computerized random sequence generator.


Participants were instructed to toe touch on the central platform before beginning to reach, marking the beginning of the single-leg stance phase. The toe touch event was recognized on the EMG data using a toe sensor that showed a signal spike on the computer screen. Participants were instructed to push the rectangular reach block as far as possible along the calibrated plastic tubing in one of the pre-determined directions of the YBT with the opposite leg and return to the double-leg stance. They were asked to toe touch on the central platform before putting any weight on the reaching leg marking the end of the single-leg stance phase. A metronome was used at a rate of 30 beats/min (equates to two seconds) to ensure consistent timing and speed of each of the YBT trials where each reaching phase (from initial stance to maximum reach; two seconds) and the recovery phase (from maximum reach to bilateral stance; two seconds) was performed during one beat, a total of four seconds.19 Verbal cueing was provided to the participants during the YBT to synchronize their toe touch with the metronome beat.
Maximum reach distances were recorded at the touchdown point. The reach distance was normalized by participants’ leg length measured from the anterior superior iliac spine (ASIS) to the distal end of the medial malleolus.28 Participants completed six practice trials with the metronome in each of the three (A, PL, PM) reach directions of the YBT. A five-minute break was provided between the practice trials and the data collection. Fifteen seconds of recovery time was given between test trials to reduce the risk of fatigue. A 60 second recovery time was utilized between reach directions, and the order of the reach directions was randomized. The trial was discarded if the heel of the stance leg lifted off the ground, or if the participant put weight on the reaching leg during maximal reach, lost balance even if the heel remained on the ground, could not return to the starting position, or did not match the metronome speed. If the trial was discarded, additional trials were performed until the participant completed three good trials in each direction.
Data Processing
The data were collected at a sampling frequency of 1926 Hz, common-mode reduction ratio> 80 dB@60 Hz; signal to noise ratio of > 750 nv, and no gain was applied to the signal. All collected signals were subsequently bandpass filtered (between 20 and 450 Hz) with a 2nd order filter on the high-pass and a 4th order filter on the low-pass, then rectified and finally smoothed by using a root-mean-square (RMS) calculation. RMS was calculated using a default window length of 0.125 s with a 0.0625s window overlap. MVIC was used to calculate the percentage MVIC. The mean RMS value of the EMG signal of each muscle for each direction during the YBT was calculated during the two seconds reaching (eccentric) phase of each YBT trial. The reaching phase was measured from the beginning of the unilateral stance to the maximal reach identified by the toe sensor. The EMG of the reaching phase was calculated to be consistent with the methods described in the prior literature.19,22 The RMS value of the reaching phase of the three trials was averaged for each muscle to be normalized to its respective MVIC value and represented as a percentage of the MVIC (%MVIC).
%MVIC=(Average RMS value of the three repetitions/average peak RMS value)×100
Statistical Analysis
Paired t-tests were used to determine differences in %MVIC of the three reach directions A (stable vs. unstable), PL (stable vs. unstable), and PM (stable vs. unstable) for each muscle. The level of significance was pre-set at p≤ 0.05, and SPSS version 23.0 was used for all the statistical analyses. The Cohens d effect size was also calculated for each comparison.29
Results
Twenty (10 male, 10 female) subjects participated (age: 27.5 ± 4.0 years, height:167 ± 1.0 cm, weight: 66.5 ± 13.0 kg, body fat: 14.1 ± 6.2%). Significant differences with moderate to large effect sizes between stable and unstable surfaces (greater EMG values in the unstable condition) were observed for the following muscles in the A direction: GMED (p < 0.001), GMAX (p = 0.04), MH (p = 0.001), VM (p < 0.001), RF (p < 0.001), VL (p < 0.001), and MG (p = 0.004), in the PL direction: iEOB (p = 0.02), iES (p = 0.003), cES (p = 0.015), GMED (p = 0.01), BF (p = 0.019), VM (p = 0.001), RF (p = 0.001), VL (p < 0.001), and MG (p = 0.001), and in the PM direction iEOB (p = 0.03), iES (p = 0.02), GMED (p = 0.001), BF (p = 0.007), VM (p = 0.006), RF (p < 0.001), and VL (p = 0.005). No significant differences between the stable and unstable surfaces were observed in iRA (A: p = 0.5, PL: p = 0.06, PM: p = 0.12 ), cRA (A: p = 0.88, PL: p = 0.13, PM: p = 0.053), cEOB (A: p = 0.052, PL: p = 0.11, PM: p = 0.09), and AT (A: p = 0.47, PL: p = 0.14, PM: p = 0.7) for any of the directions of the YBT (Table 2). The reach distance between the two conditions for all the three directions were higher for the stable versus the unstable condition (Table 3).
Discussion
The present study compared the muscle activation of the various trunk (iRA, cRA, iEOB, cEOB, iES, cES) and LE muscles (GMED, GMAX, MH, BF, VM, RF, VL, AT, MG) while performing the YBT on stable and unstable surfaces. Significant differences in muscle activation were noted for eleven out of fifteen muscles due to the change in the surface. The findings of the current study may provide evidence regarding utilizing the YBT as a training tool in stable and unstable conditions. To the authors’ knowledge, no previous studies have measured muscle activation during this test. In general, the addition of unstable surfaces while performing lower extremities weight-bearing exercises have been documented to either increase, decrease or cause no change in the muscle activation patterns.14–16,18,30–35
Adding an unstable surface during the performance of the YBT resulted in significantly increased muscle activation in nine (iEOB, iES, cES, GMED, GMAX, BF, VM, RF, VL, MG) out of fifteen muscles in the current study. This is similar to the results found by other authors18,31 who investigated the effect of various surfaces while performing bridging exercises. To overcome the effects of instability, the body tends to attempt to offer stability by increasing the muscle activation of certain muscles. Alfuth et al.30 and Ridder et al.36 reported that adding unstable surfaces while having subjects perform a single leg stance activity caused an increase in the activation of the selected LE muscles. Increased level of external perturbations while maintaining balance on the unstable surfaces requiring more co-contraction of the muscles has been hypothesized as one of the possible reasons for increased stabilizing muscle activation.32,34 Krause et al.33 also reported the variations in the selected LE muscle recruitment in the subjects performing a standard lunge compared to the lunge performed in suspension equipment. The suspension lunge condition resulted in increased muscle activation requiring more stability due to the unstable environment created by the suspension equipment. Unstable surfaces have also been reported to cause increased muscle recruitment in the selected LE muscles while performing upper extremity exercises. Shin et al.16 found that when subjects were asked to perform upper extremity exercises while standing on an unstable surface, there was an increase in the activation of the selected muscles near the ankle joint in an attempt to maintain balance on the unstable surface using secondary to use of an ankle strategy by the subjects.
A large effect size was observed for RF in all the directions, for GMED, VM, and VL in two out of the three directions, and for MG, one out of two directions. A moderate effect size was observed for these muscles in the other directions. The moderate effect size was also observed for the iEOB, iES, and BF for two out of the three directions and cES, GMAX, and MH for one out of the three directions. Moderate to large effect size shows that the higher muscle activity during the unstable surface is due to the difference in condition, and is likely clinically meaningful. In most directions, a large effect size was observed for the quadriceps and GMED muscles because they are key to maintaining balance during a single-leg squat task.37
Compared to a stable surface, performing the YBT on an unstable surface resulted in no significant difference in five muscles (iRA, cRA, cEOB, VL, AT) and a decrease in muscle activity for the MH muscle. These findings are also in agreement with the conclusions from previous researchers investigating the effects of various surfaces on muscle recruitment.15,35 Some of the proposed reasons for no change in muscle activation under unstable conditions included variability in the subjects’ training/activity levels, the type of the unstable surfaces used, the distance of the muscle from the unstable surface, the muscle role (prime movers versus stabilizers) in performing the exercise, and biomechanical movement compensations due to added demand on the neuromuscular system.15,35,38,39
The use of unstable surfaces has been proposed to place more demands on the neuromuscular system, which in turn may help to improve postural stability and endurance through neural adaptations.15,40–44 Basketball players, when trained on unstable surfaces, have shown improvement in balance and stability in contrast to their controls who trained on a stable surface.44 Performing stabilization exercises on unstable surfaces have been reported to be more effective than stable surfaces at improving pain, stability, and disability measured using visual analog scale, Stork Balance Stand test, and Oswestry Disability Index, respectively, in patients with lumbar pain.41 Performing exercises on unstable surfaces demonstrated greater therapeutic effects in comparison to stable surfaces to improve balance in healthy individuals. The authors suggested that it may be because the unstable surfaces are more effective in influencing the somatosensory system.43 Exercising on unstable surfaces has been shown to be more effective in improving balance and walking abilities among stroke patients than stable surfaces.40,42 Authors have also shown the utility of introducing unstable load during strengthening exercises to stress the neuromuscular system.45–47 The results of their studies showed a decrease in muscle activity for the prime movers but an increase in muscle activity for the stabilizer muscles. They hypothesized that an unstable load places extra demand on the body for stabilization, challenging balance and neuromuscular control.
Ganesh et al.12 and Chaiwanichsiri et al.13 utilized the SEBT as an intervention to improve balance and proprioception in their study subjects. Although the YBT is commonly used to measure balance and NM control, based upon the current results, having individuals perform the YBT on the unstable surface may increase muscle activity in key stabilizing muscles and may be considered for use as a training tool for improving balance and stability. However, if clinicians choose to use YBT to improve balance and NM control in their clients, another test and measure should be utilized for pre-post assessment to avoid a threat to construct validity of the YBT via a learning effect.
Limitations and Future Suggestions
The use of surface EMG to describe muscular activity during a dynamic activity has limitations such as skin displacement, movement artifact, motor unit recruitment variations, a sub-maximal effort by participants, and the possibility of cross-talk from surrounding muscles in spite of using methodology that is commonly cited in previous research.17,19,25,27 This study was conducted using healthy adults; therefore, generalizability to a population that is not similar to the subjects in the current study should be avoided. Confirmation of the findings from the present study is necessary for larger and more diverse populations. Future research should include three-dimensional analysis to learn more about the relationship between joint kinematics and neuromuscular parameters. It would be interesting to investigate if any gender differences exist while performing the YBT. It would also be interesting to see the effect of various types of unstable surfaces on YBT performance.
Conclusion
The results of this study indicate that the performance of the YBT on different surfaces produced a change in the activation of many of the trunk and LE muscles, with the unstable surface inducing increased activation for most of the studied muscles. Clinically, the results from the current study may guide the use of the YBT with an unstable surface as an exercise intervention for training balance and NM control.
Conflicts of Interest
The authors have no conflicts of interest to declare.