INTRODUCTION
Approximately one-third of Little League baseball players experience shoulder or elbow pain during the season.1 Of great concern is the high rate at which these young athletes sustain serious injuries that may require surgery.2 Guidelines have been issued in various countries to prevent injury,3,4 and compliance with these guidelines is reportedly effective in preventing the development of elbow pain.5
Bohne et al. found that 85% of youth baseball players were unaware of the guidelines and that 62% disagreed with “the more you throw, the more likely you are to get hurt”.6 Player perceptions may increase the risk of pitching injury, and environmental factors such as influence of caregivers and team coaches are also important. Caregivers also reported that 83% did not know that the guidelines existed.7 Compliance of coaches with guidelines regarding pitch count limits have been reported to be 56–73% in the United States,8,9 and 28.3% in Japan,10 indicating that coach compliance with guidelines is low in Japan. However, the response rate for these questionnaires ranged from 41.4% to 56%,8–10 which is comparable or slightly lower than the typical general response rate of 52.7% for surveys targeting individuals.11 As non-respondents show different psychological characteristics compared to respondents,12 a high number of non-respondents has been suggested to bias results towards reduced frequencies of problems.13 Coach compliance with guidelines may thus be lower than reported, and research that achieves a higher response rate is clearly desirable. Further, the guidelines3 refer to warm-up, cool-down, and practice days and time, but few reports have provided data on compliance with these guidelines.
Medical checks and awareness-raising activities have been undertaken by doctors and physiotherapists with the aim of improving coach compliance with guidelines and preventing injury to players.14 These activities are often carried out on a local authority or hospital basis. Differences between cities in coach compliance may thus occur depending on the status of these activities.
The aim of the present study was to obtain low non-response bias data on coach compliance with guidelines for pitch count limits with a high response rate. Secondary aims were to determine compliance with guidelines other than pitch count limits, and to determine whether differences in compliance exists between cities.
METHODS
Participants and Data Collection
This investigation comprised a cross-sectional study of coaches for youth baseball teams in Japan. Participants were the coaches of 66 teams belonging to the Gunma Prefecture Western Region Youth Baseball League (a response was requested from one representative per team). The survey was conducted between December 2017 and February 2018. All study protocols were approved by the institutional review board at Hidaka Hospital (approval no. 187). The purpose and methods of this study were orally explained in detail, and written informed consent was obtained. The players on each team coached by the respondents were at the Little League level (ages 6 to 12).
In developing, handing out, and collecting the questionnaires, efforts were made to maximize the response rate. In addition, all survey items were designed to be closed-ended rather than open-ended.15 To conduct this questionnaire survey, the youth baseball leagues in each of the three municipalities (City A, City B, and City C) cooperated.16 Prior to the distribution of the questionnaires, the co-researcher participated in meetings with youth baseball federations in each area where the representatives of each team met, and explained the research in advance.16 This co-researcher then handed out questionnaires to the coach of each team at the meeting.17,18 Questionnaires were completed by one representative coach from each team and hand-delivered to the youth baseball league to which each team belonged, and the co-researcher then received the questionnaires from the representatives of each youth baseball league.
Note that, according to studies that have investigated the level of response rates to questionnaires, a response rate of 73.1% (mean + 1 standard deviation [SD]) or higher is defined as a “high response rate”, and a response rate of 93.5% (mean + 2 SD) or higher is defined as a “very high response rate”.11
Instrument
The questionnaire for team representative coaches included basic information about the team and items related to the various recommendations of the guidelines (see Appendix for the text of the questionnaire). Basic information obtained included the age, baseball coaching experience, and baseball experience of the coach, the area of the team, number of coaches, number of members, number of pitchers, and total number of games played per year. Guideline recommendations were: 1) no more than 50 pitch counts; 2) conduct of both a warm-up and a cool-down; and 3) less than three days of practice per week and less than two hours of practice per day (Table 1).3 Note that these guidelines were in place at the time the study was conducted and that revised guidelines are currently available.3 For recommendations 1-3), respondents were asked to rate their knowledge of the recommendations in the guidelines. For recommendations 1–3), the necessity for each recommendation in the guidelines was rated on a 4-point scale (warm-up/cool-down was not rated because 100% of respondents complied with the guidelines). For recommendation 1), respondents were asked to indicate the number of pitches players give their best effort per day; and for recommendation 3), the number of practice days per week and the amount of time spent in practice on weekdays and holidays. Weekdays were defined as days with school attendance, and holidays were defined as days without school attendance. The reason for asking about the practice time separately for weekdays and holidays is that the practice time on weekdays is presumably shorter than that on holidays because of the after-school practice.
Data Analysis
For continuous variables, mean, SD, median and interquartile range (25th–75th percentiles) are presented. Categorical variables are indicated by the number of participants. Basic information and questions on pitch count limits were compared between groups that complied with pitch count limit recommendations and those that did not. The level of compliance with practice time (weekdays) was compared according to the knowledge and necessity of the guideline recommendations regarding practice days and times. Note that “absolutely necessary” and “necessary” were defined as necessary, while “not really necessary” and " Not necessary at all" were defined as not necessary. A Student’s t-test was used to compare continuous variables with a normal distribution, and a Mann-Whitney test was used for variables showing a non-parametric distribution. A chi-square test was used to compare categorical variables. Mean difference and 95% confidence interval was calculated in the case of comparison of continuous variables. Groups for each city (City A, City B, and City C) were compared regarding basic team information and questions about various recommendations of the guidelines. Analysis of variance (ANOVA) was used to compare continuous variables with a normal distribution, and a Kruskal-Wallis test was used for variables showing a non-parametric distribution. A chi-square test was used to compare categorical variables.
Two-tailed p-values less than 0.05 were considered significant. Statistical analysis was performed using IBM SPSS version 26 statistical software (IBM Corp., Armonk, NY, USA).
RESULTS
The questionnaire received valid responses from coaches of 58 of 62 teams (response rate, 93.5%). The descriptive information for all teams, compliance with each guideline and perceptions of the team are shown in Table 2.


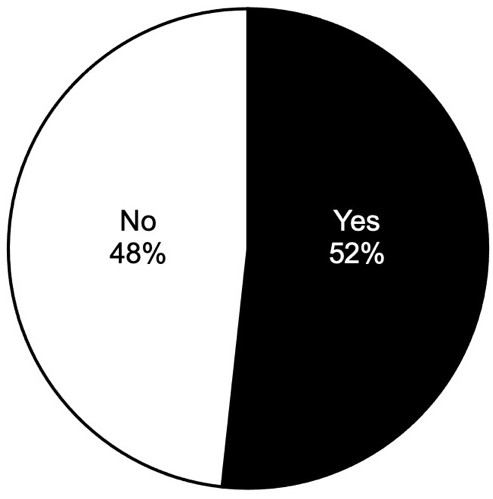
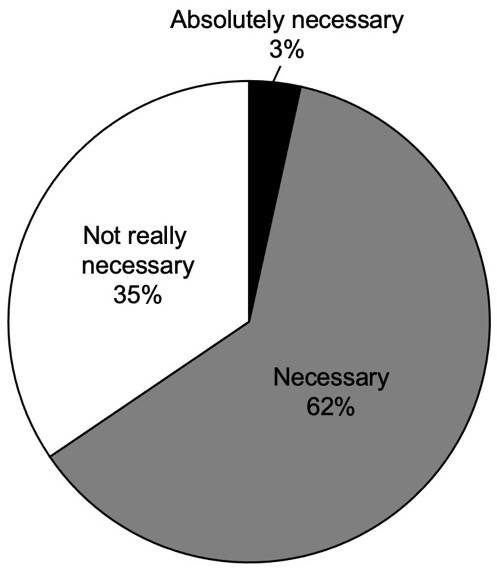
With regard to limits on pitch counts, nine of 58 teams (15.5%) were compliant with the guidelines. Almost all teams were knowledgeable regarding the guidelines, and all coaches answered that restrictions were either “absolutely necessary” or “necessary”. All teams used a warm up and cool down as part of their practice schedule. Regarding the limitation on the number of practice days, coaches of 49 teams (84.5%) reported being compliant with the guidelines. Regarding the limitation on practice time, coaches of 40 teams (69%) reported being compliant with the guidelines on weekdays, while all teams were not compliant with the guidelines on holidays. Coaches of twenty-eight teams (48.3%) were not knowledgeable regarding guidelines for limitations on practice days and time (Figure 1a), and coaches of 20 teams (34.5%) responded that the limitations were “not really necessary” (Figure 1b). Not knowledgeable teams of the guidelines for practice days and time limits showed no difference in practice time (weekday) compliance compared to knowledgeable teams (57.1% vs. 80%, p = 0.089). Futhermore, there was no difference in guideline compliance with practice time (weekdays) among the teams that did not feel the necessity to restriction the number of days and hours of practice compared to those that did (80% vs. 63.2%, p = 0.241).
Table 3 provides a comparison of the two groups according to compliance with the guidelines on pitch count limits. In the non-compliant group, 14 of 49 teams (28.6%) threw between 101 and 150 pitches per day.
Comparisons of data for descriptive team information, compliance with guidelines on pitch count limit, limits on practice days and limits on practice time by city are shown in Table 4. Descriptive team information did not differ by city. With regard to pitch count limits, City C showed the lowest rate of compliance with guidelines (0%, compared to 13.1% in City A and 44.4% in City B), and 5 of 11 teams (45.5%) threw 101–150 pitches (21.1% in City A and 11.1% in City B). No differences between cities were observed in terms of limitations on practice days or time.
DISCUSSION
The present study utilized a questionnaire survey with several measures taken to improve the response rate, achieving a very high response rate of 93.5% by coaches of youth baseball teams. The results indicate that although knowledge about and perception of the necessity of pitch count limits were both almost 100%, the actual compliance rate was as low as 15.5%. Further, 28.6% of teams that did not comply with pitch count limits threw more than 100 pitches per day. Although differences between cities were observed in the percentage of teams complying with pitch count limits, none of the descriptive information for teams showed any differences between the cities. In addition, all teams (100%) were complying with guidelines on warm-up/cool-down, but no teams were complying with time limits for practice on holidays. These results suggest that compliance with guidelines for pitch count limits is lower than previously reported, suggesting a need for raising awareness among youth baseball coaches regarding the risk of pitching injury.
In previous studies of questionnaires for youth baseball coaches, response rates ranged from 41.4% to 56%,8–10 comparable or slightly lower than the general response rate of 52.7% for surveys targeting individuals,11 and non-response bias may thus have been present in the results obtained. The present study showed a very high response rate perhaps due to the measures that were taken: 1) the use of closed-ended items;15 2) prior explanation of the study;16 3) hand-delivery and collection of questionnaires;17,18 and 4) selection of organizations for distribution16 with little possibility of non-response bias.
The compliance rate of 15.5% for the pitch count limit in this study was remarkably low compared with previous reports, which have described rates of 44–56% in the United States8,9 and 28.3% in Japan.10 The compliance rate found in this study was the lowest guideline compliance rate that the authors found. The low compliance rate might be largely attributable to the removal of non-response bias.13 In this study, 28.3% of the non-compliant group routinely threw more than 100 pitches, in stark contrast with the guideline recommendation of no more than 50. These results suggest that youth baseball players in Japan are exposed to environments likely to increase the risk of pitching injury more than previously thought. Intergroup comparisons revealed differences between cities in compliance with pitch count limits. The difference in compliance rates between the cities was very large (44.4% difference between City B and City C). This large difference between City B and City C needs to be clarified. However, none of the comparisons of descriptive team information, knowledge of pitch count limit, or need for pitch count limit by city revealed significant differences, and no reason for the differences between cities in compliance rates could be identified.
The percentage compliance with the guidelines was found to be 100% for warm-up/cool-down, 84.5% for the limitation on the number of practice days and 69% for the limitation of practice time (weekdays), showing no major problems. However, all teams were non-compliant with restrictions on practice time for holidays, with 48.3% lacking knowledge regarding the recommendations and 34.5% stating that the limits were “not really necessary”. These results suggest that practice time is likely to be exceeded, especially during holidays. Although no reports on compliance rates or the perceptions of coaches regarding practice time limits are available for comparison, practice time of 13.5~21.7 hours/week19–21 has been reported for baseball players of similar age groups. Excessive practice time has been shown to lead to problems such as medial epicondyle apophysitis19 and lower limb tightness20 and represents an issue needing attention. The compliance rate of the guideline regarding practice time did not differ depending on the knowledge of the guideline or the necessity of the guideline, and the results of this study made it difficult to identify the factors that reduced the compliance rate of the guideline.
Since the non-compliant group for pitch counts showed a high level of knowledge and perception of the necessity of the guidelines, methods other than imparting knowledge may be needed to increase compliance rates. Monitoring pitches from the mound using systems that utilize pitch tracking, such as PITCHf/x (Sportvision, Chicago, IL), TrackMan (Vedbæk, Denmark), and Rapsodo (St Louis, MO), to monitor changes in workload intensity and fatigue during games and practices may be useful.22 On the other hand, knowledge regarding the guidelines and perception of their necessity were both low with regard to practice time limits, so educational activities such as disseminating knowledge of the guideline to coaches may be effective in increasing compliance rates. In addition, although workload monitoring during games has been emphasized in the past, Lazu et al. reported that the average only 12% of all pitches were thrown during games compared to practice and games combined.23 Therefore, one of the issues to be addressed is to examine the method of workload monitoring during practice. Keeping records of the number of pitches during practice, the number of practice days, and practice hours during practice are may be effective, but the effectiveness of these method should be verified in the future. Furthermore, since differences between cities were observed, optimal methods of achieving changes may change depending on the city. However, since the reasons for differences between cities could not be clarified from this study, further work is needed in the future.
This study had a number of limitations. First, the number of teams in the compliant group was small, making comparisons between groups less reliable and multiple analyses impossible. Second, the symptoms of players could not be linked to team compliance with the guidelines because only coaches were surveyed. Third, it is assumed that they often threw from the flat ground in practice and from the mound in games, but the details such as the height of the mound are unknown since the authors did not actually investigate it. Finally, because the number of participants and variables specific to the city were small, factors contributing to differences between cities could not be identified. In the future, factors contributing to guideline compliance rates should be examined in the context of city-specific variables, such as the number of nearby medical institutions and municipal initiatives.
CONCLUSION
The results of this research revealed considerably lower compliance with guidelines on pitch count limits than previously reported. In addition, for guidelines other than the pitch count limits, the recommended values were exceeded for practice time on holidays. Differences between cities in compliance with the pitch count limits were found. The low compliance rate with the guidelines by youth baseball coaches needs to be further keenly aware and to address the differences between cities in compliance rates.
Acknowledgements
We would like to thank the Gunma Prefecture Western Region Youth Baseball League for their cooperation in the collection of data.
Conflicts of interest
The authors report no potential conflicts of interest in the development and publication of this manuscript.