
INTRODUCTION
Physical activity that is novel, demanding, and high in volume often results in exercise-induced muscle damage (EIMD).1 Eccentric muscle actions appear especially likely to induce damage.1 Exercise of this nature may cause intracellular muscle damage, impair muscle function, lead to swelling and inflammation, and cause delayed onset muscle soreness (DOMS).2,3 While the exact mechanisms of EIMD are unclear, both metabolic and mechanical pathways are likely contributory.4 Tee et al. suggested that oxidative stress, a delayed inflammatory response, and impairment of excitation-contraction coupling represent a metabolic cascade resulting in EIMD.4 Proske and Morgan described a mechanical pathway where sarcomere disruption occurs via high myofibrillar tension.5 Moderate EIMD is a normal outcome following vigorous activity, and can play a role in beneficial physiological adaptations.6 Excessive EIMD, however, may hinder training and performance.6 Therefore, reducing EIMD symptoms may prove beneficial. Phototherapy (PhT), a non-thermal process where chromophores react to light, inducing photochemical and photophysical responses in varied tissues,7 may help athletes reduce the detrimental effects of EIMD.
Phototherapy, otherwise referred to as photobiomodulation, light-emitting diode therapy, or low-level laser therapy, is a non-ionizing light therapy. Phototherapy may employ light emitting diodes, lasers, and broadband light ranging on the spectrum from visible to infrared.7 Phototherapy has been shown to potentiate aerobic performance,8–14 increase the number of muscular contractions that can be performed prior to fatigue,15–23 and hasten recovery following exercise-induced muscle damage.10,16,21,24–31 While tenets of the treatment vary (dosage, pre vs. post exercise application, pulsed vs. continuous application), PhT generally appears to enhance some types of performance.
While the efficacy of PhT toward aerobic performance potentiation and recovery appears well established, the influence on strength performance and recovery is unclear. Reduced decrements in strength following EIMD as measured by maximal voluntary contraction (MVC)10,16,24–27,30 or repetitions until exhaustion31 have been reported. These investigations have primarily used single joint assessments of strength. Malta et al.32 performed the lone investigation where short-burst, anaerobic tests were used to assess the influence of PhT on recovery from EIMD. The countermovement jump (CMJ), a multi-joint movement, was included as a dependent variable. The authors reported no difference between groups, though while there was little previous evidence to suggest that PhT may minimize decrements in CMJ following EIMD, the lack of difference in any recovery marker whatsoever appeared to conflict with most of the literature. The authors acknowledged as much, and called for further investigation.32
Given the preponderance of athletic activities which rely primarily on multi-joint, functional movements, it is important to investigate how these are influenced by PhT during recovery from EIMD. The improvements in recovery observed in slower, isolated assessments of MVC are suggestive of potential benefits toward recovery of functional movements, but this requires confirmation. Therefore, the purpose of this study was to assess the influence of PhT on functional movements (vertical jump, agility), and perceptions of muscle soreness following EIMD caused by high volume sprinting and decelerations. The null hypothesis was that following EIMD, PhT would not expedite recovery for agility and VJ, or decrease perceptions of muscle soreness compared to CON.
METHODS
Participants
Six healthy, college-aged females (age 20.3 ± 1.2 yrs; BMI 23.7 ± 4.8 kg.m-2) and 10 males (age 20.8 ± 1.7 yrs; BMI 23.7 ± 4.8 kg.m-2) received PhT on each testing day, following EIMD at the start of the testing period. Seven healthy, college-aged females (age 20.7 ± 1.0 yrs; BMI 27.3 ± 5.5 kg.m-2) and 10 males (age 20.9 ± 1.4 yrs; BMI 25.3 ± 3.1 kg.m-2) served as a control (CON), receiving sham PhT on each testing day, following EIMD at the start of the testing period. Participants were informed of all procedures, potential risks, and benefits of the study, and if willing to participate, read and signed an informed consent form prior to participation. All procedures were approved by the Salem State University Review Board (IRB # 103117-1). Participants were 18 years of age or older (range; 18-25 yrs). Based upon previous investigations, approximately eight to 20 participants per condition were determined as adequate to observe a significant difference in the primary dependent variable of muscle soreness.16,21,23 Potential participants were excluded if they 1) were injured, or 2) had received PhT in the last 30 days, or 3) had already completed the repeated sprinting protocol. Each participant was instructed to refrain from strenuous physical activity and alcohol consumption during the study. Data collection for this investigation was conducted between December 2018 and February 2020.
Procedures
During the first session of week one in this two-week investigation, participants were assigned to either PhT or CON in a counter-balanced fashion. Following group assignment, participants completed a standardized, pre-testing battery warm-up (50 jumping jacks, 30 high knees [15 per leg], 10 push-ups, and 10 squats), followed by a non-fatiguing testing battery that included assessments of muscle soreness, VJ, and the Agility T-Test (described below). This protocol was repeated during all three familiarization sessions in week one. All testing took place at the same time of day throughout the study. During week two, participants attended the lab five consecutive days, henceforth described as POST, +24hrs, +48hrs, +72hrs, and +96hrs. Prior to the first testing battery at POST, participants underwent a repeated sprinting protocol (described below). Participants in the experimental group then underwent the PhT intervention while CON received a sham PhT treatment. Both groups then performed the testing batteries. At each session from +24 to +96hrs, both CON and PhT performed the previously described standardized, pre-testing battery warm-up.
Description of Blinding Procedure
Upon entry to the study each participant was assigned a code by a researcher, reflecting their experimental or control status, participant number, and sex. The researcher applying the PhT treatment was informed of the participant’s condition, in order for the PhT treatment or sham therapy to be applied (described below). Participants were kept unaware of their group assignment throughout the investigation. The researcher applying the intervention was different from the researcher that assessed participant’s vertical jumping ability, agility, and perceptions of muscle soreness.
Description of the Phototherapy Intervention
Phototherapy was delivered using a Richmar Theratouch LX2 device (St Louis, MO). A nine-diode cluster applicator, consisting of five laser diodes and four light emitting diodes (LEDs), was used to deliver the PhT treatment. The PhT parameters are presented in Table 1. The nine-diode cluster was selected over a single diode due to its efficiency in delivering the desired joules to a larger area and its ability to simultaneously deliver Laser energy and LED energy.
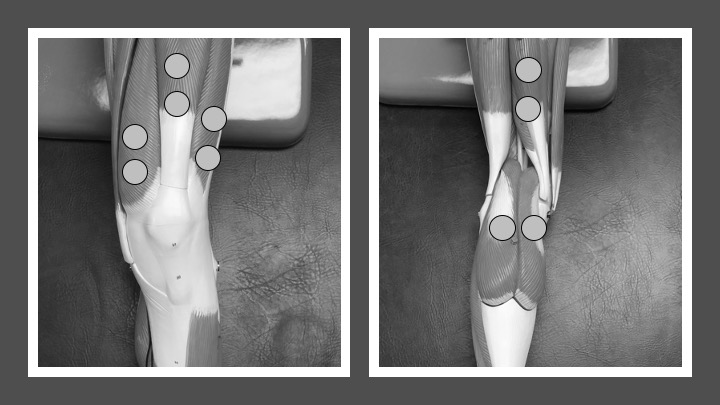
All participants wore protective goggles and lay supine when anterior sites were irradiated and prone when posterior sites were irradiated. The PhT device was placed at participant’s feet during all treatments. This ensured that participants in both groups were unable to see the applicator or device screen. The PhT device was set to provide no audible sounds during the placebo or PhT treatment. Phototherapy treatments were delivered with the cluster applicator in direct contact with the skin using firm, but comfortable pressure at each of the predetermined sites on the quadriceps, hamstring, and gastrocnemius. Phototherapy was delivered to a total of 10 sites on both legs (Figure 1). A researcher trained in PhT treatment was responsible for delivering each treatment.

The placebo group did not receive any PhT irradiation from the device. The placebo treatment consisted of the same physical set up, however the applicator was not armed for treatment. The PhT device was set to 0 Joules for the placebo treatment. The clinician held the cluster applicator in direct contact with the skin using firm, but comfortable pressure on all of the previously described sites. The clinician simulated activation of the cluster applicator and held it in place for 30 seconds.
Description of Muscle Damage Protocol
Prior to performing the repeated sprint protocol, participants completed a general warm-up of five laps around a basketball court, followed by a sprinting-specific warm-up butt kicks, high knees, soldier walks, toe walking, carioca, and sidesteps with a squat. Participants then completed four 15 m sprints accelerating from 25 % of maximal speed, to 50 %, 75 %, to 100 %, throughout the four sprints. The sprinting-specific warm-up, different than the pre-testing battery warm-up, was used to decrease the likelihood of a participant incurring an injury while sprinting. The warm-up was followed by a repeated sprinting protocol, which involved 40, 15 m sprints and a 5 m deceleration zone to accentuate eccentric muscle actions. Participants were instructed to exert maximal effort on each sprint. Woolley et al.33 observed that this protocol triggered muscle damage in physically active adults. This protocol has been used to elicit muscle damage in previous, similar research.34
Perception of Muscle Soreness
A PainTest™ FPN 100 Algometer (Wagner Instruments, Greenwich, CT, USA) was used to assess muscle soreness of the quadriceps, hamstrings, and gastrocnemius muscles on the right leg of each participant. Thirty N of force was applied to the mid-point of the muscle belly of each with the algometer. Participants verbally reported a pain rating which ranged from zero (no pain) to 10 (most painful) using a categorical pain scale, and those values were used for analysis.35 A categorical scale is limited in that it only allows inferences to be made about the rank-order of the varying sensations. In light of these limitations, Green et al.36 developed a scale of sensory magnitude with apparent ratio properties called the general labeled magnitude scale (gLMS). The gLMS generates ratio-level values in sensory modalities36 and was used in the present investigation, and in similar research34 as a further assessment of muscle soreness. Participants were provided with a visual aid attaching verbal descriptors to numeric soreness values, and those numerical values were used for analysis.
Vertical Jump
Vertical jump testing followed the protocol outlined in The Canadian Physical Activity, Fitness and Lifestyle Approach (CPAFLA) manual,37 using a commercial Vertec (Vertec, North Easton, MA, USA). While instructed not to use a preparatory step, participants flexed their hips and knees into a partial squat, stopping fully in this position and pausing in order to eliminate any influence from the stretch reflex. Participants then jumped up, reaching up with their dominant arm, and pushed the highest vane possible. Three trials were performed with at least 60 s rest between each attempt, the average was recorded to the nearest 0.5 in, and used for analysis.
Agility
For the Agility T-Test, four cones were arranged in a T shape. Starting at the bottom of the T, participants sprinted 10 yards forward, then shuffled five yards to the right, then shuffled ten yards to the left, then shuffled five yards to the right, then backpedaled 10 yards to the initial starting point, touching each cone outlining the T as they went. The average of three trials was recorded to the nearest 0.1 seconds, and used for analysis. Trials were performed with at least 120 s rest between each attempt. A trial was disqualified if the participant neglected to touch a cone, crossed their feet during a lateral shuffle, turned their body sideways while shuffling, slipped, fell, or stumbled.38
Statistical Analyses
The three values for each assessment collected during week one were used to calculate baseline scores. The five values for each assessment collected during week two were then compared to baseline values (Δ). Area under the curve (AUC) was calculated for each participant by summing week two scores collected from POST to +96hrs. Normality of distribution was assessed via the Kolmogorov Smirnov test. Normally distributed data were compared between conditions with a two-tailed independent t-test. Nonparametric data were compared using the two-tailed Mann-Whitney U test. Alpha level was set at 0.05. Data analysis was completed with GraphPad Prism 5.0 (GraphPad Software San Diego, CA, USA).
Additionally, the magnitude of effect was calculated for significant treatment effects. Mean differences were first calculated between condition means as they changed (Δ) from baseline. Ninety-percent confidence intervals were then calculated to surround mean differences (presented as mean difference, ±CI90%), in accordance with the approach of Hopkins et al.39 Confidence intervals were then calculated using the formula: Standard error of the mean, with the standard error of the mean calculated using the formula: The thresholds for small, moderate, and large effects were calculated as 0.3, 0.9, and 1.6 of the standard error of the measurement.39 The standard error of the measurement was calculated with the formula: where Rtest equated to the mean intra-class correlation coefficient (ICC) obtained from familiarization session two vs. familiarization session three. A learning effect would likely increase variability across familiarization sessions; thus, this may be described as a conservative assessment. Lastly, SDtest equated to the standard deviation of the values collected during familiarization sessions.
RESULTS
Participant Characteristics
The mean (SD) participant baseline scores are displayed in Table 2. No significant differences were observed between conditions for baseline participant scores or characteristics (p > 0.05).
Perceptions of Muscle Soreness via Algometry
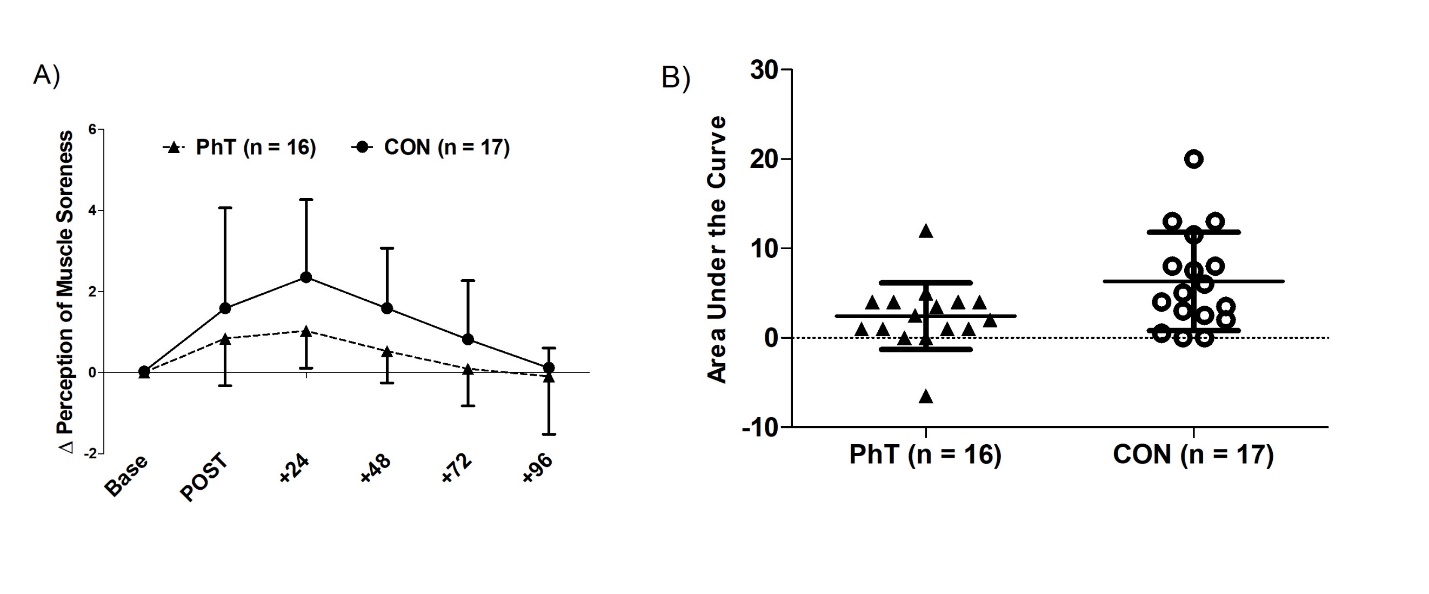
Mean (SD) perception of calf soreness by condition, assessed via an algometer, is displayed in Figure 2. Calf soreness in response to 30 N of pressure applied by an algometer was significantly lower in PhT compared to CON (p = 0.02). For CON, mean changes from baseline were 1.6, 2.3, 1.6, 0.8, and 0.1 on the day muscle damage was induced, and over the four days following, respectively. For PhT, mean changes from baseline were 0.8, 1.0, 0.5, 0.1, and -.1, respectively. No significant differences were observed between groups for hamstrings or quadriceps soreness in response to 30 N of pressure applied by an algometer (p > 0.05) The mean (SD) pain response did not exceed 2.7 ± 2.3 across all conditions and muscle bellies, which equates to a location roughly halfway between ‘no pain’ at point zero, and ‘moderate pain’ at point five on the zero to VAS 10 scale.
_and_control_(con)_conditions.jpeg)
Additionally, the magnitude of effect was calculated by finding the mean difference in the Δ perception of calf soreness between CON and PhT, then building a 90 % confidence interval (±CI90%) around the mean difference for each of the five testing days (Figure 3). The magnitude-based approach suggests with a 90 % certainty that true change in perception of calf soreness between the two conditions will fall within the ‘small’, ‘medium’ or ‘large’ effect ranges. Additionally, should there be no real difference between the two conditions, the mean difference, ±CI90% will overlap zero, represented by a solid line in the figure’s center. The reader will observe that immediately post-sprint, the mean difference overlaps zero, indicating that there may be no real effect of the intervention. Further, the right border of the confidence interval extends into the positive region of the figure, suggesting possible performance impairment with PhT compared to CON. At 24 to 48 hours post sprinting, the confidence interval borders ‘medium effect’ at its lower bound to ‘large effect’ at its upper bound, suggesting a beneficial effect of the intervention. At 72 hours post sprinting, the confidence interval borders ‘small effect’ at its lower bound, and ‘large effect’ at its upper bound, suggesting a beneficial effect of the intervention for some, but possibly no effect for others. At 96 hours post sprinting, the confidence interval borders ‘no effect’ at its lower bound, and ‘medium effect’ at its upper bound.
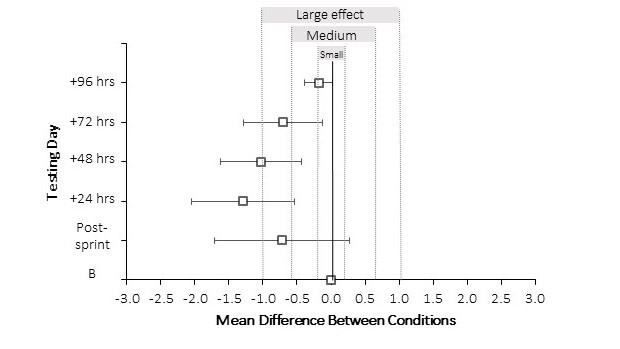
These data suggest with 90% certainty that the true change in perception of calf soreness after exercise-induced muscle damage measured between conditions will fall in the “small,” “medium,” or “large” effect ranges. If there is no real difference between conditions, the mean difference, ±CI90% will overlap zero. The data show favor for phototherapy (left of zero), indicating a benefit toward reducing perceptions of muscle soreness.
Perceptions of Muscle Soreness via General Labelled Magnitude Scale
No significant differences were observed between groups for overall lower body muscle soreness as measured by gLMS (p > .05).
Vertical Jump
Vertical jumping height (inches) did not significantly differ between conditions (p > 0.05). The mean (SD) vertical jump height measured across both conditions fell from 21.0’’ ± 4.0’’ at baseline to 19.2’’ ± 4.0" at POST, 19.6’’ ± 3.9’’ at +24hrs, 19.4’’ ± 4.0’’ at +48hrs, 19.8’’ ± 4.2’’ at +72hrs, and 20.0’’ ± 4.3’’ at +96hrs.
Agility
Agility T-Test time (s) did not significantly differ between conditions (p > 0.05). The mean (SD) Agility T-Test time across both conditions fell from 13.0 ± 1.4 s at baseline to 13.6 ± 1.6 s at POST, 13.5 ± 1.5 at +24hrs, 13.3 ± 1.7 s at +48hrs, 13.4 ± 1.5 s at +72hrs, and 13.3 ± 1.5 s at +96hrs.
DISCUSSION
The present investigation assessed whether PhT influences soreness perception and recovery of multi-joint, functional movements following EIMD caused by repeated sprinting. An important finding is that the repeated sprint protocol induced muscle soreness in both conditions. Participants in both PhT and CON experienced moderate perceptions of muscle soreness as indicated by the gLMS scale. Another important finding is that PhT appeared to expedite calf soreness recovery following EIMD, as measured by an algometer (Figure 2). Calf soreness was lower in the PhT group compared to CON. Thus, while both groups experienced calf soreness following EIMD, PhT reported lower soreness values throughout the week. Mean values for calf soreness changes from baseline in CON were 1.6, 2.3, 1.6, 0.8, and 0.1 on the day muscle damage was induced, and over the four days following, respectively. Mean values for calf soreness changes from baseline in PhT on those days were 0.8, 1.0, 0.5, 0.1, and -.1, respectively. These findings indicate that PhT may reduce calf soreness following EIMD.
Phototherapy appears to generally aid recovery of performance variables following EIMD,10,16,21,24–31 but the influence on soreness is unclear, with both positive24,29 and null findings25,27,30,32 reported in previous investigations. Three different algometry sites and a global measure of lower body muscle soreness, the gLMS, were used in the present investigation. Quadriceps and hamstrings soreness, as measured by an algometer, and overall lower body soreness, as measured by the gLMS scale, were not different between groups. Calf soreness, measured with an algometer, was the only measure where PhT reported significantly lower soreness through the week. While the between-group area under the curve reached significance, it is reasonable to question whether these statistically significant differences hold any practical meaning. The largest difference between groups was observed at +24hrs post EIMD, where CON reported a 2.3 out of 10 on the soreness scale, and PhT reported 1.0 out of 10, equating to a mean difference between conditions of 1.3 units. Given this difference approaches the limits of the sensitivity of the scale, coupled with the scale’s inherent lack of verbal descriptors, assigning meaning to the difference is difficult. It is unclear whether an athlete would meaningfully benefit from a soreness reduction of this magnitude. Aver Vanin et al.25 did not observe reductions in soreness with PhT, and suggested that the use of high-level athletes in that study versus the use of untrained volunteers in others (as in the present investigation) may explain the differing outcomes. While PhT may offer modest reductions in soreness following EIMD, it is unclear whether these contribute to performance recovery, or can even be expected in a trained population.
Vertical jump height was not different between PhT and CON in the present investigation. To date, researchers have identified PhT’s benefit toward improving muscular force as measured by repetitions to fatigue,31 and MVC.10,16,24–30 There has been little investigation into PhT’s influence on power-oriented activities, such as jumping. Malta et al. reported that PhT did not expedite recovery of VJ following EIMD.32 In light of the findings by Malta et al.32 and those of the present investigation, it appears that PhT may not enhance recovery of short-burst, explosive activities with a considerable neurological component, compared to more prolonged activities where fatigue may be a factor. Agility recovery was also not enhanced by PhT in the present investigation. Pinto et al. reported that repeated sprint ability recovery was enhanced after PhT was applied following EIMD, further indicating that PhT may benefit activities posing an endurance challenge.21 The Agility T-Test used herein was performed in a non-fatigued state, and was typically completed in 10-13 seconds. Thus, the test’s duration was potentially too short for any benefits of PhT to be apparent. However, previous investigations have reported improved recovery of MVC, indicating PhT’s possible benefit toward recovery of certain short-duration performance measures. Maximal voluntary contraction assessment can be classified as a high-force, low-velocity activity. Alternatively, VJ and the Agility T-Test are best classified as low-force, high-velocity. The latter two are likely limited by neurological factors, more so than the former.38 Thus, it is possible that PhT may not benefit activities where limitations to performance are primarily pre-synaptic.
A strength of this study was the existence of a true placebo condition. Investigations of other popular recovery methods (foam rolling, massage, ice baths) do not lend themselves to blinding of the control group. Another strength was the relevance of the muscle damage protocol and testing battery to many popular sporting activities. A weakness of this study was the lack of physiological assessment, which precludes any insight into potential mechanisms. There were several important limitations of this study. First, participants were healthy, young adults. Trained athletes, children, individuals with chronic musculoskeletal injuries, or older adults may respond differently to PhT following EIMD. Second, the present findings may be unique to the particular PhT protocol used in this investigation. At this time, no standard method, duration, or frequency of PhT exists. Third, the findings of the present investigation are limited to recovery from EIMD following a repeated sprint protocol. Individuals experiencing EIMD brought on by other forms of exercise may respond to PhT in a different manner.
Conclusions
The results of the present investigation support the null hypotheses that PhT would not decrease perceptions of hamstring, quadriceps, and general soreness, or increase VJ and agility compared to CON following EIMD. The results do support the alternative hypothesis that calf soreness would differ between CON and PhT following EIMD caused by sprinting. Following EIMD, PhT may offer a modest benefit toward calf soreness recovery, but the meaningfulness of this finding is unclear. Additionally, the findings of the present investigation do not suggest a benefit toward low force, high velocity anaerobic activities. Future studies should investigate precisely which type of activities and/or populations benefit from PhT. Further, future studies should investigate the optimal dose, timing and general best practices concerning the use of PhT.
Acknowledgments
These results were presented in an oral presentation at the New England American College of Sports Medicine Fall Meeting in November 2019. No financial support was received.
Conflict of interest statement
Co-author Joseph A. Gallo, DSc, ATC, PT has served as a consultant or received honoraria from Richmar/Compass Health Brands, DJO, Zimmer MedizinSysteme, and Dynatronics Corporation.