INTRODUCTON
The single leg squat (SLS) test is a common screening tool for lower limb functional mobility.1 Individuals with patellofemoral pain syndrome (PFPS), anterior cruciate ligament (ACL) tear, or post hip arthroscopy display several distinct biomechanical characteristics when executing SLS such as greater knee valgus2 and femoral adduction.3 Therefore, the quality of SLS is affected by knee motion abnormalities and one of its quality indicators for SLS is dynamic knee valgus (DKV).
DKV is defined as atypical hip and knee kinematics in the frontal and transverse planes during weight-bearing activities.4,5 DKV encompasses excessive femoral adduction, femoral internal rotation, knee abduction, and external tibial rotation.6 Excessive DKV during bilateral or unilateral landing activities, as well as during the stance phase of gait, has been linked to non-contact ACL and patellofemoral joint injuries.7,8 Hence, DKV can be screened using SLS.
A three-dimensional (3-D) motion analysis system is the gold standard for assessing frontal plane knee alignment during dynamic tasks due to its high accuracy and reliability.5 However, the cost, required space, complexity in data processing and analysis may limit its usage in clinical setting.9 As a result of these limitations, SLS with 3D motion analysis is difficult to be utilized as an injury-prevention screen in routine clinical practice or in sports settings. In comparison, two-dimensional (2-D) motion analysis with kinematic analysis using software packages10 represents a portable, low-cost, and easy-to-use method to objectively evaluate clinical tests such as SLS.5,11 The usage of 2-D motion analysis can also bridge the gap between laboratory measurements and real-life motions.12 However, the clinical utility of SLS with 2-D motion analysis is highly dependent on its accuracy, reliability and validity in providing kinematics data. Therefore, the validity and reliability of 2D motion analysis in quantifying joint angles during functional tasks such as SLS need to be investigated to ensure its clinical significance.8,11 To date, no research has been conducted to compare the reliability of 2-D and 3-D motion capture and analysis among females with normal DKV versus excessive DKV.
In the literature, Gwynne and Curran discovered that 2-D motion analysis during 60° SLS was reliable among male and female recreational athletes.13 Specifically, the knee frontal plane projection angle (FPPA) assessed with 2-D analysis demonstrated a good correlation with 3-D knee valgus angle (r = 0.64 to 0.78, p< 0.001). Additionally, they also found that 2-D motion analysis during 60° SLS demonstrated good within-session (0.86) and between-sessions ICCs (0.74) reliability.13 Additionally, Ortiz and colleagues14 investigated four methods of 2-D knee valgus measurement and found that all methods showed good to excellent reliability (ICC: 0.89–0.99) during 40 cm drop jump maneuver with a countermovement jump among 16 healthy participants (nine males and seven females). Knee to ankle separation ratio and knee separation distance showed excellent correlation (ICC: 0.96; 95% CI: 0.82–0.98 and ICC: 0.94; 95% CI: 0.90–0.96, respectively) with the kinematic results from 3-D motion analysis system. On the contrary, the other two methods of measuring knee FPPA displayed poor to moderate correlation (ICC: 0–0.57) with the kinematic results from 3-D motion analysis system. One postulated reason was the inaccuracy of 2-D motion analysis in measuring the transverse plane motions.14
In addition, Ramirez et al.,15 found that 2-D mobile application (2D Spark Motion Pro™) showed excellent reliability (ICC = 0.927 and 0.792) in measuring frontal plane knee kinematics during single leg hop test among anterior knee pain patients. On a similar note, Krause et al.,16 reported that the reliability of Coach’s Eye (Tech Smith Corporation, Okemos, MI) ranged from 0.96-0.99 when measuring sagittal plane knee angle during a squat maneuver in healthy participants. In short, mobile motion capture apps can be potentially used to objectively quantify joint angles during video analysis with good reliability.
On the other hand, Maykut and colleagues17 reported that 2-D kinematic variables demonstrated high reliability and intra-rater reliability for peak hip adduction angle (HADD) (ICCs: 0.951- 0.963), peak contralateral pelvic drop (CPD) (ICCs: 0.958-0.966), and peak knee abduction angle (KABD) (ICCs: 0.955-0.976) during treadmill running at self-selected speed among 24 healthy male and female collegiate cross-country runners. Their study also highlighted a significant moderate correlation between 2-D and 3-D methods for HADD in both male and female runners for both legs. However, no significant correlation existed between 2-D and 3-D motion analysis for the kinematic variables of CPD and KABD.
To date, no studies have compared the reliability and validity of 2-D and 3-D motion analysis during SLS between individuals with and without DKV. Therefore, this study aimed to determine the within- and between-day reliability as well as the concurrent validity of 2-D and 3-D motion analysis of lower limb kinematics during 45° and 60° SLS among physically active females with and without DKV. The authors hypothesized a significant correlation for within-day and between-day reliability of DKV during SLS but some kinematic variables particularly those in the transverse plane may not be valid for 2-D motion analysis during SLS, as shown in previous studies.13–15,17
METHODS
Initially, 44 collegiate players of various sports (handball, volleyball, frisbee, and basketball) expressed interest to participate in the study. All of them signed the informed consent form. Ethical approval was obtained from the Universiti Sains Malaysia Human Research Ethics Committee (USM/JEPeM/18070316). A priori sample size calculated by G-power software (3.0.10, Universitat Dusseldorf, Germany) for 80% power and 0.8 effect size showed that 17 participants per group were sufficient.18
The inclusion criteria were physically active females who participated in either handball, volleyball, frisbee, or basketball; regularly trained at least three times per week; with healthy body mass index (BMI: 18.5-24.9 kg/m2); aged between 19- to 25-years of age, with no previous injuries of the lower extremities. Only individuals with a normal BMI were recruited to limit the influence of body weight on knee biomechanics during landing.18 All anthropometric measurements including body weight and height (Seca 769, Hamburg, Germany), body fat percentage (Electronic Body Fat Percentage Analyzer (Omron HBF-360, Kyoto, Japan), and leg length (measuring tape) were measured prior to the SLS trials.
DVJ Screening Test
To differentiate participants with and without DKV, a screening test was conducted. Participants completed three DVJ trials with a one-minute rest interval between trials.19 The trials were recorded with a digital camera (SONY HDR-CX240, Japan) from the frontal plane and evaluated with Kinovea Software (version 0.8.15, Kinovea, www.kinovea.org). The intersection of the line formed by the anterior superior iliac spine (ASIS) and the center of the knee joint with the line formed by the center of the knee joint and the center of the ankle joint was used to calculate the 2-D knee FPPA.19 For females, the average 2-D knee FPPA during DVJ is 7°-13° whereby values more than 13° are considered as excessive DKV.19 Following analysis, 17 subjects were identified as having excessive DKV while another 17 subjects recorded a normal range of DKV.
Single Leg Squat Test
Upon arrival at the lab, the participants warmed up for five minutes by pedaling at 60 RPM with loads of 50 watts on a cycle ergometer (Cybex Inc., Ronkonkoma, NY, USA). Then, the researcher described and demonstrated the SLS test to the participants before the participants practiced the SLS test. The dominant leg was determined by observing which leg the participants used to kick a ball.20 The preferred stabilizing leg was the non-dominant limb.21
For the within-day reliability test, the SLS protocol was repeated twice a day with at least a four-hour gap between the trials. For between-day reliability, the trials were repeated twice in different days with a one-week interval. For the validity test, lower limb motions during SLS were captured simultaneously using digital cameras and infrared cameras. For 3-D motion analysis, the researcher palpated the participants to place reflective markers on the selected anatomical landmarks. A total of 35 reflective markers were affixed on both sides of the ASIS, posterior superior iliac crest, greater trochanter, medial and lateral knees, as well as medial and lateral malleoli. To capture frontal and sagittal motions during the SLS test, two digital cameras (SONY HDR-CX240, Japan) were set approximately 2.4 m in front and to the side of the participants, oriented roughly to the level of the pelvis.20
Next, the participants were asked to demonstrate double leg squat while the researcher set the angle of knee flexion (60° and 45°) with a goniometer. A clear plastic goniometer was used to determine the desired angle. During the double limb squat, an adjustable plinth was placed at the height of the ischial tuberosity to indicate the required squat depth (60° and 45° of knee flexion).20
After that, the participants stood barefoot for ten seconds to have their static standing pose captured. The trials started with the dominant leg as the stance leg for both squat depths. During the trial, they were asked to balance on one limb (i.e., the stance leg) while keeping an erect trunk with hands on their shoulders. They were advised to perform the SLS until their knee flexed to 60°. The neutral position of the stance foot (i.e., directed forward) was maintained. To achieve the appropriate knee flexion, the participants had to touch the plinth with their buttocks each time they squatted while keeping the opposite limb facing forward and avoiding ground contact.20 The test was then repeated with SLS to 45° knee flexion for both dominant and non-dominant legs. A metronome was set to 60 beats per minute throughout the squat.20 The participants followed the rhythm of five seconds of lowering and five seconds of returning to standing. This standardized pace eliminated the influence of speed on SLS kinematics. The trials were spaced by a rest period of one minute across stance legs (i.e., dominant and non-dominant legs) and squat depths (60° and 45° knee flexion). After the experiment, the participants were instructed to stretch their legs.
The marker trajectories were recorded at 100 Hz during these trials and identified using Qualisys Track Manager software (Qualisys, version 2.6.673, Gothenburg, Sweden). The raw data of the marker coordinates were then low-pass filtered using a fourth-order, zero-lag Butterworth filter with a cut off frequency of 12 Hz. Spline estimates were used to fill in the missing trajectories. Lastly, the data were imported into Visual 3D (version5, C-Motion, Inc, Rockville, MD, USA), which was used to create a bone model and calculate the lower limb joint angles.
Statistical Analyses
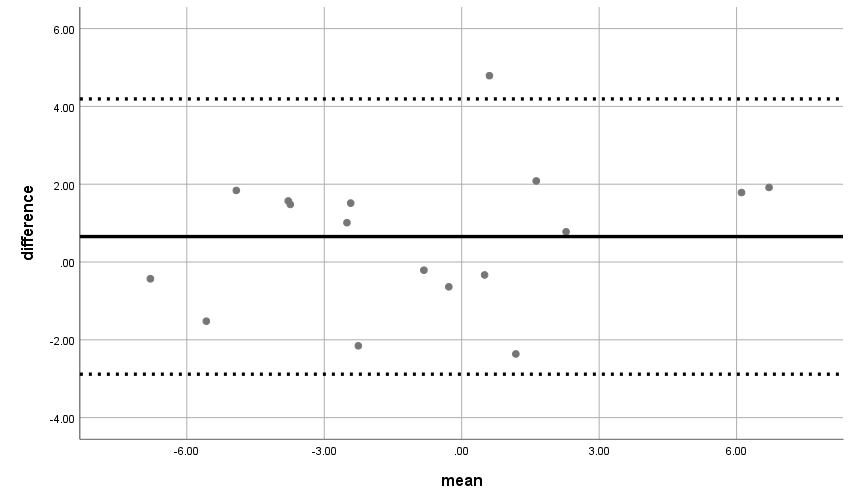
Data were tested for normal distribution with the Shapiro–Wilk test that was appropriate for small sample sizes (<50 samples).22 The ICC was used to assess the reliability of knee FPPA in 2-D and 3-D motion capture within- and between-days among participants with and without DKV. The ICC values were interpreted according to criteria outlined by Koo & Li,23 i.e., poor: < 0.50, moderate reliability: 0.50 to 0.75, good reliability: 0.75 to 0.90, and excellent reliability: > 0.90.23 Concurrent validity between 2-D and 3-D methods were evaluated by Pearson correlation coefficients (r) to analyze the association between the two methods. The magnitude of correlations of 0.00-0.25 was interpreted as little to no relationship, 0.25-0.50 as fair relationship, 0.50-0.75 as moderate to strong relationship, and above 0.75 as good to excellent relationship.18 In addition, the data were visualized using a Bland-Altman plot to show the direction of dispersion from the consolidated data. Any discrepancy of less than 5° between the upper and lower limits of agreement for the 2-D and 3-D analysis was deemed acceptable.13 All statistical analyses were performed using the Statistical Package for the Social Sciences (SPSS) (version 24.0, IBM Inc, Armonk, NY, United States). The level of significance was set at p < 0.05.
RESULTS
From 44 interested volunteers, ten were excluded based on the exclusion criteria. The 34 volunteers who remained were divided into two groups based on their screening test results. The physical features of participants with and without DKV are shown in Table 1. The data were compared across groups were compared using the independent T-test, with alpha level of less than 0.05 indicates significant differences.
The only significant difference across groups was knee FPPA of dominant leg during DVJ screening test (p≤0.05) which distinguished those with and without excessive DKV. Other physical characteristics such as height, body weight, BMI, body fat percentage and pelvic width showed no significant differences across groups. The BMI and body fat percentage of all individuals were within the normal values for physically active females.
Reliability Within- and Between-Days
The ICC was used to determine the within- and between-day reliability. It is a measure of the capability of a test to differentiate between two groups of participants for both within and between sessions. This study also indicates the relative reliability for 2-D knee FPPA or 3-D knee valgus measurement consistency. In other words, the ICC values represent the level of reliability.
Table 2 shows the within- and between- days reliability of 2-D knee FPPA measured during 45° and 60° SLS in normal and excessive DKV groups. All the variables exhibited moderate to excellent reliability (ICC ≥ 0.50) based on the ICC value.
Table 3 shows the reliability within- and between-days of 3-D knee valgus during 45° and 60° SLS in the normal and excessive DKV groups. All the variables showed moderate to excellent reliability (ICC≥0.50). The 2-D knee FPPA acquired from video analysis during 45° and 60° SLS (r=0.78, p=0.001) were consistent with 3-D knee valgus angle of the same activities.
Concurrent Validity Between 2-D and 3-D Motion Analysis
Table 4 presents the 2-D and 3-D measurement values in the normal and excessive DKV groups at 45° SLS. For the non-dominant leg SLS at 45°, there was an excellent positive relationship between 2-D knee FPPA and 3-D knee valgus in the normal group (r= 0.90, p= 0.001). However, no significant association between 2-D knee FPPA and 3-D knee valgus was observed during dominant leg SLS at 45°. Therefore, the validity of 2-D knee FPPA and 3-D knee valgus methods only applied for the non-dominant leg.
As for the excessive DKV group, there was a moderate positive relationship between 2-D knee FPPA and 3-D knee valgus for non-dominant leg during 45° SLS (r= 0.58, p= 0.02). In contrast, there was no significant relationship for dominant leg SLS. Therefore, the validity for 2-D and 3-D methods was only met for the non-dominant leg.
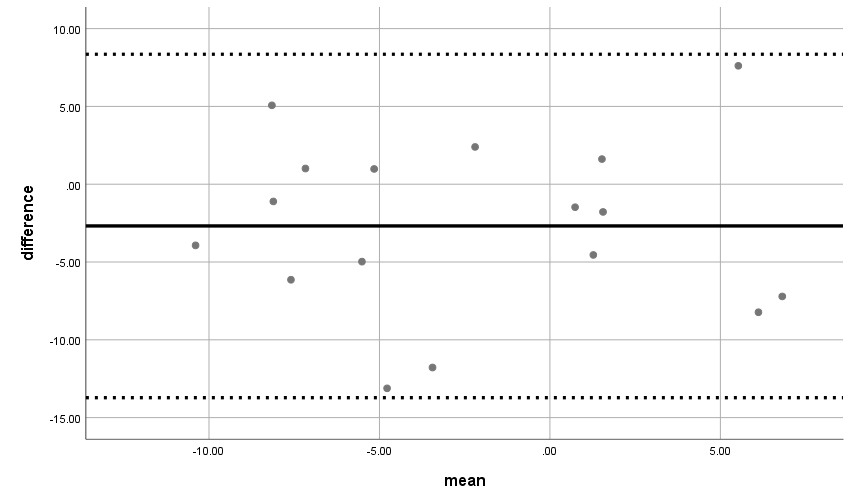
Thus, Bland Altman plots were produced to compare the data of 2-D knee FPPA and 3-D knee valgus during SLS in the frontal plane for non-dominant leg in normal DKV group and excessive DKV group during 45° SLS (Figure 1 and 2). The difference between the 2-D knee FPPA and 3-D knee valgus measurement was plotted against the mean of the two measurements for each dependent variable.


In the normal group, a significant moderate positive relationship was noted between 2-D knee FPPA and 3-D knee valgus during dominant leg 60° SLS (r= 0.65, p= 0.00) (Table 5). However, no significant relationship between 2-D knee FPPA and 3-D knee valgus was observed during non-dominant leg 60° SLS. Thus, the validity of 2-D knee FPPA and 3-D knee valgus for 60° SLS was met for the dominant leg only.
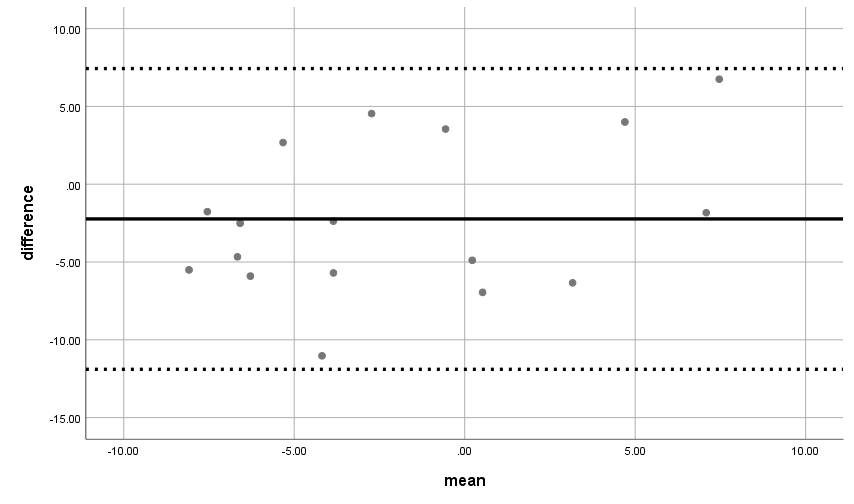
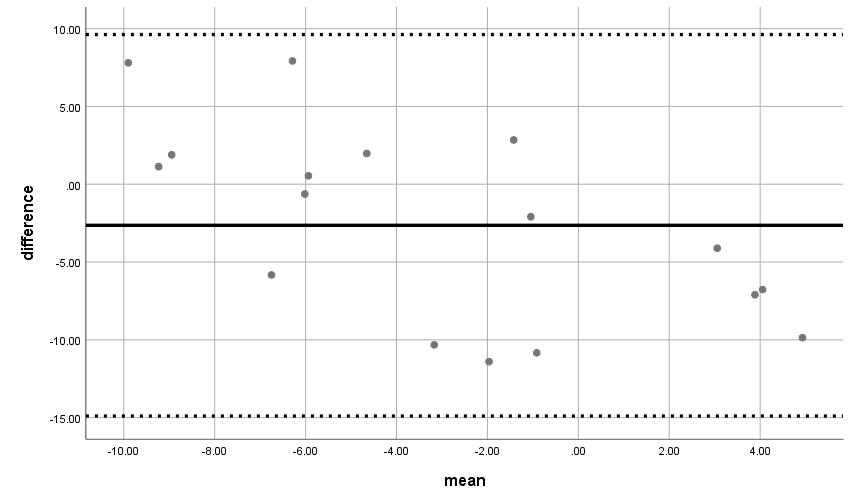
In the excessive DKV group, non-dominant leg during 60° SLS showed a moderate positive relationship between 2-D knee FPPA and 3-D knee valgus (r= 0.48, p= 0.05). However, no significant relationship was observed between both methods on the dominant leg during 60° SLS. The examination of Bland-Altman plots and calculation of upper and lower limits of agreement indicated that variability in the difference scores between 2-D knee FPPA and 3-D knee valgus measures fell within 95% limits of agreement (dashed lines). Figures 3 and 4 represent the significant results for the dominant leg in the normal DKV group and the non-dominant leg in the excessive DKV group.


DISCUSSION
The purpose of this study was to assess within- and between-session reliability of knee FPPA in 2-D and 3-D motion capture during 45° and 60° SLS. The validity and reliability of these methods were then compared across physically active females with and without DKV. Good within-session reliability is crucial since it ensures the consistency of measuring 2-D knee FPPA during the screening test. The results showed that all the variables exhibited moderate to excellent reliability (ICC≥0.50). This indicates that 2-D and 3-D motion capture methods during SLS were reliable to be used in clinical testing to assess knee angle particularly among females with normal and excessive DKV.
Similarly, Gwynne & Curran13 investigated within-session reliability of 2-D knee FPPA during 60° SLS in the same session with a one-hour break and between-session reliability with at least 48 hours interval. They reported that 2-D knee FPPA demonstrated good within-session (ICC= 0.86, 95% CI= 0.94 to 0.72) and between-session (ICC= 0.78, 95% CI= 0.18 to 0.97) reliability. When 2-D knee FPPA assessments were repeated throughout time, good between-session ICCs indicated good test-retest reliability values.13 However, their 18 recreationally active subjects (nine females and nine males) had not been screened for knee abnormalities and the SLS test was performed on dominant leg only.13 In order to avoid any bias due to knee abnormalities, the current study separated participants with normal and excessive DKV. Physically active females were the focus of the current study because they have been associated with an increased risk of non-contact knee injury due to excessive DKV.24 In Gwynne & Curran et al.,13 good between-session reliability of 60° SLS (ICC= 0.74) was reported. Similarly, Munro et al. found that physically active males (ICC= 0.89) and females (ICC= 0.59) also showed good to exceptional between-session reliability for SLS at 45° knee flexion.19 Good between-session ICC indicates good test-retest reliability of observed values when 2-D knee FPPA measurement is repeated over time.
Currently, there are no studies that differentiate the SLS kinematics across those with and without DKV. Most studies have compared the knee angle of healthy subjects versus those with pathological condition such as patellofemoral pain (PFP). For instance, Gwynne & Curran25 found that increased 2-D FPPA was a fair predictor of PFP as indicated by receiver operating characteristic (ROC) curve analysis during 60° SLS. The ROC curves in the study indicated that 2-D FPPA had fair specificity and sensitivity of discriminating PFP (95% CI= 0.60 to 0.86; p= 0.002). They conducted single limb stance and 60° SLS among 30 recreationally active individuals with PFP and 30 non-injured individuals. Interestingly, FPPA remained unchanged in the non-injured group during static stance and SLS. However, there was excessive frontal plane knee alignment in the PFP group (p=0.003) during the 60° SLS that demand greater neuromuscular control of the lower limb.25 Additionally, they only relied on 2-D analysis that might be less accurate than the 3-D analysis. Considering this, the knee valgus angle during 45° and 60° SLS either from 2-D or 3-D motion analysis is a valid indicator to distinguish those with excessive DKV from healthy individual, particularly among physically active adults.
The current study showed that the 2-D knee FPPA during 45° SLS were valid for non-dominant leg in both groups. Additionally, the 2-D knee FPPA during 60° SLS were valid for non-dominant leg in excessive DKV group and dominant leg in normal group. The differences of SLS validity across the legs may be due to the weakness of non-dominant leg, which typically being under-utilized and may be more inclined to excessive DKV than the dominant leg.13 For instance, Gwynne and Curran13 found that the 2-D knee FPPA obtained from video analysis during single limb stance (r= 0.64, p= 0.002) and 60° SLS on the dominant leg (r=0.78, p<0.001) were comparable with the 3-D knee valgus for the same task.13 However, they only studied the dominant leg, thus the validity of SLS on non-dominant leg is not known.
Similar to the current results, Kingston and colleagues also observed no relationships between 2-D and 3-D knee frontal plane kinematics during SLS, drop vertical jump (DVJ), and single-leg hop (SLH) despite showing good to excellent reliability (ICC= 0.70-0.86) of the data during those taks.26 This probably is due to their participants (i.e., females with PFP ), as those with knee pain often perform functional tasks by applying increased frontal and transverse motions compared to healthy females.24 Additionally, Schurr et al.,18 observed moderate to strong correlations between the 2-D and 3-D joint angles in the sagittal plane (r = 0.51-0.093) but the knee frontal angle was poorly correlated (r = 0.308) during 90° SLS. These comparative findings indicate that the squat depths may influence the validity between the two methods.
Limitations
Only physically active females were included in the study due to greater prevalence of non-contact injuries related to excessive DKV among females than males.27,28 Additionally, only females with a normal BMI were included to prevent the unwanted effects of extra weight on the participants’ motion during functional tasks.29 Therefore, the results may not be generalizable to the overweight and obese females and males. The physiological demands associated with SLS may not be of sufficient magnitude to elicit meaningful alterations in lower limb kinematics.28 Thus, future research should incorporate a wider range of complex motions such as a drop vertical jump at different heights30 and changing directions to detect any substantial changes in knee motions. Moreover, the stance foot was fixed in neutral position during SLS. It was shown that the foot position may influence knee kinematics during SLS,31 therefore future studies may include various foot positions during SLS. The sample size is within the range of previous studies’ sample size that have. investigated SLS validity and reliability.13,19 However, the ability to detect differences or relationship between variables may increase by increasing the sample size.
CONCLUSION
The results indicate that 2-D and 3-D methods of measuring knee valgus during 45° and 60° SLS are both reliable in physically active females with normal and excessive DKV. However, as validity depends on the squat depths, stance leg, and presence of DKV, clinicians should consider these factors when conducting SLS test. While 2-D knee FPPA may not be as accurate as 3-D analysis in quantifying each movement that contributes to DKV, it may provide clinicians with a useful tool that is inexpensive, portable, and readily available that can be used to assess frontal plane knee alignment during SLS.
CONFLICT OF INTEREST
None declared.
FUNDING
The study was funded by Universiti Sains Malaysia RUI Grant (1001/PPSK/8012364).