
INTRODUCTION
In 2018-2019, 15,624 female athletes participated on NCAA cross-country (XC) teams.1 Although XC is a non-contact sport, female collegiate runners had a high risk of incurring a running-related injury (RRI) with an RRI rate of 5.85/1000 athletic encounters (AEs), which was 25% greater than their male counterparts.2 More importantly, female collegiate XC runners experienced the highest rate of stress fracture of all collegiate sports in the United States.3 RRIs have serious and sometimes long-term consequences for female collegiate XC runners. According to a 2010 study, 13.1% of RRIs in female collegiate XC runners resulted in greater than three weeks of lost training and competing time.2 These RRIs may jeopardize competitive seasons, can result in a reduction or retraction of an athlete’s scholarship award, and may also negatively influence the runner’s mental health and quality of life.4 RRIs may also increase risk of osteoarthritis and decreased sport participation, which can lead to adverse health outcomes associated with decreased physical activity.5 Thus, identifying factors that may heighten the risk of RRI is necessary to help prevent RRIs at this sport level.
Limited evidence is available on risk factors for RRI in female collegiate XC runners. The few studies that have prospectively examined risk factors for RRI in male and female collegiate XC runners have linked RRI to female athlete triad risk factors, hip abduction strength, pre-season injury, large mileage increases, poor sleep quality, and several biomechanical running factors.6–8
Impaired hip abductor performance contributes to contralateral pelvic drop during gait and has been directly related to instability of the lower kinetic chain.8 In the collegiate population, authors have found associations between hip abductor strength and medial tibial stress syndrome8 and iliotibial band syndrome (ITBS).9 As these studies combined the data for male and female runners, there are no known studies that have reported examining the link between hip abductor strength and RRI specific to female collegiate cross-country runners.
Only a few prospective studies have investigated biomechanical risk factors and risk of RRI in collegiate XC runners. Increased contralateral hip drop and increased vertical excursion of center of mass have been associated with increased odds of future RRI.8,10 Kliethermes et al.10 also observed an association between decreased step rate (SR) and increased likelihood of bone-stress injury.
The objective of this study was to examine the relationship between RRI, hip muscle strength, and lower extremity running kinematics in female collegiate XC runners, given the limited prospective cohort studies that have examined injury risk in this specific population.8,10 This study hypothesized that 1) decreased hip abductor strength and 2) biomechanical kinematic factors associated with increased loading (such as lower step rate, lower knee flexion at initial contact, and greater foot contact angle) would increase the odds of RRI. As biomechanical characteristics such as increased knee adduction, increased contralateral hip drop, and increased hip adduction have often been used as clinical indicators of impaired hip abductor performance, it was expected that these running kinematic variables would be negatively correlated with peak hip abductor strength.
METHODS
Participants
Twenty female XC runners from several NCAA Intercollegiate Division I and II XC teams in southern California in 2019 participated in the study. Coaches were first contacted via email to explain the study and request permission to contact the athletes. Athletes were then asked to sign up for the study after an in-person presentation at practice. Participation was voluntary. To be eligible, participants had to (a) be between the ages of 18-28; (b) were free of any lower extremity injury and running without limitation in the two weeks prior to completing the study measurements; (c) run at least 25 mi/week; and (d) have no contraindications to exercise as measured by the study questionnaire. The study was approved by the San Diego State University Institutional Review Board. All participants provided consent prior to participating in the study.
Study Design and Data Collection
A prospective observational study design was used in this study. Prior to the 2019 NCAA Intercollegiate Division I and II XC competitive seasons, the runners completed a study questionnaire, completed hip abductor muscle strength testing, and underwent 3-D motion capture to evaluate their running biomechanics.
Study Questionnaire. At the time of anthropometric (height and weight) evaluation, running kinematics analysis and hip abductor muscle testing, the runners completed a questionnaire on baseline characteristics including gender, age, school year, running experience, student classification (years in college), and any contraindications to exercises.
Running Kinematics. Each runner’s kinematic data were collected using an 8-camera 3D Qualisys Motion Capture System (Motion Analysis Corporation, Santa Rosa, CA, USA) while running on a treadmill (WOODWAY USA, Inc., Waukesha, WI). Retro-reflective markers for tracking 3D movement were placed on the subject using a modified Helen Hayes marker set.11 Kinematic data were recorded using Qualisys Track Manager (QTM) software. After static calibration, the runner performed a 5-minute warm-up at a self-selected pace to accommodate to the treadmill. The runner then ran for two minutes at her preferred training speed. During the 2-minute trial, 2 sets of 10 seconds of data were captured at random without informing the runner. Visual 3D (C-Motion Incorporated, Germantown, MD) software was used to process the kinematic data using the QTM Project Automation Framework (PAF) Running module. Variables of interest included vertical displacement of center of mass; hip drop; maximum hip adduction, hip internal rotation, knee adduction, and knee flexion angle during stance; hip adduction, hip internal rotation, knee adduction, knee flexion, tibial inclination, and contact angle at footstrike; supination at footstrike; maximum pronation during stance; horizontal distance from center of mass to footstrike; and SR. All variables except vertical displacement of center of mass and SR were measured bilaterally.
Hip Muscle Strength. Following a 10-minute rest period, each runner was evaluated for hip abductor muscle strength using the Biodex System 4 Pro™ Isokinetic dynamometer. After a practice trial of five submaximal repetitions to accommodate to the testing procedures, runners were instructed to perform 10 concentric, maximal effort hip abduction repetitions at 90º per second through a range of motion from neutral hip abduction to 30 degrees abduction in side-lying using their dominant limb. The dominant limb was defined as the limb with which a participant would kick a sports ball. This process was repeated for the non-dominant limb following an additional 5-minute break period.
Running- Related Injuries. Once the runners finished their XC season, they completed an exit survey where they reported any occurrence of RRI during the XC season. The definition of RRI was any muscle or bone complaint that involved the low back or lower extremity and caused the runner to miss one or more practices or competitive events.12 The runners were provided a list of RRIs specific to body region, side, and type (e.g., strain, Patellofemoral Pain Syndrome, tendonitis, etc.) and were asked to specify date and time missed related to the RRI. The survey also provided open-ended questions to allow runners to specify body regions and type of injuries not available on the survey.
Data Analysis
Mean (SD) differences and frequencies were determined for demographic (chronological age, grade, GPA, years of cross-country experience) and physical characteristics (height, weight, body mass index [BMI]). Height (m) (to the nearest 1.27 cm) and weight (kg) (to the nearest 0.23 kg) were measured using a stadiometer and physician scale, respectively, to calculate body mass index (BMI).
For comparison of peak torque during maximal, concentric hip abductor contraction, peak torque was defined as the mean of the top three of the first 10 repetitions. The values were normalized by the runner’s body weight (kg). Asymmetry values were determined by the absolute difference between left and right limb scores for peak torque. Independent t-tests were used to determine the mean differences of hip abductor muscle asymmetry, peak hip abductor muscle asymmetry, and torque values between injured and non-injured runners.
Independent t-tests were also used to compare differences in mean running kinematic values between injured and non-injured runners. Pearson correlation coefficients were calculated to determine relationships between running kinematic variables and unilateral peak hip abductor strength, peak hip abductor strength asymmetry, and bilateral average peak hip abductor strength.
All study analyses were conducted using SPSS Statistics version 28 (IBM, Armonk, NY) with the alpha level set a priori at 0.05.
RESULTS
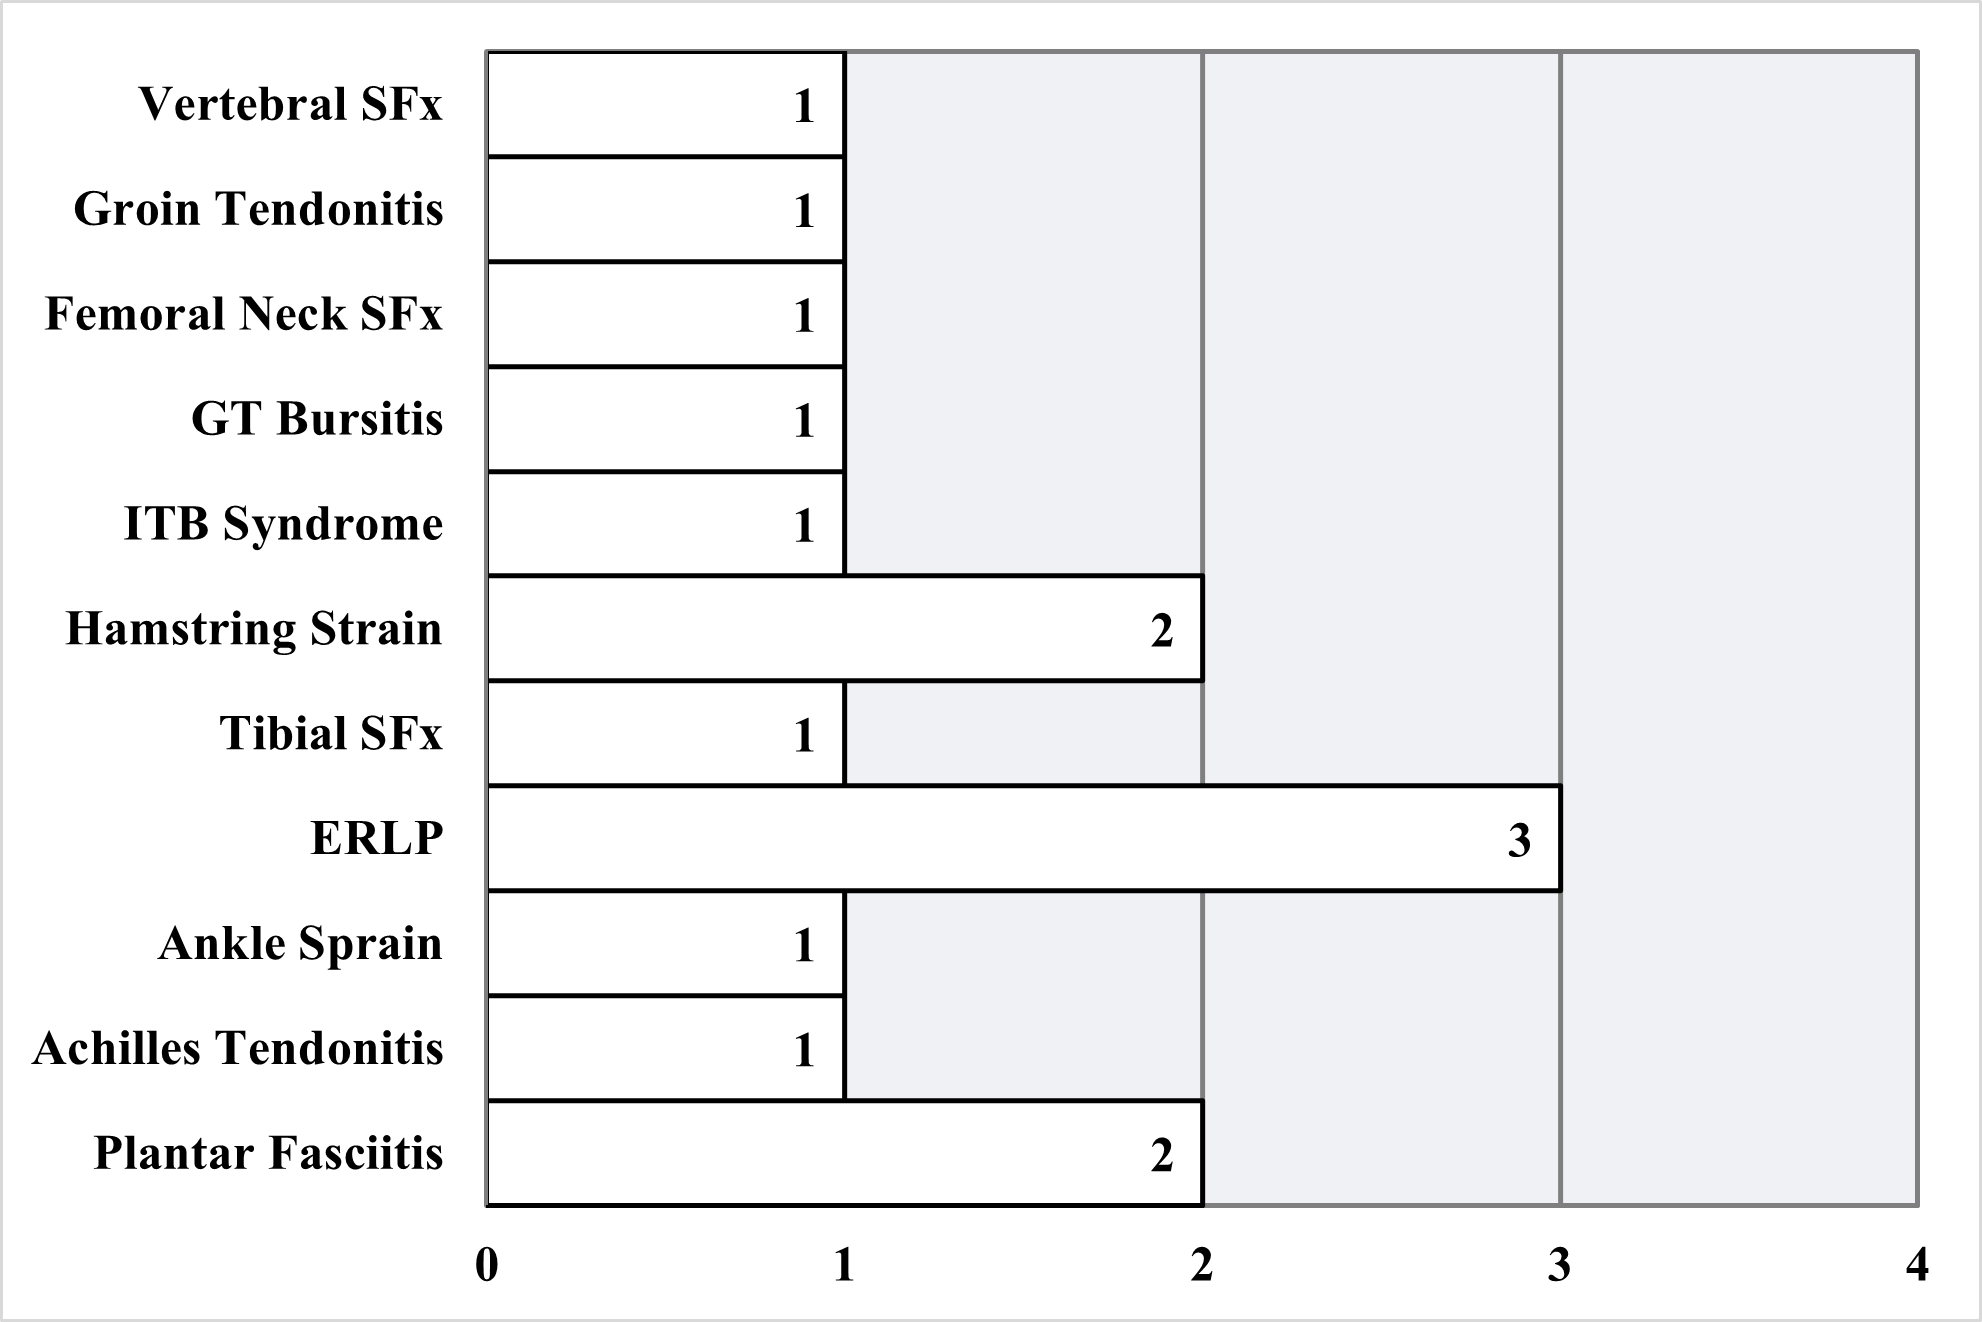
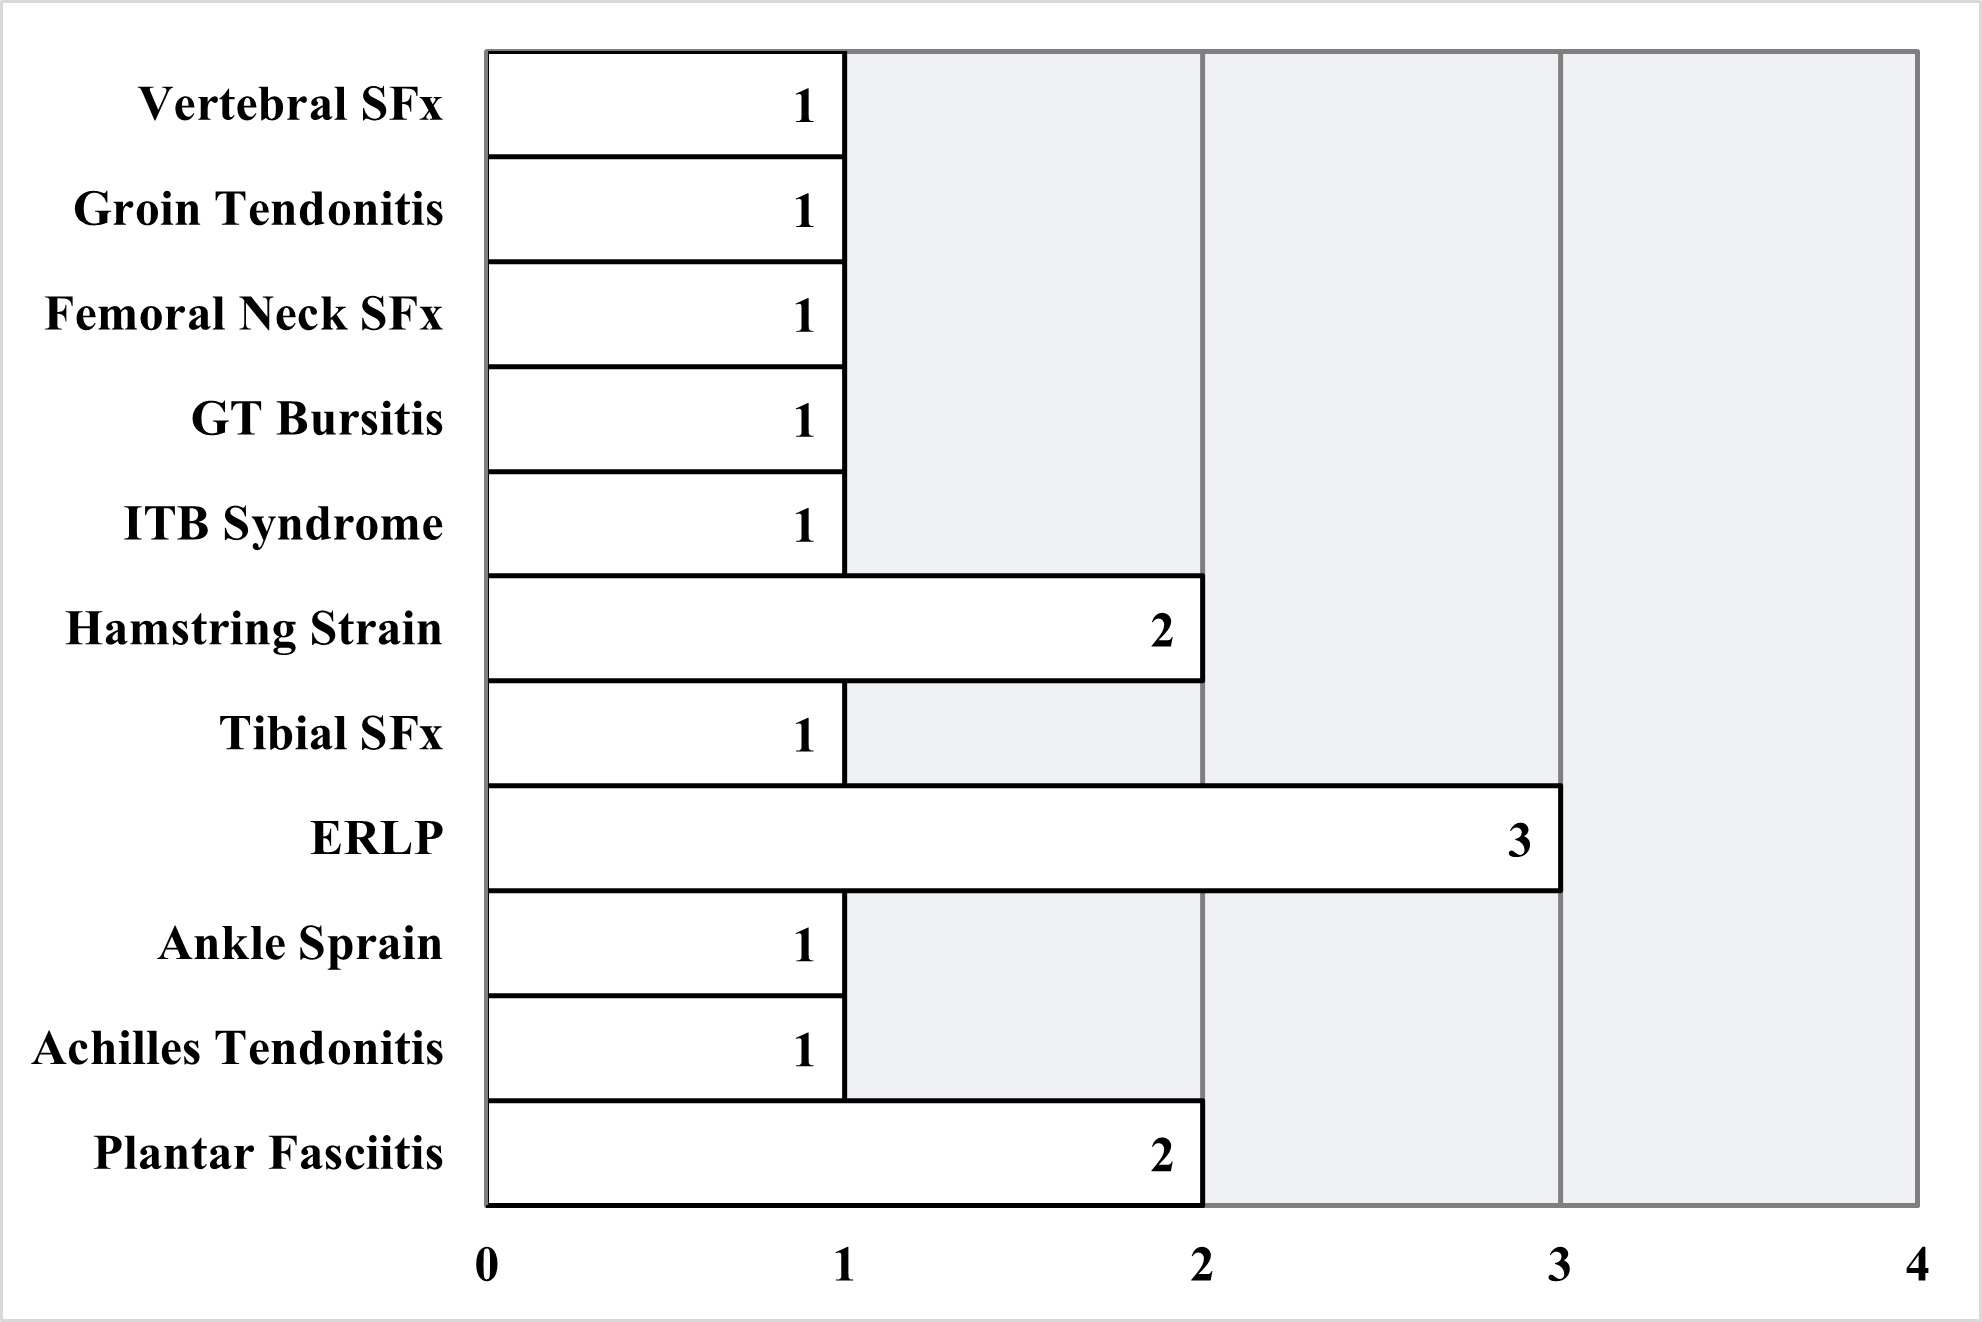
The runners had an average age of 19.2 ± 1.1y, (range:17 to 22 y), a mean BMI of 21.0 (± 1.3), and XC running experience of 7.4 (± 2.2) years (Table 1). End-of-the-season RRI information was gathered from only 19 of the 20 participants as one participant did not complete the final exit survey. During the season, 11 (57.9%) of the runners reported 15 RRIs, and 26.3% (n=5) incurred a bone-stress RRI. The most common type of RRI was ‘Exercise Related Leg Pain’ (ERLP [pain between the knee and ankle which occurs with exercise]13) (Figure 1).
Hip Abductor Muscle Strength
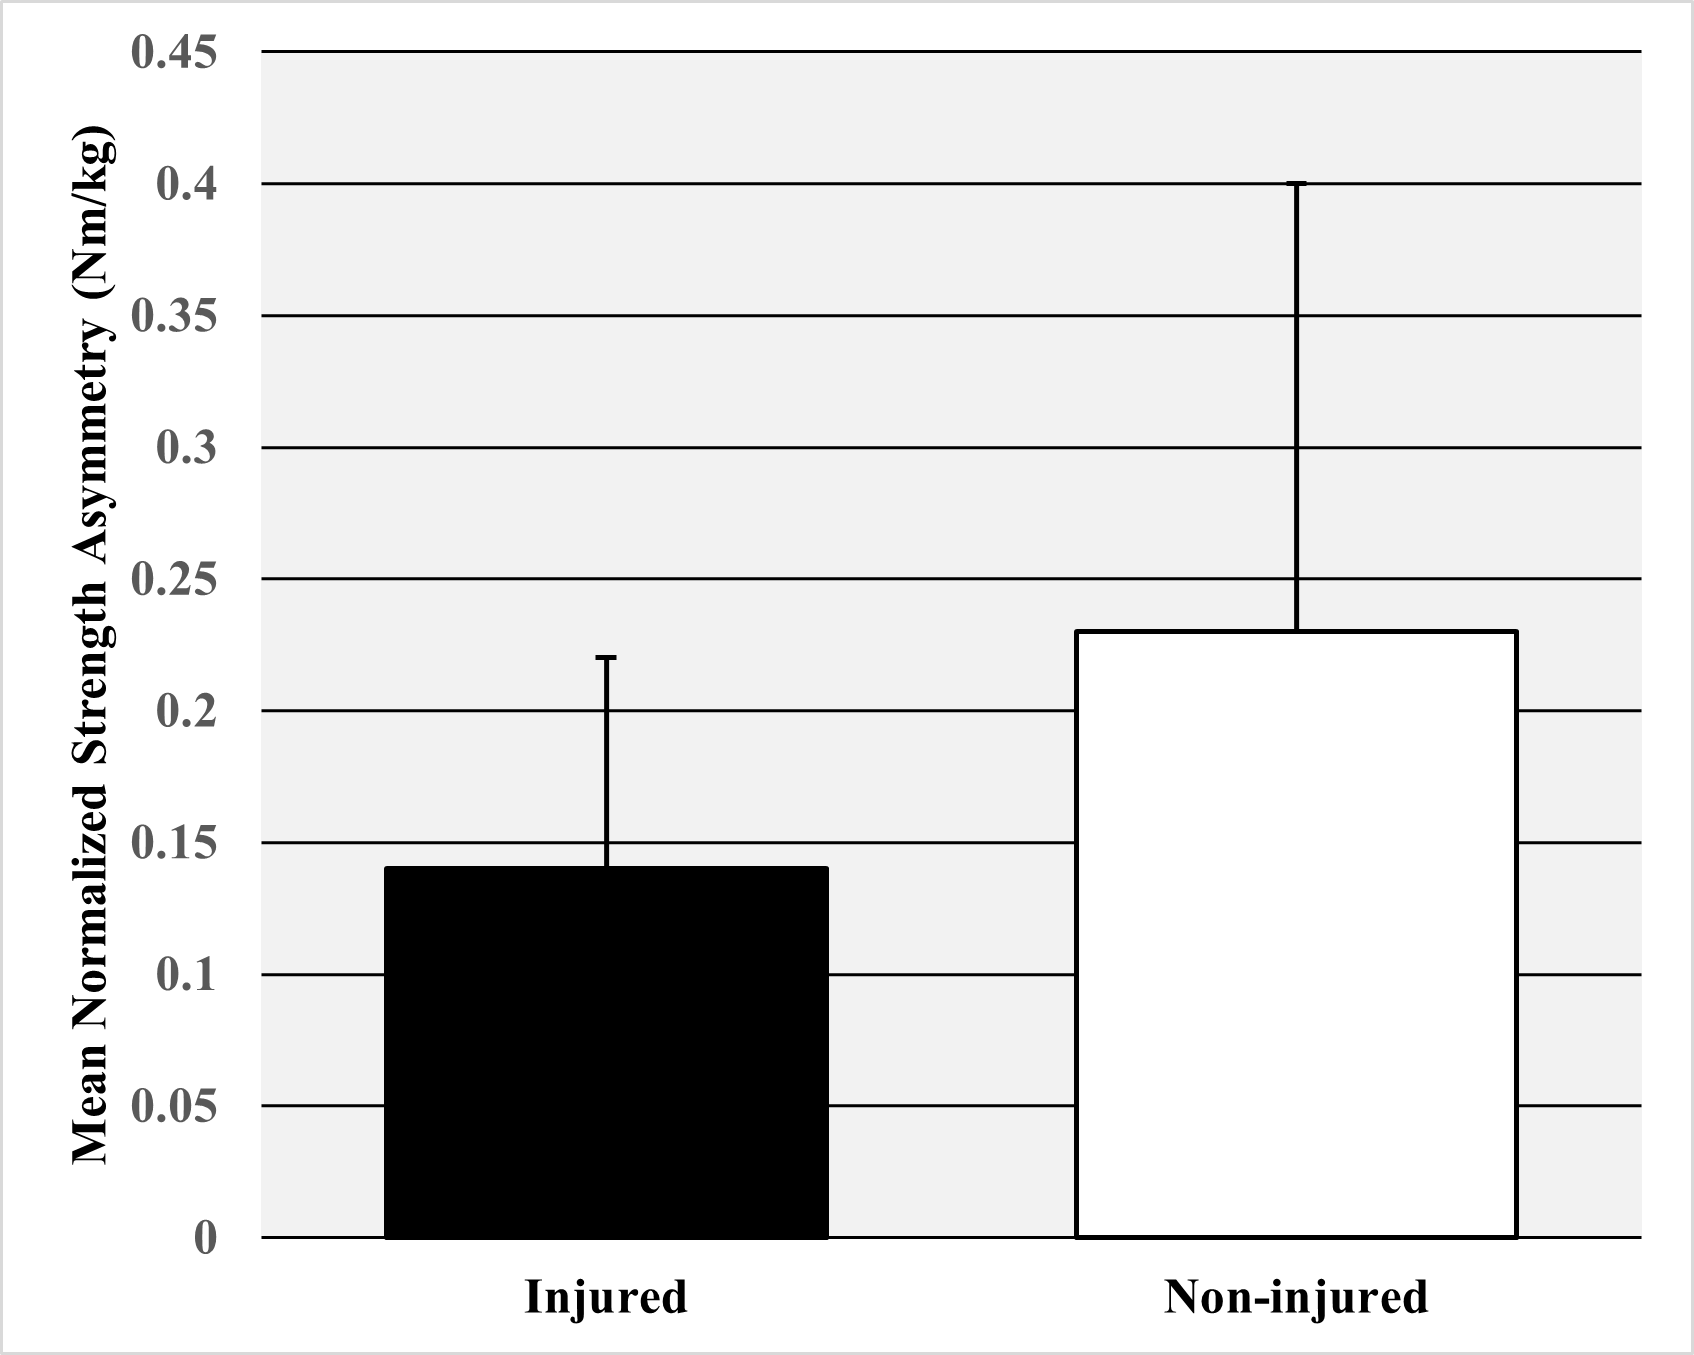
The bilateral combined average peak muscle strength normalized by bodyweight did not differ significantly between injured (1.59 Nm/kg±0.24) and non-injured runners (1.55 Nm/kg ±0.36) (p=0.76) (Figure 2). The mean normalized muscle strength asymmetry was also not significantly different between injured (0.14 Nm/kg±0.08) and non-injured runners (0.23 Nm/kg±0.17) [p=0.18] (Figure 3).


Running Kinematics
No statistically significant differences (p>0.05) were found between the running kinematic variables of injured and non-injured runners (Table 2). Several running kinematic variables approached statistically significant differences: left knee flexion at foot-strike (p=0.14), right hip internal rotation at footstrike (p=0.10), and right hip internal rotation at stance (p=0.06).
Moderate positive correlations were found between overall peak hip abductor muscle strength and right knee adduction at footstrike and stance (r=0.50, r=0.55) and left supination at footstrike (r=0.48) (all p≤0.05, Table 3). A statistically significant moderate negative correlation was found between overall peak hip abductor muscle strength and right peak pronation during stance (r=-0.47) (p≤0.05). Statistically significant correlations were also observed between right hip abductor muscle strength and left supination at footstrike (r=0.51) and left hip abductor muscle strength and right peak pronation during stance (r=-0.54) (all p≤0.05).
DISCUSSION
The primary purpose of this study was to examine the relationship between hip muscle strength and running kinematics and occurrence of RRI among female NCAA cross-country runners during an intercollegiate XC season. The findings indicated that hip abductor muscle strength and selected running kinematic variables were not significantly associated with increased occurrence of RRI. The findings of this study also found few significant correlations existed between hip abductor muscle peak strength or asymmetry and the measured running kinematic variables. The statistically significant moderate correlations observed were between hip abductor muscle peak strength and knee adduction and foot position in the frontal plane at footstrike and stance.
Hip Abductor Muscle Strength
Few studies have prospectively investigated the relationship between hip muscle strength and RRI in NCAA female collegiate XC runners. The current study’s findings did not support prior evidence that demonstrated a direct relationship between hip abductor muscle strength and RRI. Using a prospective study design, Becker et al.8 reported that isometric hip abductor strength predicted medial tibial stress syndrome in collegiate female and male runners. In a cross-sectional study of collegiate female runners, Fredericson et al.9 also reported finding an association between isometric strength and of iliotibial band syndrome (ITBS) in cross-country athletes. The inconsistencies between the prior study’s findings and the current study’s results may be partially related to differences in study design and methodology. Becker et al.8 had a slightly larger sample size of 24 runners and followed runners for a two-year period. Their sample also included both male and female runners and separate analyses were not reported for the two groups. Additionally, they measured isometric hip abductor muscle strength while the current study analyzed concentric isokinetic hip abductor muscle strength. The current study protocol also required significantly more maximum effort repetitions, which may have influenced runners’ performance on the strength test due to concerns of fatigue the day before practices or preseason competitions. Testing strength shortly after a period of treadmill running may have also contributed to differences between the study results. Similar to Becker et al.,8 the sample studied by Fredericson et al.9 included 24 female and male runners and also did not report separate data for each gender, which may explain differing results between their study and this study’s findings. Differences in findings between the current study and Fredericson et al.9 may also be a result of variations in study design as Fredericson et al.9 used a cross sectional design and only examined runners with and without ITBS. Both studies also quantified hip abductor strength using methods different from the current study. Becker et al.8 normalized hip abductor muscle strength by weight rather than weight and height, and Fredericson et al.9 reported strength as percentage of body weight. Thus, the differing methods used by the studies make it difficult to compare hip abductor muscle strength and RRI between the three studies.
Running Kinematics
The current study reported several kinematic variables in the female collegiate population, some of which have been previously reported in other prospective studies in similar populations. In a prospective study of collegiate runners, Kliethermes et al.,10 reported similar averages for step rate, center of mass vertical excursion, and peak hip adduction during stance in female runners. However, they reported slightly lower averages (differences of about 5 centimeters) for horizontal distance from center of mass to heel at footstrike. Differences between the studies could be due to this study’s smaller sample size of 19 runners, which may have allowed for more influence of extreme values compared to Kliethermes et al.'s10 sample size of 33 female runners. Discrepancies could also be a result of differences in leg length as these values were not normalized by participant height. Becker et al.8 also reported average values for variables reported in this study such as hip internal rotation and contralateral pelvic drop. However, they did not report results for only female runners, preventing comparison to the values in the current study.
The findings of this study observed no statistically significant differences between the running kinematic variables evaluated and RRI incurred by the female XC runners during the collegiate season. This finding was not consistent with Becker et al.,8 who found that greater contralateral pelvic drop was associated with increased likelihood of medial tibial stress syndrome in intercollegiate XC runners. The findings of Becker et al.8 were based on male and female runners, which may partially explain the differing results between the studies. In addition, their protocol for measuring kinematic variables differed from this study. While runners in their study ran at their own selected pace, they also completed a 5-minute warm-up and 10-minute running trial in which data were collected during the final minute. This longer testing protocol may have better approximated running conditions that increase a female collegiate runner’s odds of incurring an RRI. Conversely, in their prospective study of collegiate runners, Kliethermes et al.10 reported similar findings to this study in that no significant relationships were found between risk of bone stress RRI in female athletes and foot inclination angle, horizontal distance from center of mass to heel, and peak adduction during stance. However, they did report that a lower step rate and a greater center of mass excursion was significantly associated with an increased risk for sustaining a bone stress RRI. They also employed a different protocol with runners only completing a 2-minute walking warm-up before data collection at their preferred paces. Additionally, differences in sample size could have accounted for the discrepancy in results as they examined a larger sample size of 33 female runners compared to the 19 studied in this study. Athletes were also followed for 12 months rather than for only the cross-country season, which may have allowed for higher incidence as well as certain types of RRI.
This study’s findings also do not support previous research in recreational and high-school female runner populations where step rate, foot strike pattern, hip internal rotation, knee adduction, and knee flexion angle were found to be associated with multiple types of RRIs.14–17 While knee flexion at foot-strike, hip internal rotation at foot-strike, and foot-contact angle at foot strike trended toward statistical significance, this study’s small sample size likely contributed to the lack of significant findings. Decreased knee flexion at foot strike has been associated with poorer force absorption at the knee leading to RRI such at ITBS as described in recent literature.13–17 Increased hip internal rotation at foot-strike has also been described to be a moderate contributing factor to ITBS.14–18 A runner with decreased foot contact angle at foot-strike (e.g., mid to forefoot strike pattern) may be more susceptible to RRIs such as Achilles tendinopathy and calf muscle strains due to increased eccentric activity of the calf musculature. In contrast, increased foot contact angle at foot-strike (e.g., heel strike pattern) transmits greater axial forces through the lower extremities and has been associated with injuries such as Patellofemoral Pain Syndrome.14–17,19
Correlations Between Hip Abductor Strength and Running Kinematics
Few cross-sectional studies have observed the correlation between hip abductor muscle strength and running kinematics in female runners, and no reports are available regarding these relationships in female collegiate cross-country runners. Similar to this study’s findings, Baggaley et al.20 found no statistically significant relationships between hip abductor muscle strength and hip adduction during stance. Similarly, Brindle et al.21 examined a group of 60 female runners placed into tertiles based on peak adduction during stance and found no significant difference between the hip abductor muscle strength of the groups with largest and smallest angles. After separating a group of female runners into quartiles based on hip abductor muscle strength, Heinert et al.22 found that the runners in the bottom quartile had significantly more peak knee adduction at stance compared to those in the top quartile. While the results of the current study also found a significant correlation between knee adduction angle and hip abductor muscle strength; a relationship between left peak hip abduction strength to right knee adduction during stance and footstrike was also observed. Notably, the studies by Baggaley,20 Brindle,21 and Heinert22 examined female recreational runners rather than collegiate cross-country runners. Thus, differences in competitive levels among the runners in their studies compared to this study’s runners might partially affect differences of the relationships. Ford et al.23 examined the relationship between hip abductor muscle strength and hip drop in collegiate cross-country runners and found that strength was inversely correlated with pelvic obliquity, differing from the result of the current study results which no statistical significance was observed between the two variables. However, the participants studied by Ford et al.23 included both men and women and a separate analysis for the female group was not reported to show differences between these groups.
Strengths/Limitations
The primary strength of this study was the use of a prospective design, which minimized measurement and recall bias of hip muscle strength and running kinematic variables prior to RRI occurrence. In addition, this study reported values for several novel kinematic variables in the female collegiate XC population including knee flexion and adduction at footstrike and stance, tibial inclinational angle at footstrike, and maximum trunk flexion. Although none of these kinematic variables were found associated with RRI, they provide values for future study comparisons.
Several limitations should be noted. First, the small sample size due to the limited number of collegiate female runners who could participate decreased the power of this study and limited the ability to show statistically significant relationships between the observed intrinsic factors and RRI. Second, it is possible that some runners may have been experiencing symptoms related to a lower extremity RRI at the time of testing. Consequently, this may have partially affected the true relationship between the running biomechanical factors or hip muscle strength and likelihood of RRI. To minimize this occurrence, the authors reaffirmed with the runner that they had not or were not currently experiencing lower extremity RRI symptoms at the time of testing. Third, the data collected for injury occurrence during the season were based on self-report. Although measures were taken to ensure accuracy of reporting (such as anonymity of questionnaires and study personnel available for questions and clarification), some self-reported data may have been under- or misreported due to recall bias, misunderstanding of survey questions, or fear of judgment by coaches or other runners. Future studies should consider extracting records from a university’s Sports Medicine department in addition to using self-report to improve the accuracy of the injury type reported and decrease recall bias. Finally, as discussed previously, a key limitation in this area of research is that there is no standardization in the running biomechanical testing protocol for length of warm-up and assessment times in collegiate runners. The variance in these parameters may have contributed to the potential discrepancy in findings amongst current studies. Future research should establish a consensus on the proper testing protocol for this population.
Future Directions
With regards to hip abductor performance, future research should evaluate hip abductor muscle endurance in addition to peak strength. While hip abductor muscle endurance and hip isometric strength are closely related, a recent study suggested that hip abductor muscular endurance held a greater association with iliotibial band syndrome than did isometric strength in recreational runners.24 Finally, protocols for running kinematic collection should be developed to approximate intensity and duration conditions of a typical XC training session. Increased running intensity and running duration may reveal more kinematic correlations to RRI by inducing a more fatiguing environment.
CONCLUSIONS
Hip abduction muscle strength and asymmetries, and the studied kinematic variables were not associated with RRI in female collegiate XC runners. Future studies planning to assess hip muscle performance and running kinematic variables should use larger sample sizes to evaluate their relationships more appropriately to RRI. In addition, future studies should investigate the relationship between hip abductor muscle endurance and RRIs as well as develop a protocol with a longer running analysis session to better simulate a true training environment.
Conflicts of interest
The authors affirm that they have no financial affiliation (including research funding) or involvement with any commercial organization that has a direct financial interest in any matter included in this manuscript.