Introduction
Baseball injuries are a significant problem with increased incidence over the last decade.1–3 The greatest injury incidence is to the elbow and shoulder,1,4 with orthopaedic surgery signifying a significant proportion of injuries.5 These injuries have a substantial medical,6 financial,7 and psychological burden5 on the individual and team.8 Due to the significance of these injuries,6,7 individual physical risk factors have been recognized to assist clinicians in identifying baseball players at risk for arm injury.9–12 However, these methods are limited by their simplicity, without accounting for the complex interrelated nature of modifiable and non-modifiable relationship to baseball injuries.13,14
While identifying individuals at risk for injury can improve athlete injury outcomes,9 this does not give a complete clinical perspective. Reporting injury incidence only gives the rate but not injury severity or associated time loss.8 For example, the professional baseball shoulder and elbow injury incidence is 1.4 and 0.9 injuries per 1000 athlete exposures, respectively,15 but elbow injuries have over six times more days missed compared to shoulder injuries.16 Simply identifying baseball players at risk for injury would give equal weight to shoulder and elbow injuries and additionally would not distinguish between minor and severe injuries.8 Severity and site of injury will relate to the requirement for surgical interventions, including reconstruction, and hence time loss, highlighting the need to assess these parameters.17
Further, considerations must be given to the unbalanced nature of injury data, as the majority of athletes will report no injuries (i.e., no days lost), with a sparse number sustaining severe injuries, providing greater complexity to injury burden data.18 Pinpointing potential high injury burden athletes (pitchers) would allow for improved resource consolidation.8 Due to the continued rise in pitching injuries,1,2 and the incomplete clinical context of the identified injury risk factors,16 there is a need to distinguish pitchers at increased risk for greater comprehensive arm injury burden.
Pitching is a series of coordinated movements that involve the entire body.19 The interplay between modifiable and non-modifiable intrinsic and extrinsic factors in determining injury risk and burden signify the intricacies of this problem.13 The complex nature of pitching injuries require in depth examination, reasoning, and clinical decisions.20 However, while sports medicine clinicians have advanced skills and reasoning,21 there continues to be ambiguity in determining true risk.22 A more complex approach to identify at risk athletes has been proposed,23 involving the assessment of modifiable and non-modifiable factors as a whole.23–25 One method that incorporates this approach is via risk prediction models.26 Prediction models are statistical models that combine multiple predictors to estimate an individual’s risk of an event.27–29 These tools are not designed to supersede clinical experience and decisions; rather, assist in determining the best actions (or inaction) for patients.26 Prediction models have been used extensively in clinical medicine, such as whether to prescribe of cholesterol lowering therapies through the Framingham cardiovascular risk score.30
Quantifying complex systems through prediction models is needed to enumerate injury burden.24 These predictions can be used by clinicians and other healthcare professionals to better identify baseball players at risk for a high injury burden,31 and subsequently improve injury identification.32 Therefore, the purpose of this study was to 1) incorporate both modifiable and non-modifiable factors to develop an arm injury burden prediction model in Minor League Baseball (MiLB) pitchers; and 2) understand how the model performs separately on elbow and shoulder injury burden.
Materials and Methods
Study Design
A prospective longitudinal study was conducted from 2013 to 2019 on MiLB pitchers in one Major League Baseball (MLB) organization. Prior to testing, the risk and benefits of participation were explained in verbal and written form to all participants. Participants were tested at the beginning of spring training (pre-season). All test administrators were blinded to hand dominance.33 Participants were tested for shoulder range of motion (ROM) and humeral torsion (HT). Following testing, participants were followed for the entire season for total athletic exposures and arm injuries. Each pitcher was incorporated into each individual season. If a pitcher played multiple seasons, each season was an individual observation. If a pitcher sustained an injury, the pitcher was no longer included in observation for the next season. All participant information was de-identified and coded into an encrypted centralized database. This investigation received favorable ethics approval from the University Institutional Review Board.
Patient Public Involvement
Sports medicine clinicians, performance professionals, and coaches within the organization were included in determining the variables to be collected. Presentations were performed for organizational stakeholders throughout data collection and prediction model development.
Participants
Participants were included if they were able to participate in all practices and competitions and were under a MiLB contract. Participants were excluded if they were currently injured or not participating in all spring training activities, participating in MLB spring training at time of data collection, or signed a professional contract in the middle of the season (e.g., draft, free agent, or international signing).9
Shoulder Range of Motion and Humeral Torsion
Shoulder external (ER), internal (IR), horizontal adduction (HA) range of motion (ROM) was measured using previously described methods.34–37 Internal reliability testing demonstrated excellent reliability for shoulder ER (intraclass correlation coefficient (ICC) (2,1) =0.99; Standard error of measure (SEM) = 2.0; ICC (2,K) = 0.99; SEM= 0.95), IR (ICC (2,1)= 0.97; SEM = 2.5; ICC (2,K) = 0.97 SEM= 2.6), and HA (ICC (2,1) = 0.99; SEM =2.59; ICC (2,K) =0.97; SEM = 1.2). Shoulder ER and IR were summed to measure shoulder total ROM (TROM). Humeral torsion (HT) were measured with a 5-MHz transducer (Sonosite Inc., Bothell, WA, USA) with previously described methods.10 HT testing demonstrated excellent reliability (ICC (2,1) = 0.97; SEM = 2.5; ICC (2,K) = 0.97 SEM= 2.6). Two data collection trials were performed per shoulder and the data collection trials were averaged for analyses.38 For further explanation of the methods, please refer to the Appendix 1.
Exposure
Baseball (i.e., athlete) exposure was defined as number of days participating in training, practice, or games in a season.39 Pitching exposure was defined as the total number of pitches within a season.39
Outcome Definition
An injury was defined as an injury to a tendon, ligament, nerve, muscle, or bone that occurred during any baseball team sponsored activity or event and was followed by at least one day of missed practice or baseball games.33 If a player was unavailable to play for injury prevention reasons (i.e., has reached league or individually determined pitch or innings count limits), then their absence was not considered as an injury. Injuries were defined by the Orchard Sports Injury Classification system and arms injuries stratified by shoulder/clavicle, upper arm, elbow, and forearm.40 All other injuries and illness were also recorded, and time loss was not taken into account for overall exposure, nor included in the injury burden analyses. Arm injury burden was defined as the product of incidence and severity.8 Arm injury burden was quantified as the total number of days lost to arm injury in one baseball season.8
Residual inspection demonstrated model instability above 90 days lost to arm injury. Following research team and MLB organizational discussion, time loss to arm injury was truncated to 90 days. In other words, if a player sustained an injury of 120 days, within the model, this would be included at 90 days.
Statistical Analyses
All data were investigated for missingness prior to analyses using the R package naniar. Missing data was low (3% of entire cohort had one or more missing values), thus complete case analyses were performed. Participant characteristics were described using mean (standard deviation) for continuous normally distributed variables, median (interquartile range) for non-normally distributed continuous variables, and frequencies and percentages for categorical variables. Arm injury incidence was calculated by sum of arm injuries divided by sum of baseball (i.e., athlete) exposures (AE) multiplied by 1000. For expanded statistical analyses description, please refer to Appendix 2.
Linearity was not assumed, and prior to model development, continuous variables were assessed for non-linearity in relation to the outcome of days lost to arm injury. All predictors were observed to have linear relationships.
Sample Size Calculation
An a priori sample size calculation was performed prior to model development.41 It should be noted that this sample size method does not explicitly cover zero inflated models. During the study period, a total of 297 pitchers met inclusion criteria, therefore a maximum of 26 parameters (i.e., the number of degrees of freedom) could be included in the development of the injury burden prediction model. The R package pmsampsize was used to calculate the required sample size.
Model Development: Primary Analysis
To predict the number of days lost (up to 90 days) to arm injury in professional pitchers a zero inflated negative binomial regression model was utilized.42 An alternative model, a hurdle model was developed, to demonstrate similar prediction performance (Appendix 3). Predictor variables included were chosen based on the baseball injury prevention literature and included: 1) age, 2) BMI, 3) pitching role (starter versus reliever), 4) seasonal number of pitches, 5) number of pitching appearances in a season, 6) HT difference between dominant and nondominant shoulder (in degrees), 7) dominant shoulder TROM (in degrees), 8) dominant HA (in degrees), 9) lower extremity or trunk injury in the same year, 10) any previous arm injury history, 11) years played professionally, 12) received individualized injury prevention programs, 13) continent of origin, and 14) days practiced and competed in the season (exposure).9,43–52 Variable selection was performed using elastic net penalization, using ten-fold cross-validation.53 Internal validation of the model was performed using ten-fold cross validation.53 Prediction model performance was assessed by calculating the root mean square error (RMSE), explained variation (R2), and calibration. Calibration is the agreement between predicted and actual risk.32 Calibration was assessed by calculating the calibration slope with 95% confidence intervals and graphically plotting the observed values against the predicted values. Subgroup analyses were performed for elbow and shoulder separately. A sensitivity analysis was performed with the inclusion of only modifiable predictors to assist clinicians in understanding risk and treatment options including: (1) seasonal number of pitches, 2) number of pitching appearances in a season, 3) dominant shoulder TROM (in degrees), 4) dominant HA (in degrees), 5) received individualized injury prevention programs, 6) days practiced and competed in the season (exposure). All analyses were performed in R version 3.5.1 (R Core Team (2013). The R package pscl was used for zero inflation modelling and mpath for elastic net. For full code, please see Appendix 4.
Reporting of this study followed the transparent reporting of a multivariable prediction model for individual prognosis or diagnosis (TRIPOD) recommendations.54
Results
Participant Characteristics
A total of 297 pitchers were included (age: 23.0 (2.2) years, BMI: 24.8 (2.2), left handed: 21%). A total of 84 pitchers reported an arm injury during data collection. Overall arm injury incidence was 1.15 arm injuries per 1000 AE’s, 0.5 elbow injuries per 1,000 AE’s, and 0.8 shoulder injuries per 1,000 AE’s (Table 1). Median days lost to an arm injury was 58 (11, 106).
Arm Injury Burden Prediction Model
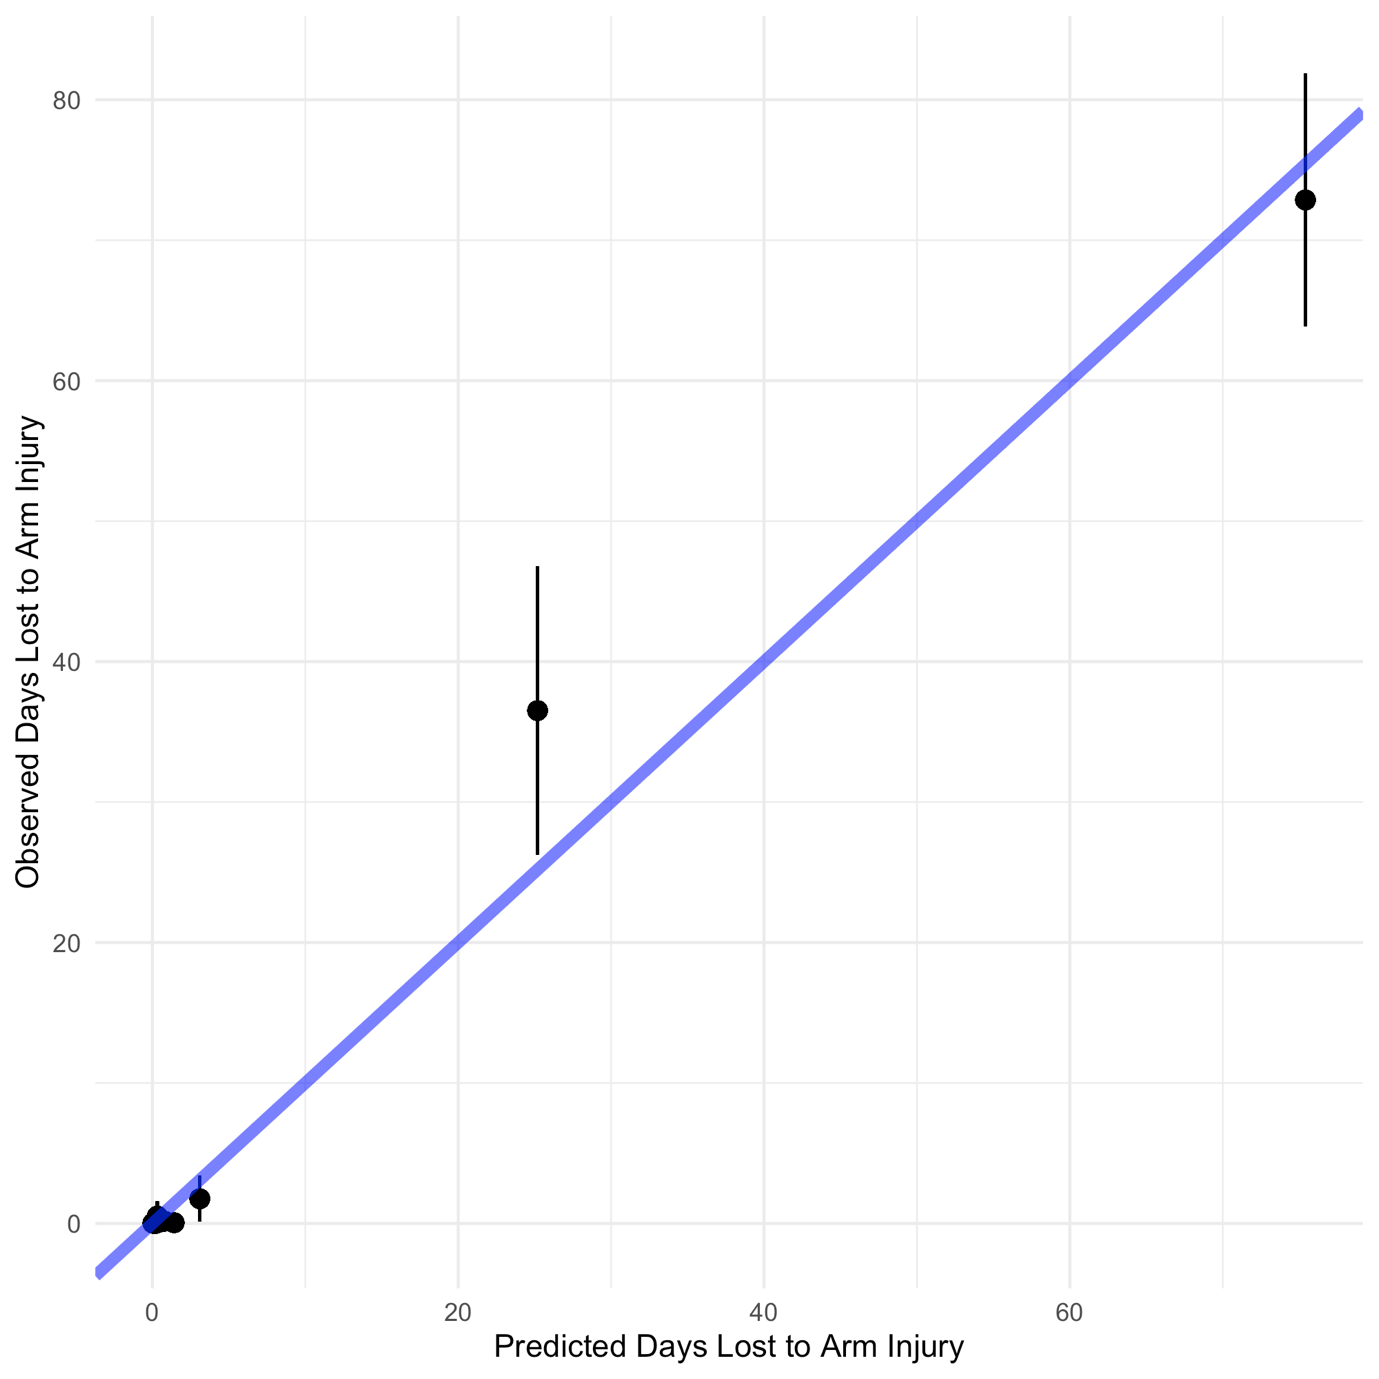
Model development following tenfold internal validation demonstrated a RMSE of 11.9 days, 0.80 R2, and a calibration slope of 0.98 (95% CI: 0.92, 1.04); Figure 1). Full model equation is reported in Table 2.

The zero-inflated negative binomial model incorporates two models (count and zero) into one comprehensive model. As such, the count and zero model should be considered one model
Elbow Injury Burden Prediction Model
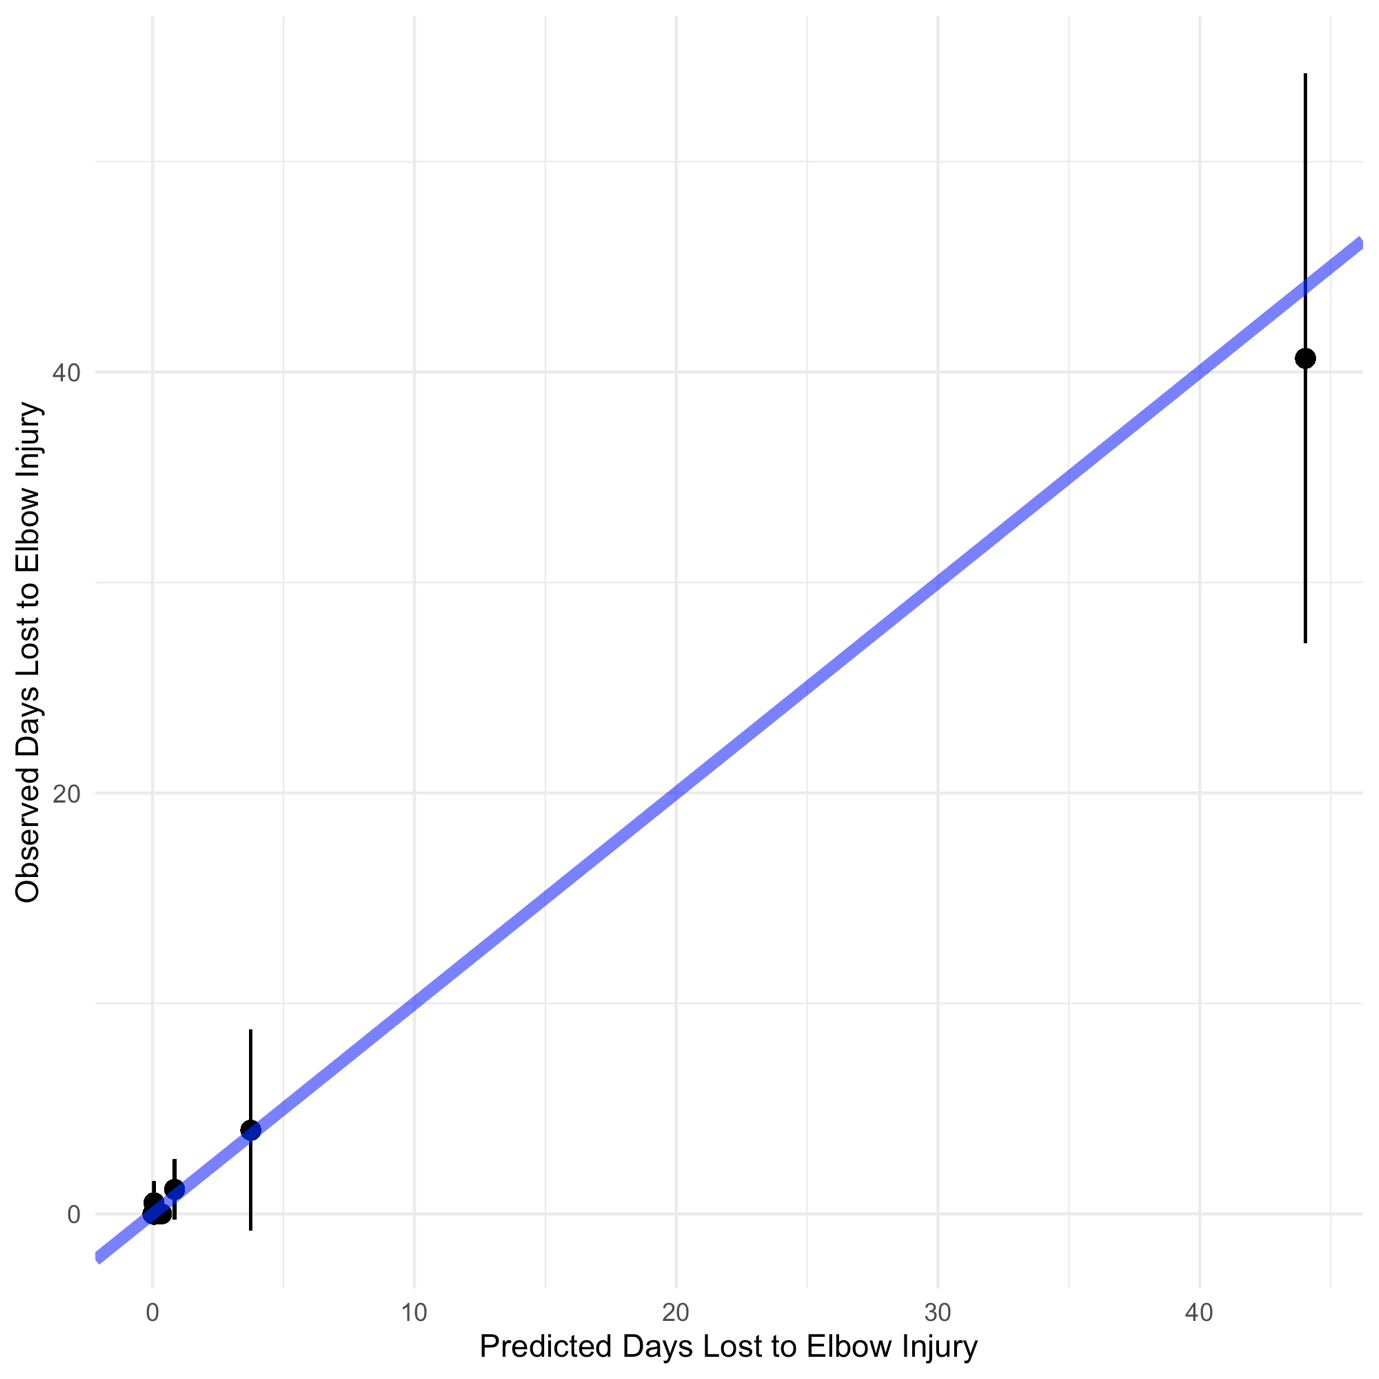
Elbow injury burden model development demonstrated a RMSE of 21.3 days, 0.42 R2, and a calibration slope of 1.25 (95% CI: 1.16, 1.34; Figure 2).

Shoulder Injury Burden Prediction Model
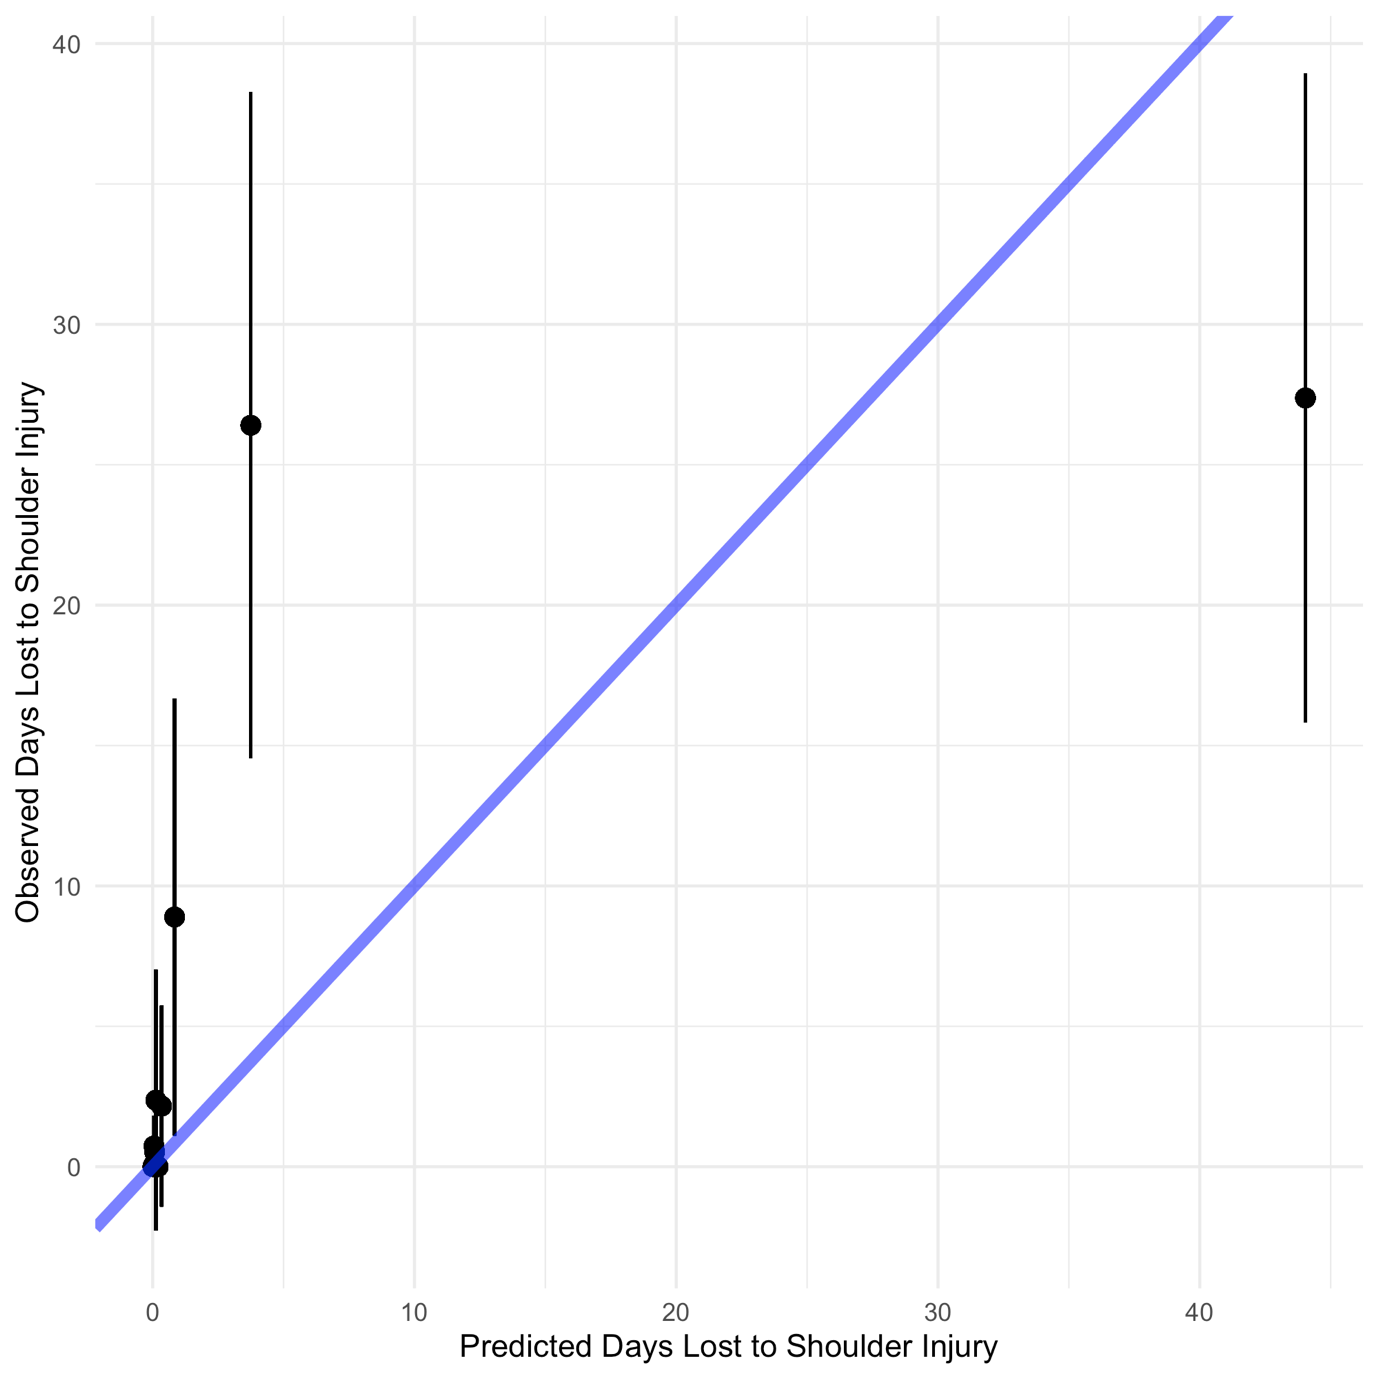
Shoulder injury burden model development demonstrated a RMSE of 17.9 days, 0.57 R2, and a calibration slope of 1.01 (95% CI: 0.92, 1.10; Figure 3).

Sensitivity Analysis
The inclusion of only modifiable predictors within the prediction model decreased performance compared to the original model (RMSE: 21.2, R2: 0.42, Calibration: 1.12 (95% CI: 0.99, 1.25).
Discussion
Summary
This prediction model demonstrated excellent performance, as demonstrated by the high R2 and calibration slope. Due to the model error of 12 days, predictions of one to 14 days should be interpreted with caution. Stratifying by predicting individual elbow or shoulder burden decreased prediction model performance. Including only modifiable predictors demonstrated decreased prediction performance.
Clinical Implications
Clinicians integrate a plethora of skills, tools, and experience to keep athletes on the field.55 The complexity associated with examination and performance, including advances in technology,56 load monitoring,57 and rehabilitation and performance testing,23 necessitates the need employ these tools and information. Within baseball, athletes are physically examined in spring training and traditionally this information is used to assess each individual risk factor.9 This prediction model incorporated multiple predictors into one cohesive model to calculate a predicted number of days lost to arm injury, ranging from 0 to 90. These individual injury burden predictions are meant to help reduce complexity of a difficult issue through clarifying prognosis,58 to improve a clinician’s ability to care for their patients.
This model reported an RMSE of 12 days. What this means clinically is that for any predicted days of injury burden, the actual number of days lost to injury will be within 12 days of the predicted value. While an error rate of 12 days for higher burden injuries (i.e., >30 days) may not alter clinical interpretation, a difference between 0 and 14 days could affect clinical decisions. To give an example, if the model predicted 3 days lost to injury, the days lost could be between one and 15 days. This would be clinically interpreted as a minor to moderate arm injury. On the other hand, if a pitcher was predicted to have 60 days lost to injury, a 12 day difference (48 to 72 days) would not affect clinical decisions. The pitcher would still be identified as a pitcher who could sustain a serious arm injury during the season. These findings suggest that this injury burden model can help identify pitchers who are at risk for sustaining a high injury burden during the season. However, these models should be interpreted with caution for predicted injury burden for one to 14 days.
Individual Elbow and Shoulder Models
Elbow and shoulder injury burden models demonstrated decreased performance compared to the primary model and had reduced sample sizes therefore, should be interpreted with caution. The discrepancies between elbow and shoulder injury burden may decrease the performance of these models. Elbow and shoulder injuries can have different risk factors,9,10,59 with mechanisms of injury occurring during different points within the pitching motion.19,60 Different clinical interventions may be required to reduce shoulder verses elbow injury risk.61,62 The contrasting injury burden risk factors between shoulders and elbows may decrease the prediction precision of individual shoulder or elbow models. Future research is required to develop separate shoulder and elbow burden prediction models.
Inclusion of Only Modifiable Predictors
Including only modifiable predictors demonstrated decreased injury burden prediction compared to the inclusion of modifiable and non-modifiable predictors. Previous work14 has called for the inclusion of both modifiable and non-modifiable predictors to improve understanding and ultimately decrease sports injuries. However, while this has been proposed for many years,14 the majority of current evidence only includes isolated modifiable factors when assessing injury risk.9 As these results suggest, without the inclusion of non-modifiable predictors, clinicians are inhibited from having an improved understanding of current injury risk. While it may seem from a clinical perspective that including non-modifiable predictors does not improve how a clinician will treat a patient, a more comprehensive injury risk examination allows the clinician to better identify athletes at risk for sustaining an injury.63 These prediction models are not recommended to be used to identify which specific interventions or factors should be the focus of care.28,29 Prediction models are not causal, as such, if a particular predictor is “significant” with a specific athlete, this does not mean that particular predictor should be intervened upon. A thorough physical exam and clinical reasoning should be used to identify which tests and measures to intervene on.
Strengths and Potential Limitations
This study utilized a seven-year prospective cohort that was specifically designed to assess arm injuries in professional baseball players. All data collectors were physical therapists, specifically trained and evaluated for reliability in the physical examination techniques, improving the consistency and reliability of these data. Only a small proportion of data were missing, allowing for a complete case analysis, increasing the validity of these findings. An a priori sample size calculation was performed to create a stable prediction model, increasing the utility of these findings. Internal validation was performed in order to shrink optimism, increasing the generalizability of these results. The full model is reported, increasing transparency and usefulness for future validation.64 Time lost to injury was truncated at 90 days. Pitchers may be placed on the injured list longer than 90 days; however, truncation was performed at 90 days due to the paucity of players sustaining time loss greater than this time period and the organizational significance of this time period. A small proportion of pitchers were excluded due to participating MLB spring training during data collection. These pitchers were predominantly at the AAA or AA level, decreasing the generalizability of these results to high MiLB players. Injury history was limited to professional baseball seasons and orthopaedic surgery prior to signing a professional baseball contract. As pitchers may sustain arm injuries that last only a few days or a week, there is the potential for residual confounding. All impairment data were collected prior to the season. As predictors can change throughout the season, this decreases the clinical utility of these results. Player salary and signing bonuses were not included in these analyses. As MLB organizational investment may influence time loss to injury, this decreases the precision in these models. This model was not externally validated. It is recommended that external validation should be performed prior to integrating in a clinical setting. This prediction model should be used with caution without further validation.
Conclusions
This professional baseball injury burden model may have clinical utility in predicting pitchers that are at risk for sustaining a high injury burden within the season. However, caution should be advised with predictions between 1 to 14 days lost to arm injury as this is below the prescribed model error. The inclusion of modifiable and non-modifiable predictors demonstrated improved prediction performance, suggesting that prediction models should include both types of predictors when evaluating injury risk. Separate elbow and shoulder prediction models demonstrated decreased performance and should be interpreted with caution due to low sample size. Further research is required to externally validate this model to understand the generalizability of these findings.
Funding
GSC was supported by the NIHR Biomedical Research Centre, Oxford, and Cancer Research UK (programme grant: C49297/A27294).
Conflicts of Interest
All authors declare no conflicts of interest.