INTRODUCTION
The Canada Games, which are the highest level of national competition for Canadian athletes, were first held in 1969 and occur every two years, alternating between Summer and Winter games.1 Participation in elite level competitions, such as the Canada Games, encourages large scale participation in multiple sports over the course of a set time period. While athletic participation of this magnitude and level is desirable for many athletes, there are inherent risks of injury for participants. Following the Sequence of Prevention model, in order to prevent injuries, researchers must first identify and describe the injury problem(s).2
To better understand the injury problem, surveys were first conducted during international sports competition in 2004 and included injury data from the Olympic Games and International Federation of Association Football tournaments held between 1998-2001.3 Injury surveillance programs are now used widely at the organizational level4–6; while numerous studies of injury/illness incidences are reported at both the national level7–9 and international3,10–13 levels of competition. Epidemiological assessments of sport injury can provide direction for injury prevention programs and, when assessed over multiple years, provide insight on how injury patterns/frequencies may change over time. Based on epidemiological data, it has been suggested that athletes participating in athletics should have preventative injury intervention focused on overuse injuries, proper rehabilitation of previous injuries, and be sex specific.10,14,15
Researchers have reported differences in injury incidence and risk of injury between male and female athletes in international track and field competitions16 and in collegiate athletes17,18; however, incidence proportions were similar between male and female international athletics championships.19 To date, one recent study successfully implemented an injury surveillance protocol in Canadian varsity athletes.20 However, there is a paucity of literature regarding injury and illness incidence during the Canada Games with only one study reporting dental injuries during a single Canada Games competition held over 30 years ago.21 Therefore, the primary purpose of this study was to analyze the incidence and characteristics of injuries and illnesses during Canada Games competitions from 2009-2019. The secondary purpose of this study was to understand sex differences in odds of musculoskeletal injuries for Summer and Winter Canada Games athletes.
METHODS
Study Design
This research utilized a retrospective cohort for a descriptive epidemiological design to assess injury and illness patterns in 10 years of Canada Games participants.
Participants
From 2009 – 2019, 17101 (8710 male; 8391 female) athletes participated in Canada Games competitions held in various cities across Canada. 10169 (5457 male; 4712 female) athletes competed in the Summer Canada Games, which were held in the years 2009, 2013, and 2017 and 6932 (3253 male; 3679 female) athletes competed in Winter Canada Games, which were held in the years 2011, 2015, and 2019. Athletes completed a consent for treatment form; a release for Canada Games to use anonymous medical information was acquired starting in 2015.
Procedures
Following ethics approval for Secondary Analysis of Data through Brock University Research Ethics Board, data were abstracted and de-identified by the Canada Games Council for any individual seeking medical attention during their participation in the Canada Games. Medical attention/encounters were recorded in an electronic medical record (EMR) by various clinicians (i.e., athletic therapist, physiotherapist, chiropractor, physician) working with Canada Games events. Medical attention was defined as assessment of a participant’s medical condition by a qualified medical/healthcare practitioner.22 Abstracted data, for those seeking medical attention, included the following: subjective information on injury, objective information on injury, injury assessment, type of injury, injury diagnosis, further treatment of injury, action taken, place of treatment, and incident status, as well as participant sex, contingent (province), sport, chief complaint, and assessment date. Data were inclusive of Canada Games from 2009 and 2019. For this study, only the first report of an injury/illness were recorded from the medical incident report. There were reports for follow up (linked through incident numbers), but follow ups were not counted as a new injury. In some instances, there was a medical incident that was linked to an earlier incident report but had an additional or new injury in the follow up incident report. In this case both the initial injury as well as the additional (new) injury reported were included for this analysis.
Using initial and follow up medical incident reports from Canada Games, data were organized based on the International Olympic Committee Injury Surveillance System for categorizing affected injury location, injury type, and illness affected system (Table 1).12 Given the data set and the way injuries were reported within the Canada Games EMR, there were three additional injury type categories included beyond those from the International Olympic Committee Injury Surveillance System; these included patellofemoral pain syndrome (PFPS), compartment syndrome, and postural. Injuries were also categorized as acute or overuse (Table 1). Acute sports injury was defined as “loss or abnormality of bodily structure or functioning resulting from an isolated exposure to physical energy during sports training or competition that following examination is diagnosed by a clinical professional as a medically recognized injury”.23 Overuse sports injury was defined as: “loss or abnormality of bodily structure or functioning resulting from repeated bouts of physical load without adequate recovery periods in association with sports training or competition that following examination is diagnosed by a clinical professional as a medically recognized disease or syndrome”.23 Illness was defined as “a physical or psychological complaint or manifestation by an athlete not related to injury, regardless of whether it received medical attention or its consequences with respect to impairments in connection with competition or training”.10,11 In addition to the categories of affected system as classified by the International Olympic Committee Injury Surveillance System, we also added a standalone category for cardiovascular and used symptom clusters to identify affected illness system based on the 2020 International Olympic Committee Consensus Statement (Table 1).24
Statistical Methods
Following data categorization, participants were separated male and female by sport to determine injury and illness frequency, incidence, and odds of injury and illness, with 95% confidence intervals, for male and female athletes across and between sports. Frequency of injury/illness types and locations were calculated as percentages. Injury/illness incidence was calculated as the total number of injuries/illnesses per 1000 registered athletes using registration numbers (numbers of athletes registered for competition per sport) provided by Canada Games Council. Incidence was calculated by first determining the total number of injuries/illnesses reported in all male and female athletes as well as separating out the total numbers of injuries/illnesses reported based on sport and sex. Once injury/illness totals were counted, the registration numbers were used to calculate incidence of injury in all athletes, male athletes, female athletes, and further subdivided to calculate incidence of injury in male or female athletes based on sport. Registration numbers were divided by 1000 to indicate the total number of participants per 1000. Consistent with previous research,12,13 incidence was then calculated as the total number of injuries/illnesses divided by the total number of athletes registered for competition in each sport (using the equation below).
Number of Injuries or Illnesses[Registration Number/1000]
Odds ratios (from 2 x 2 contingency tables) were calculated to determine odds of injury/illness between male and female athletes and when comparing between similar sports. Additionally, 95% confidence intervals (95% CIs) were calculated to determine precision. Data were analyzed in Excel; the 95% CI (interval exclusion of null of 1.0) was used to indicate statistical significance in odds of injuries/illnesses between males and females competing in Canada Games. MedCalc (https://www.medcalc.org/; v.20.113) was used to determine statistically significant differences (p < 0.05) in incidence of injury/illness (overall and in Summer vs. Winter Games) between male and females athletes competing in Canada Games.
RESULTS
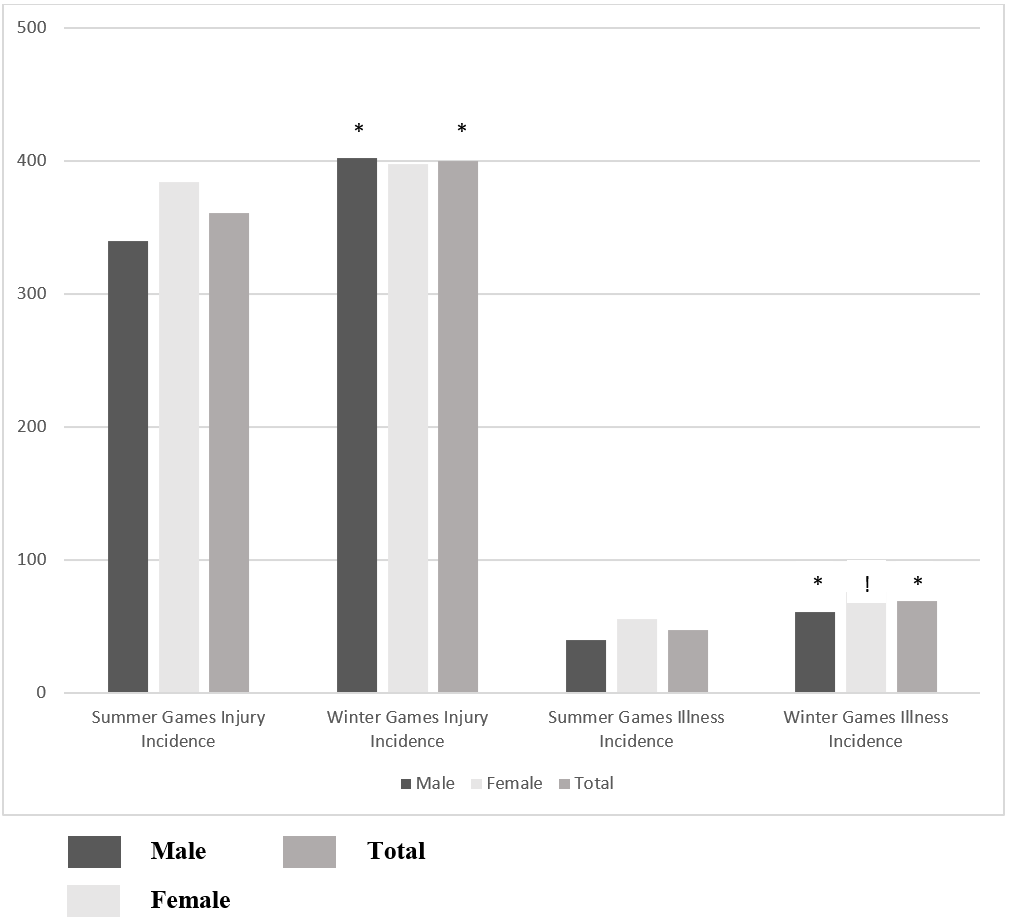
Across all 10 years of Canada games, 3160 injuries reported in 8710 male athletes (n = 5457 in Summer Games; 3253 in Winter Games) and 3272 injuries reported in 8391 female athletes (n = 4712 in Summer Games; 3679 in Winter Games). Injury incidence was 362.8 and 389.9 (p = 0.004) and illness incidence was 47.8 and 64.5 (p< 0.001) per 1000 male and female athletes, respectively. Injuries to the shoulder (Table 2) and muscle strains (Table 3) were the most common regardless of sex.
The respiratory system was most often affected illness system for male and female athletes (Table 4). Female, compared to male, athletes had a 1.12 (95% CI: 1.06; 1.19) significantly greater odds of injury and 1.37 (95% CI: 1.20; 1.57) significantly greater odds of illness.
Assessing Summer and Winter Canada Games competitions separately, the overall injury and illness incidences were significantly higher in Winter, compared to Summer, Canada Games when all athletes were combined and in male athletes (Figure 1). Overall incidence of illness was significantly higher in females competing in Winter compared to Summer Games; however, there was no difference in overall incidence of injuries in females competing in Winter compared to Summer Games (Figure 1).

Female freestyle skiing participants had the highest injury incidence while female target shooting participants had the highest illness incidence (Tables 5 and 6). Female athletes competing in softball, canoe-kayak, rowing, sailing, swimming, tennis, triathlon, fencing, alpine skiing, biathlon, judo, snowboarding, and wheelchair basketball had a significantly increased odds of injury compared to males competing in similar sports (Tables 5 and 6). Female athletes competing in athletics, softball, soccer, and speed skating had a significantly increased odds of illness compared to males competing in similar sports; while females competing in diving had a significantly decreased odds of illness compared to male participants (Tables 5 and 6).
Strains were most common across all athletes in Summer and Winter games (Table 7); thigh and shoulder were the most frequently injured in male Summer and Winter participants, respectively; shoulder was most frequent in female Summer and Winter participants (Table 7). Male Summer and Winter participants reported more acute injuries; female Summer and Winter participants reported more chronic injuries (Table 7). In Summer Games, participants reported highest illness in other category (urogenital, gynaecological, neurological, psychiatric) (Table 7) and in Winter games respiratory system was most often affected system for illness (Table 7).
DISCUSSION
The purpose of this study was to analyze the incidence and characteristics of injuries and illnesses during Canada Games competitions from 2009-2019 and to understand sex differences in odds of musculoskeletal injury for Summer and Winter Canada Games athletes. The Canada Games occur every two years and alternate between Summer and Winter Games. Overall, there were similarities in types of injuries and illnesses as well as area of the body commonly injured, however; incidence and odds of injury and illness differed between male and female athletes.
Injury Types, Involved Body Areas, and Affected Systems
When considering all 10 years of Canada Games competitions, strains, sprains, and contusions/hematomas/bruises were most common; demonstrating that approximately 70% of all injuries during 10 years of Canada Games competitions were of one of three injury type categories. These findings are similar to those reported in the 2008 and 2010 Olympic Games with contusions (26 – 46%), sprains (11 – 20%), and strains (8 – 16%) being most common.12,13,25 Overall, the shoulder was the most commonly injured body area in all participants. However, when considering injured body area in male and female participants in Summer and Winter Canada Games separately, the thigh was most commonly injured in male participants in Summer Games. Previous findings suggest that male athletes sustained significantly more injuries to the thigh region (Relative Risk [RR]= 1.64; 95% CI 1.32; 2.05) with a 1.66 (95% CI 1.25; 2.19) increased risk of thigh strains compared to female participants during International Athletics Competitions.16 Although the measure of RR is different from the odds ratios presented in this current study, both measures are used to describe an association between a variable and an outcome. However, there are distinct differences between measuring RR and OR. Relative risk assesses the probability of an injury occurring and requires participants at risk to consider the frequency of a risk while OR primarily consider the rate of injury.26,27 In a retrospective design, which was used in this current study, because the total number of participants at risk is not known, RR cannot be calculated. Therefore, OR were used in this current study to measure the strength of association between variables (males and females or Summer and Winter Games) and the outcomes of interest (injury types, locations, etc.).
When considering male and female participants across all 10 years of Canada Games competitions, in addition to the shoulder and thigh, the ankle and knee were the also commonly injured body areas. These findings are more consistent with previous literature suggesting that lower extremity injuries occur most commonly (at least half of all injuries) as reported in previous Olympic competitions,12,13,25 in Olympic athletes on the British World Class Performance Programme,28 and Youth Olympic Games.29 Additionally, across all 10 years of Canada Games competitions as well as when comparing specifically between Summer and Winter Canada Games, males had more acute injuries while females had more chronic injuries. These findings are directly in line with previous reports from a Division I collegiate institution in the United States indicating female athletes had a greater rate of chronic injuries per 10000 athlete exposures (AEs) across three years of competition while males athletes had a higher rate of acute injuries per 10000 AEs in the same time frame.18 Perhaps these combined findings suggest a need to investigate mitigating risk of injury differently between male and female athletes with greater focus on prevention of chronic injury in female and acute injury in males.
Across all 10 years of Canada Games competitions, the respiratory system was the most often affected system in illness while the category of ‘other’ was the second most affected system. Together these two systems represented more than 50% of all illness in both male and female participants. This is consistent with previous literature indicating the respiratory system was the most commonly reported system affected (19 - 62% of all reported illnesses) in Summer and Winter Olympics, International Athletics Competitions, Rugby, and Youth Olympic Games.11,12,19,29–31 Risk factors for respiratory illness can include stress (mechanical/dehydration) to the airway as well as airborne pollutants, irritants, and allergens that can be inhaled by the athlete during exercise.32 Given the demands of sport there are inherent stresses to the respiratory system that may be further exacerbated by air quality, which cannot be prevented.
Incidence and Odds of Injury and Illness
Injury incidence was higher in female, compared to male, athletes across all 10 years of Canada Games competitions. When considering differences specific to participation in Summer versus Winter Canada Games, incidence of injury was higher in Winter than Summer Games across all athletes. When looking at participation in specific sports, female athletes had a higher incidence of injury, per 1000 athletes, in the majority of Summer and Winter Canada Games sports. Interestingly, incidence of injury was nearly identical between in females competing in Summer and Winter Games, while males competing in Winter Games had higher incidence of injury than males competing in Summer Games. This may suggest more consistency in female athlete’s reporting of injury across all Games.
Similar to injury incidence reports from the 2008 Summer Olympic Games,13 the lowest overall incidence of injury per 1000 Summer Canada Games participants in swimming, canoe-kayak, and sailing. In Winter Canada Games, the highest overall incidence of injury per 1000 athletes was observed in freestyle skiing and women’s snowboarding. These findings are similar to those reported from the 2010 and 2014 Winter Olympic Games with alpine skiing and snowboarding having high injury risk12 and injury incidence.30 Additionally, similar to the current findings, incidence of injury (per 1000 athletes) was lowest in men’s archery, previous research suggests low injury rates or incidences in archery and table tennis during Olympic competition.11,13 Collectively, these Canada Games injury incidence findings are in support of suggestions that sports with jumping, cutting, sprinting, and pivoting have higher risk of injury.33
Female athletes had a significantly increased odds of injury when combining all athletes together; however, odds of injury varied when also considering specific sport participation. In Canada Winter Games, female alpine skiers had a 2.6 greater odds of injury compared to male alpine skiers. There are limited reports of differences in odds of injury between male and female athletes competing in high levels of competition; one study reported findings similar to ours suggesting that female athletes competing in slopestyle skiing were at greater risk of injury compared to male athletes (RR=3.00; 95% CI: 1.04; 8.63).30 Additionally, female fencers had 22 times greater odds of injury compared to their male counterparts. It has been previously reported that male fencers have higher relative risk (RR=1.42, 95% CI 1.05 to 1.94) of time loss injury compared to female fencers34; perhaps the difference in our findings from those previously reported are that we included all injuries rather than only those that resulted in time loss. It has been suggested that as much as 90% of overuse injuries may be missed when using time loss in defining injury.35 The normalization of continuing to participate at all costs, even when injured,36 can limit the understanding of injury epidemiology in large scale events such as Canada Games if injury definitions only include time loss injuries. Further, injuries sustained in sport can impact both preparation for, and performance in, future sport participation.37 Therefore, previous literature has advocated for the use of more inclusive injury definitions.38
Similar to injury incidence, illness incidence was higher in female, compared to male, athletes across all 10 years of Canada Games competitions. This is similar to the reports that women competing in the 2010 Vancouver, 2012 London, and 2014 Sochi Olympics had higher reports of illnesses compared to male athletes.11,12,30 Previous literature has indicated female athletes had 1.5 times greater relative risk for developing an illness compared to male athletes.30 When considering differences specific to participation in Summer versus Winter Canada Games, incidence of illness was higher in Winter than Summer Games. This may not be surprising given that exposure to cold during winter months increases the risk of developing respiratory illness, which may be due to vasoconstriction in the respiratory tract mucosa and suppression of immune responses that occur with inhaling cold air.39
It is important to acknowledge that boxing and rugby had only male participants while synchronized swimming and ringette had only female participants. Both fencing and golf had no illnesses reported by male participants during any years of Canada Games so a comparison could not be directly assessed between male and female illness incidence or odds; to the researcher’s knowledge this does not represent an error in reporting but rather a lack of illness being reported by any member of these teams. Further, rugby and fencing were only included in Canada Games competitions in only 2009 and 2013 respectively; therefore, for each of these sports, only one year of data are available. Finally, exposure and time loss data were not collected, therefore incidence rate cannot be calculated, and the incidence of injury/illness data cannot be dichotomized into time loss vs. no time loss. To give a frame of reference to the number of injuries/illnesses, we used athlete registration numbers to report incidence per 1000 athletes registered for competition. These are limitations to the data set as well as the retrospective design of the secondary analysis of data; however, this is the first report of the epidemiology of injury and illness during Canada Games and therefore provides an understanding to the differences that exist in male and female athletes competing in Canada Games competitions.
CONCLUSION
Although injured body area and type of injury were similar between males and females competing in Canada Games, female athletes had a significantly greater overall odds of both injury and illness. Differences exist in injuries and illnesses between Summer and Winter Canada Games and between male and female participants in like sports. Given these differences, there may be an interest in future exploration of modifiable risk factors as this may help to clinicians to target strategies to reduce injuries that occur during Canada Games competitions.
Conflict of Interest Disclosure
Chimera – Brock University Canada Games Grant provided support for hiring a research assistant and for conference registration fees
Merasty – paid research assistant through Chimera’s Brock University Canada Games Grant funding
Lininger - none
Acknowledgements
The authors wish to thank and Canada Games Council for providing de-identified data for this analysis. This work was supported by a Brock University Canada Games Grant.