INTRODUCTION
Anterior cruciate ligament (ACL) injury is common in athletes, and it is often followed by ACL reconstructions (ACLR). An ACLR is followed by an extensive rehabilitation period and one of the most important rehabilitation goals is to reach symmetric function and strength in the lower limbs.1,2 Limb asymmetry in strength and function after ACLR can predict an increased risk of reinjury, which in turn increases the risk of early post-traumatic knee osteoarthritis.3–6 Further, knee extensor muscle weakness has also been suggested to be associated with an increased risk of knee osteoarthritis development and progression.7,8 Thus, the results of limb symmetry tests are of great importance for clinicians in determining if a patient is fully rehabilitated or ready to return to sport (RTS). Limb symmetry index (LSI) is calculated by dividing the test scores of the injured limb with the uninjured limb multiplied by 100. LSI is typically used to calculate the level of symmetry between the two legs. A LSI >90% is considered satisfactory and is often a criterion before letting a patient RTS.9,10
There are a number of functional tests that can be conducted to assess limb symmetry after ACLR. Hop tests, one of the most commonly used functional tests, assess differences in various hopping tasks between the injured and uninjured leg.11,12 However, LSI measured with hop tests can be overestimated. Barford et al. confirmed this by determining that satisfactory LSI was reached significantly faster with hop tests than with knee extensor muscle symmetry tests.13 In another study Nagai et al. suggest that muscle strength tests are a better method to evaluate LSI after ACLR since hop tests often result in higher LSI values compared to leg press tests and isokinetic muscle strength tests.14
To assess LSI in muscle strength, different measurement instruments can be used. Hand-held dynamometers (HHD) and isokinetic dynamometers (IKD) are commonly used. IKDs are advanced computerized machines measuring isokinetic muscle torque (as a proxy for strength) and HHDs are small portable devices used to measure isometric muscle torque (also as a proxy for strength).15,16
IKDs are considered superior compared to other instruments to assess muscle strength, however they are both space-consuming and expensive, therefore are not very common in clinics. HHDs, on the other hand are cost-effective, small, and clinically applicable. Previous authors have established the reliability and validity of IKDs and HHDs.16–19 In a systematic review and meta-analysis Chamorro et al. established the reliability and concurrent validity of a HHD and IKD in measuring muscle strength in the knee, hip, and ankle joint. Their results revealed low reliability for knee extension and ankle plantar flexion strength when measured with an HHD. Additionally, the results showed a high correlation between the measurements from the instruments for hip strength values and a moderate correlation for knee and ankle strength values.16 Lesnak et al. assessed the agreement between the two instruments measuring isometric quadricep strength in a healthy population. Their results showed that the HHD produced higher peak torque strength values as compared to those from the IKD.17 In a more recent study, Hirano et al. established high validity (r=0.78) and intra-rater reliability comparing the results of knee extension muscle strength measured with a belt stabilized HHD to an IKD (ICC1,1≥0.75).18 However, Toonstra et al. concluded that significant differences were found in peak torque strength values observed between isometric knee flexion and extension measured using IKD and HHD.19
To the knowledge of the authors, no previous studies have assessed agreement or sensitivity in detection of abnormal LSI between LSI values calculated from isokinetic strength tests measured with an IKD and isometric strength tests measured with an HHD. Isokinetic strength measures are commonly used in research while HHDs are more commonly used clinically, highlighting the importance of comparing these instruments. In addition, the instruments should be studied in subjects who have undergone ACLR, as this a patient group where lower limb strength tests are frequently used to assess both progress in rehabilitation and to make clinical decisions regarding RTS. Thus, the purpose of this study was to assess agreement between a hand-held dynamometer and an isokinetic dynamometer, used to assess lower limb symmetry in knee muscle torque one year after ACLR. In addition, the authors investigated which of these two instruments was superior in detecting limb asymmetry. It was hypothesized that the agreement between the two types of strength measurements is low and that the IKD would be superior in detecting individuals with an LSI <90.
METHODS
Design
A cross-sectional study assessing agreement between two different measurement instruments adhering to the STROBE guidelines (https://www.strobe-statement.org/).
Study context
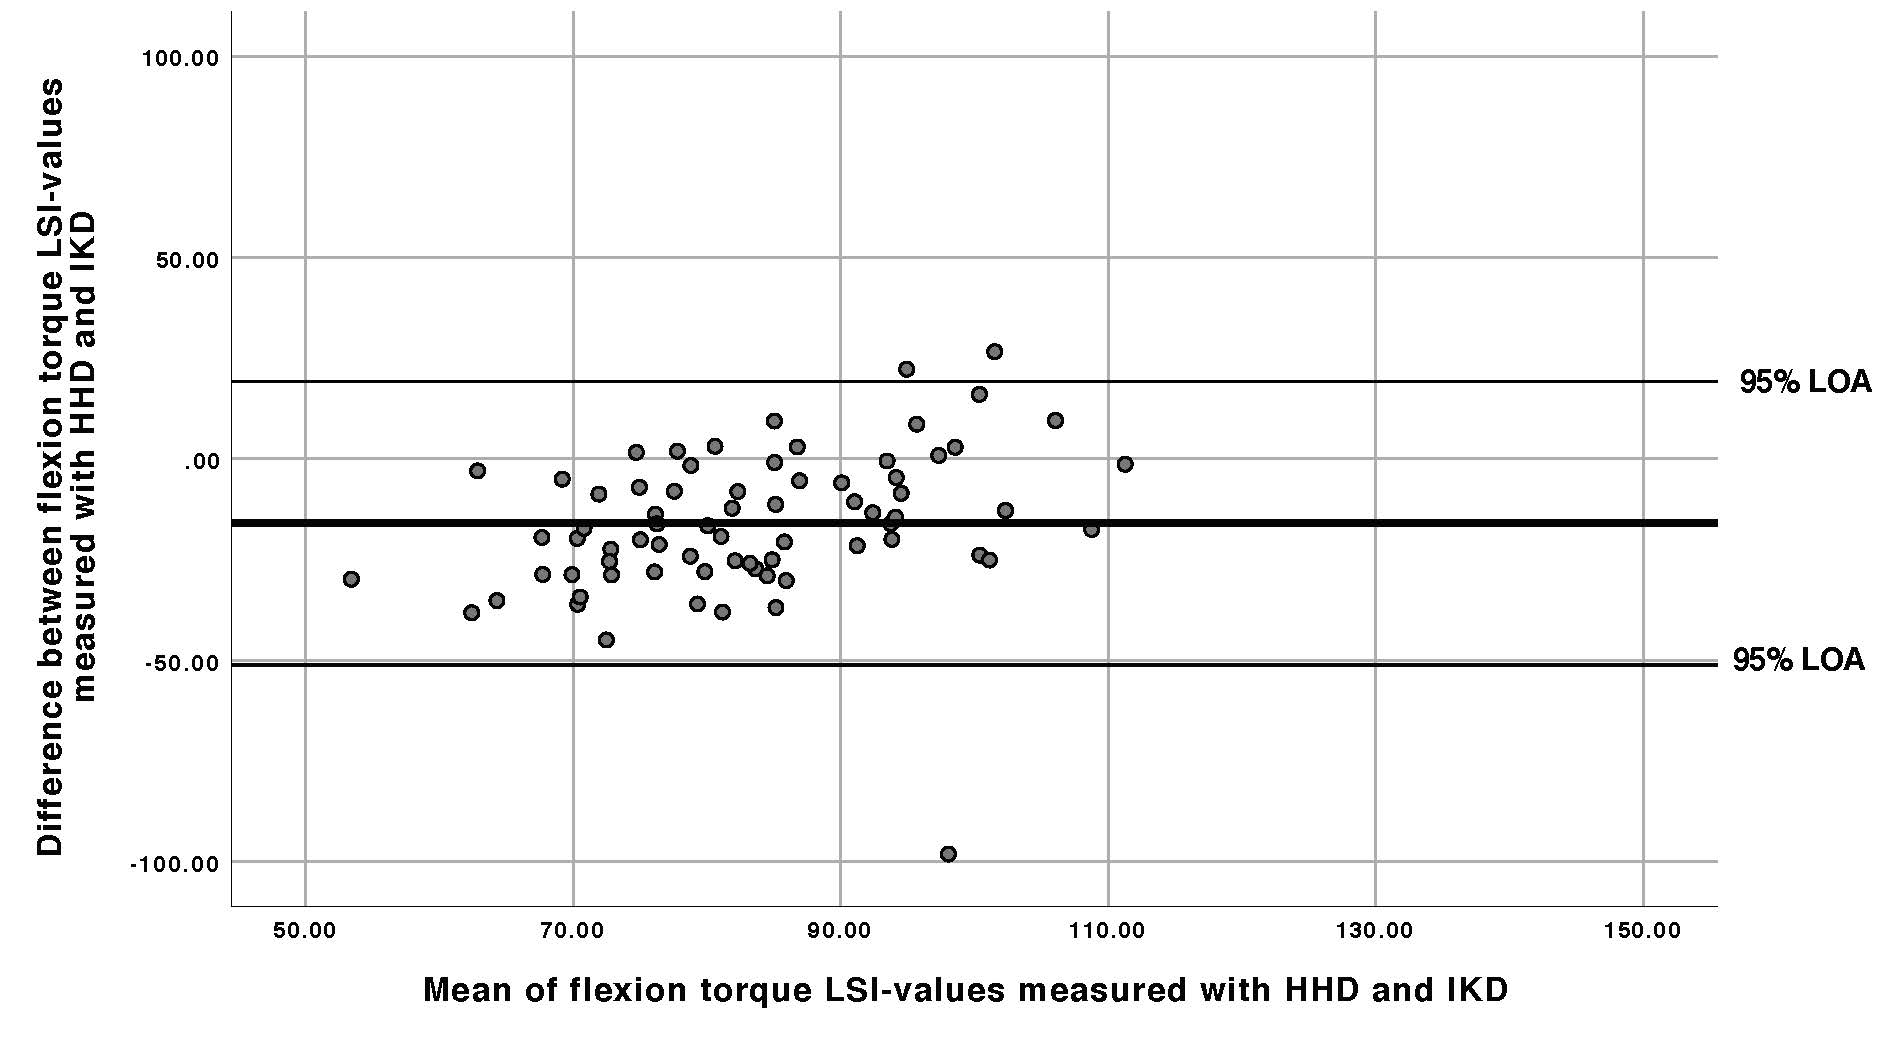
This study is an explorative analysis of baseline data from an ongoing prospective cohort study aiming to assess the correlation between lower limb function and early posttraumatic osteoarthritis after ACLR.20 Participants were consecutively recruited from the department of orthopedics, Skåne University Hospital. All patients who had undergone an ACLR during the time period January 2017- February 2019 were asked to participate via letter. Inclusion criteria were i) one year (10-16 months) after ACLR, with or without associated injuries to other knee structures, ii) age between 18-35 years. Exclusion criteria were i) previous serious injury or surgery to either knee, ii) other diseases or disorders affecting lower extremity function (e.g., hernia). The present study has received ethical approval from the Swedish Ethical Review Board (Dnr 2017/916). The participants received a letter with information of the study and gave their written consent before participating in the study. All participants were informed that they were allowed to cancel their participation in the study at any time.
Data collection
Baseline data for the prospective cohort study was collected between March 2018 and March 2020. One physiotherapist (AC) collected all data. Demographic data (age, height, weight, type of ACL graft) was collected prior to the testing. Before executing the tests, all participants performed a five-minute warm up on an ergometer bicycle. The HHD torque measures were performed first and then the IKD assessments for all participants, allowing for a rest period of at least five minutes in between.
Hand-held dynamometer
Isometric knee extension torque was measured with a HHD (Power Track II Commander Echo; JTECH Medical, Salt Lake City, Utah, USA) with the participants sitting on a treatment table with their knee in 90° flexion and their thighs fixated to the treatment table with a strap. Another strap was used around the leg of the treatment table and the HHD, which was placed on the anterior side of the participants’ distal tibia. The participants were asked to extend their knee with maximal effort.
Isometric knee flexion torque was tested with the participants laying on their stomach on a treatment table with their knee in 90° flexion. The examiner was sitting on the end of the table with a strap around the pelvis and around the HHD placed on the posterior side of the participants’ distal tibia. The pelvis and the leg that was not being tested were fixated to the treatment table with two straps. The participants were asked to flex their knee with maximal effort. When testing isometric extension and flexion torque with the HHD each test was repeated three times and the participants were asked to hold each maximal contraction for five seconds with 15 seconds of recovery between the contractions. The peak torque (N) of three measurements with each leg was collected and then normalized to body mass (N/kg*100). To randomize and avoid learning affects the right leg was always tested first.20
Isokinetic dynamometer
Isokinetic concentric torque in knee flexion and knee extension was measured in 60 degrees/sec with a Biodex (Medical Systems, Shirley, New York) with the participants in a sitting position with their arms across their chest. The chest, pelvis and thigh were secured with straps. The Biodex was calibrated before each test and the starting position of the knee was 90° flexion. The test was performed in a range of motion of 0-90° knee flexion. Four trial repetitions were performed with submaximal effort. After this, the participants performed five maximal contractions with each leg, starting with the non-injured leg. The peak value of the five trials for each leg was recorded. The measurements were presented as peak torque, expressed in Newton-meters (Nm) and then normalized to body mass, (peak torque divided by the participants’ body weight in kg (Nm/kg)).
Data analysis
Descriptive statistics with mean and standard deviation was used for presentation of demographic data such as weight, height, age, and body mass index (BMI). Analysis of agreement was performed in The Statistical Package for Social Sciences (SPSS), (Version 26.0 IBM Corp). Normalized peak torque values of extension and flexion strength of the injured and uninjured leg were used to calculate LSI.
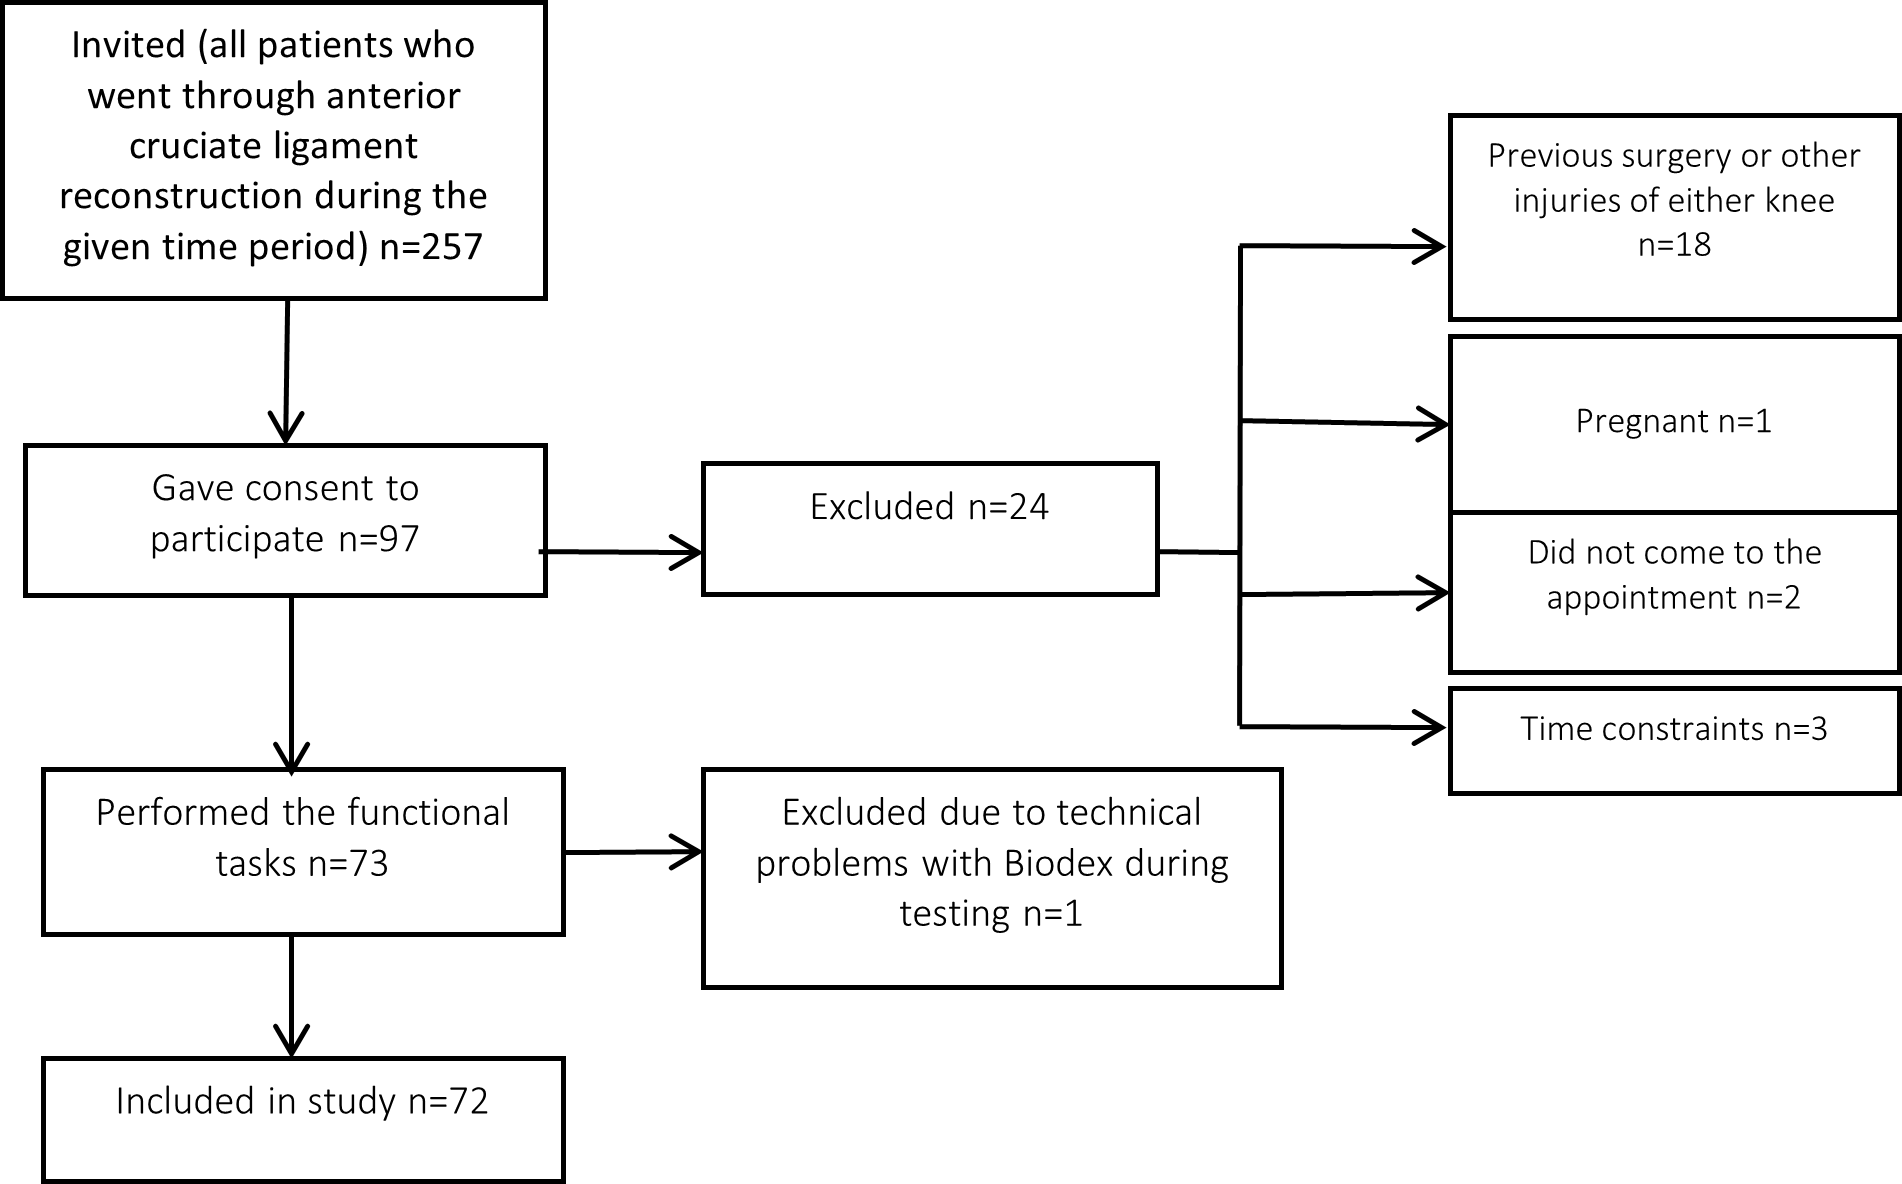
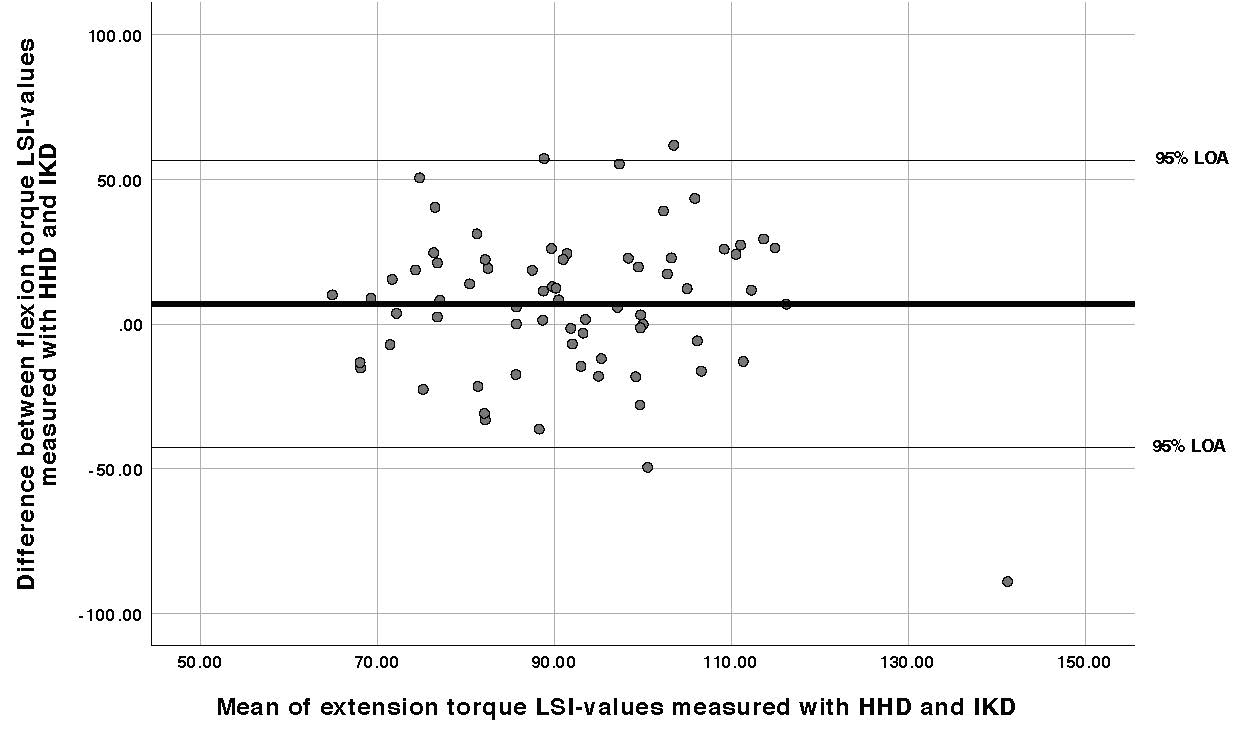
Bland & Altman plots with 95% limits of agreement (LOA) (average difference between measurement instruments ± 1.96 x SD of the difference) and Cohen’s Kappa coefficient were used to assess agreement between the two measurement methods. The results of Bland & Altman plots give a visual representation of the difference between the mean of two different measurement methods used on the same subject, which in this case is the IKD and HHD, and shows systematic differences.21 The following thresholds for Cohen’s Kappa coefficient were used; <0.00 no agreement, 0.00-0.20 poor to slight agreement, 0.21-0.40 fair agreement, 0.41-0.60 moderate agreement, 0.61-0.60 substantial agreement, 0.81-1.00 almost perfect agreement.22
To measure which instrument was superior in detecting lower limb asymmetry in muscle strength the participants were divided into two different groups. One group included the participants with a LSI≥90% and the other group included participants with a LSI<90%. After this, cross tabulations with abnormal LSI (LSI<90%) and normal LSI (LSI≥90%) were constructed. McNemars’s test was used to test the proportion of participants with normal versus abnormal LSI values for the HHD and IKD in flexion and extension strength. Statistical significance was set at p≤0.05.
RESULTS
Seventy-two (37 women; age= 25.8 ± 5.4 years), were included in this study (Table 1 and Figure 1).
Of the 73 participants originally included, one of the participants experienced discomfort during the extension strength test with the HHD and did not proceed with this test but performed all flexion strength tests. Data for another participant were lost for both knee flexion and extension strength due to technical problems with the Biodex, leaving 72 (flexion strength) and 71 (extension strength) participants, respectively, for the analysis.
Overall, the participants had a higher mean peak torque value in their uninjured leg compared to their injured leg in both isokinetic and isometric strength. Generally, the peak torque value measured with the IKD was higher than the peak torque value measured with the HHD. The mean LSI measured with the HHD was 75.3 % for flexion and 94,6% for extension. The mean LSI measured with the IKD was 91.3% for flexion and 87,7% for extension (Table 2).
The Bland & Altman plots for both extension and flexion LSI-values revealed wide limits of agreement (Figures 2 and 3). Cohen’s Kappa coefficient was low for both extension LSI values (0.136) and for flexion LSI values (0.236) indicating a poor to slight respectively a fair agreement between the instruments.
_for_limb_symmetry_index_(lsi)_of_.jpg)
_for_limb_symmetry_index_(lsi)_of_.jpg)
The cross tabulations showed that the HHD detected significantly more participants with abnormal flexion torque LSI compared to the IKD (59 vs 35, p<0.001) (Table 3) whereas there was no statistically significant difference for extension torque LSI (HHD 29, IKD 38, p=0.150) (Table 4).
DISCUSSION
The purpose of this explorative analysis was to assess measurement agreement between an IKD and a HHD, used to detect lower limb asymmetry in flexion and extension knee muscle torque after ACLR. In addition, the aim was to investigate which of these two instruments was superior in detecting lower limb asymmetry. In support of the hypothesis, the results of this study showed that the measurement agreement between the instruments is low, indicating that the HHD and IKD should not be used interchangeably. In addition, contrary to the hypothesis, the HHD detected a significantly larger number of participants with abnormal flexion LSI than the IKD.
The different types of strength, at different angles that the instruments measure may explain the low agreement between the LSI values. As previously mentioned, the IKD measures isokinetic torque whereas the HHD measures isometric torque. Isokinetic torque is assessed during a contraction of the muscles at a constant speed in a specific ROM, implying that the muscle length is changing. Isometric torque is a static strength assessment inferring that the muscle remains contracted at specific joint angle and the length of the muscle does not change.15,16,23 Since peak torque (strength) values were the values used to calculate LSI in this study, it is most likely that the isokinetic muscle torque peak torque value was reached at different joint angles (between 0-90° flexion) in the knee joint. On the contrary, the isometric flexion and extension torque was only tested at 90° of flexion in the knee joint. Emami et al. found that isometric flexion torque measured at 90° and 100° of flexion was significantly reduced (compared prior to surgery) one year after ACLR. The same study showed that flexion torque was not significantly reduced at 20° and 45° of flexion.24 This is also supported by the mean peak torque value presented in this study, since the HHD measurements reveled generally lower peak torque value in both flexion and extension strength. This may imply that if the isometric torque would have been tested at different angles and the highest peak torque value across the range would be used in the data analysis of this study it could have affected the LSI value and thus, also the agreement between the instruments.
In this study, agreement and sensitivity for both knee flexion and knee extension torque were assessed. Several studies and systematic reviews have concluded that weakness in extensor muscles is associated to development of osteoarthritis, reduced quality of life and functional disabilities, highlighting the importance of regaining extensor strength after ACLR.7,25,26 In Sweden the majority of patients undergoing ACLR receive a hamstring tendon graft.27 Studies show that patients who receive a hamstring graft have a remaining weakness in flexion strength two years after ACLR.28–30 Taken together, this emphasizes the importance of detecting both knee extension and flexion strength deficits after ACLR. The results of this study revealed that the HHD detected almost twice as many participants with abnormal flexion strength LSI compared to the IKD, whereas there was no significant difference between the instruments for extension strength LSI. These results highlight the potential use of isometric measurement instruments to assess knee flexion torque asymmetries in ACLR patients
As discussed above, the IKD is popular, especially in sports medicine and research.16 One reason that the IKD is considered superior to the HHD is that IKDs are not affected by the strength differences between the patient and the examiner holding the dynamometer.31 Further, the IKD has been criticized since patients do not always reach maximum strength performance in the IKD if they are not familiar with the equipment and know how it works.32 Other limitations with the IKD include the costs and the limited availability in clinics.33 However, although both instruments have limitations, the high incidence of ACL re-injuries imply that the functional tests are not sufficient to assure readiness to RTS. Muscle strength tests could thus be a good complement to the functional tests.34,35 The results of the current study showed that the HHD at 90° of knee flexion identified more patients with abnormal flexion LSI one year after ACL and promote the clinical use of HHDs. Further studies may reveal if there are any strength measures that are superior in detecting deficits in knee extension LSI.
Strengths and limitations
One of the strengths of this study is the large sample which increases the chance of accurate results.20 Another strength of this study is that the same researcher performed all data collection to avoid inter-rater variability. Further, in contrast to other studies, the current study compared muscle strength LSI values in injured subjects who went through ACLR. Previous studies have only compared peak torque strength values in healthy subjects. To assess which instruments should be used clinically for strength assessment in ACLR rehabilitation it is important that they have been tested in participants who have undergone ACLR.
One major limitation of this study is that agreement between two instruments that measures different types of strength (isometric vs. isokinetic) was assessed. This may imply that there may not be a good agreement between the two instruments. However, in this study LSI values were used in the data analysis for agreement. The LSI values are independent of both demographic factors and what type of strength that is tested since the variable is a ratio between the participants’ injured and uninjured leg. This means that it is not the instruments per se that are compared against each other, but the LSI values. Also, to avoid bias associated with gravitational forces,36,37 only isometric torque at 90° of knee flexion was assessed, which may have contributed to the poor agreement between measurements. It may further be argued that 90° of knee flexion is not a functional position with regards to knee injury risk.38 Although, in a recent study Beere et al. confirmed that testing isometric quadriceps strength with a dynamometer is dependent on the angle of the knee joint and that quadricep strength should be tested in either 90° or 30° of flexion to detect asymmetries similar to the IKD,39 future studies investigating if strength deficits, assessed in 90° of knee flexion, are associated with relevant outcomes, such as RTS and risk of second injuries are warranted. Due to practical reasons, isometric knee flexion torque was assessed in a prone position, whereas the isokinetic knee flexion torque was assessed in a seated position, according to the IKD standardization. Although a prone position is proposed to be more functional,40 the difference in testing position may constitute another reason for the lack of agreement in the current study.
Furthermore, LSI presumes that the strength and function in the uninjured leg corresponds to the patient’s strength and function in the injured leg before the ACL injury. However, the ACL injury may also affect the strength and function of the uninjured limb due to general deconditioning and/or arthrogenic muscle inhibition.41,42 It is therefore possible that the LSI is overestimated when assessing lower limb muscle strength. However, studies show that patients who return to sport before they have reached a satisfactory LSI have an increased risk of early development of osteoarthritis and lower self-perceived function in the knee, implying that LSI, despite criticism, is a useful measure.43,44 Finally, since this was an exploratory analysis of an ongoing longitudinal trial, no a priori power calculation was performed. However, since the sample size in the current study is more than twice the recommended sample size of 32 participants for agreement studies,45 the sample should be adequate for the purpose of this study.
CONCLUSION
The wide limits of agreements and low Cohen’s Kappa coefficients in this study, indicate a poor agreement between IKD and HHD implying that the instruments should not be used interchangeably for measurements of strength after ACLR. The hand-held dynamometer at 90° of knee flexion was more sensitive in detecting abnormal limb symmetry index in knee flexion strength. However, future research is needed to determine which type of instrument is superior in detecting deficits in knee extension strength and if strength deficits in 90° of knee flexion are associated with relevant ACLR outcomes, such as RTS and re-injury risk.
CONFLICTS OF INTEREST
The authors report no conflicts of interest related to this manuscript