

INTRODUCTION
The anterior cruciate ligament (ACL) connects the femur to the tibia and plays a key role in stabilizing the knee in both the sagittal and transverse planes which include anterior tibial translation and rotational loads, respectively.1 Approximately 70% of ACL injuries occur by noncontact mechanisms, such as when the athlete is changing directions, slowing down at near or full knee extension, or landing from a jump.1,2 There is an estimated 200,000 ACL-related injuries a year with 100,000 requiring reconstructive surgery.3 The average cost of ACL reconstruction is $24,707, making the total annual cost approaching $2.5 billion.4 ACL injuries are common in adolescent female athletes often resulting in long-term physical, mental, and financial burdens.5
Female adolescents participating in jumping and pivoting sports have a two to nine time greater chance of experiencing an ACL injury versus male athletes of the same age and sport.2 In female high school athletes, knee injuries are the most common disability accounting for nearly 91% of season-ending injuries.3 Additionally, year-round female soccer and basketball athletes have a 5% chance of tearing their ACL every year they participate in sports.3 ACL incidence rate for soccer athletes ranges from 0.06 to 3.7 per 1000 hours of active play including practice and games.2 Approximately 50% of ACL injuries have associated concomitant injuries which include the medial collateral ligament (MCL) and medial meniscus.5
ACL injury risk factors are multifactorial, including non-modifiable and modifiable factors. Non-modifiable anatomical and hormonal factors, such as a wider Quadriceps-angle (Q-angle) or the release of estrogen and relaxin, cannot be influenced by physical therapy intervention. Although non-modifiable factors cannot be addressed by exercise intervention, they provide further insight and create an encompassing profile of at-risk athletes. For example, an increased Q-angle could result in altered biomechanical hip internal rotation (IR) and knee valgus, which could increase patellofemoral joint stress and instability.6 However, biomechanical abnormalities and neuromuscular recruitment, such as poor postural positioning or proximal stability, can be modified with appropriate training and provide the greatest impact on reducing the risk of noncontact ACL injuries.2
Abnormal positioning and irregular movement patterns, as well as strength imbalances, can predispose an athlete to a higher risk of ACL injury. A movement pattern known as dynamic valgus, is an associated biomechanical risk factor during performance of agility and plyometric physical activities such as planting, cutting, or jumping.1,5 Dynamic valgus includes hip adduction and internal rotation (IR), tibial external rotation (ER), and ankle eversion, which result in increased joint reaction force in the lateral compartment of the knee and increased strain on the MCL. Hip abductor weakness is a contributing factor to dynamic valgus biomechanics at the knee.1,5 A stronger lateral quadriceps and weaker medial hamstring (HS) strength leads to quadriceps dominance. This neuromuscular imbalance predisposes the risk of ACL injury due to increased stress placed on the ACL.7
Since the passage of Title IX, the number of female athletes participating in high school and college sports has increased 10- and five-fold, respectively.3 Over the past twenty years, the speed, power, and aggressiveness of female athletes have drastically increased which has resulted in a greater number of musculoskeletal injuries.3 Overall, ACL injury risk is multifactorial which includes non-modifiable anatomical and hormonal risk factors, as well as modifiable biomechanical and neuromuscular risk factors that can be positively affected by appropriate screening and conditioning.
Physical therapists (PTs) have a role in injury prevention and should design and develop screening programs aimed at preventing injury as a part of a wellness-focused initiative for community health.8 Additionally, PTs should focus on engaging with the community and offer preventative and screening services to reduce the need for costly management following an injury.9 The cost of potential screening programs has been found to range from $2.00 to $15.00 per player, depending on the equipment and personnel used; whereas, the cost of an ACL reconstruction can cost upwards of $17,000.10 Screening programs have been estimated to reduce the incidence of ACL injury by an average of 40%, resulting in an improvement of health outcomes.10 In the literature, the majority of ACL screening programs focus on one risk factor in isolation, such as range of motion.11,12 Currently, there are no existing protocols that combine several modifiable risk factors into an all-inclusive ACL injury screening program. The purpose was to conduct a feasible community pre-season screening program for high school female athletes for the presence of known modifiable risk factors that predispose them to sustaining a non-contact ACL injury.
MATERIALS/METHODS
The study was approved by the Institutional Review Board of Walsh University prior to completion and data collection (#2021007).
Study Design and Participants
This study was a non-experimental, prospective pilot study of high school female soccer and basketball athletes. Inclusion criteria were female soccer and basketball athletes, aged 13-18 years old. None of the participating athletes had undergone knee surgery nor were recovering from any lower extremity injury. A convenience sample was utilized by contacting local coaches through email to provide information regarding the screening program and to inquire about volunteer recruitment. All athletes completed a medical history form prior to starting the program. All athletes and parents were informed of the purpose and components of the program, and all athletes and parents provided assent and consent, respectively, for participation in the program due to the study involving minors.
Intervention Procedures
Each athlete progressed through the pre-season screening program in the following order: range of motion, jump landing assessment, strength testing, and dynamic balance testing. The sequencing of performing the screening measures promoted reliability of testing procedures and limited the effects on performance for subsequent tests.13 Because of test sequencing, rest in between each station was not deemed necessary, allowing for increased efficiency of the screening program. All screening measures were performed by student physical therapists (SPT’s), who were previously educated on the below measures. Ten SPTs completed 30-minutes of instruction, training, and practice for their respective measures. Throughout the entire program, all outcomes were assessed by the same SPTs. The screening program and educational presentation provided to the coaches were reviewed and supervised by licensed PTs. Prior to completing the screening stations, athletes completed a five-minute warm-up on an upright exercise bike.
Outcomes/Test Protocol
The primary outcomes of this program included range of motion, jump landing strategy, muscle strength, and single-leg dynamic balance.
Range of Motion
A goniometer was used to measure the passive range of motion (PROM) of hip IR, hip ER, weight-bearing ankle dorsiflexion (DF), and the Q-angle. The reliability of PROM goniometric measurements for the lower extremity is considered good to excellent.14 The standard error of measure (SEM) reported in the literature for the four measurements utilizing a goniometer are as follows: 2.42 degrees for hip IR, 2.53 degrees for hip ER, 1.8-2.8 degrees for weight-bearing ankle DF, and 1.02 degrees for Q-angle.15–17 The same testing positions described below were the same testing positions utilized in the articles where the SEMs were reported.15–17 However, the populations of the articles where the SEMs were reported were different from the target population of female high school athletes. For hip IR and hip ER, the population was comprised of individuals with femoral acetabular impingement compared to healthy controls.15 For weight-bearing ankle DF, the population was healthy young adults with an average age of 24 years old.16 For Q-angle, the population consisted of females and males between the ages of 21-50 years.17 Currently, there is a lack of literature on reporting SEM for the female adolescent population.
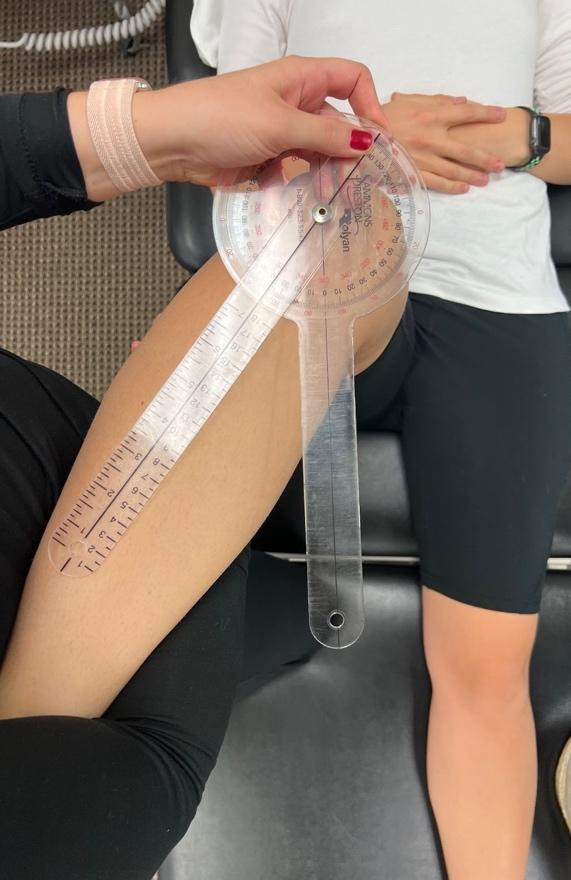
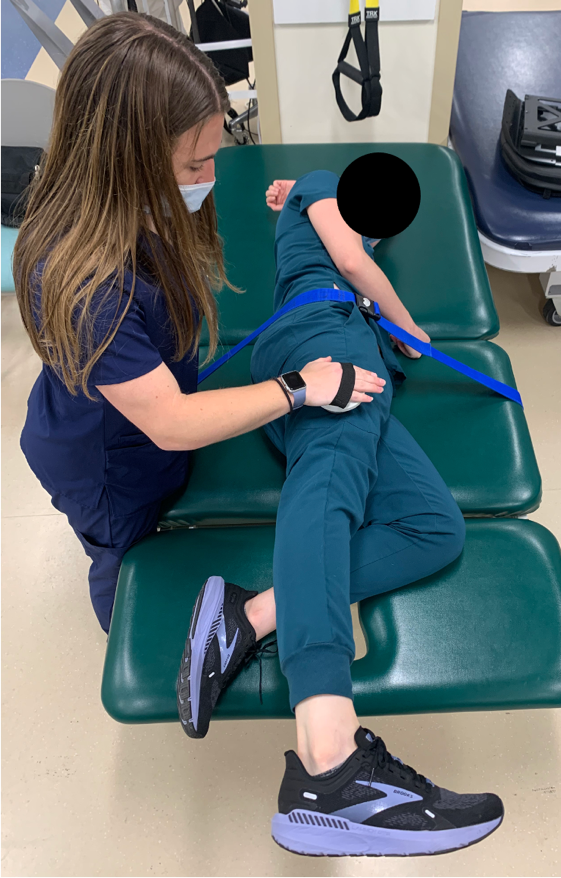
To measure hip IR and ER PROM, the athlete was supine on the treatment table with the hip and knee of the measured leg flexed to 90° and the non-measured leg fully extended on the table.11 The examiner lined up the stationary arm of the goniometer with the tibial tuberosity and then passively took the flexed hip into both IR and ER.11 The examiner moved the moveable arm of the goniometer to align with the tibial tuberosity while keeping the stationary arm in its vertical position (Figures 1 and 2).11 This was completed three times on each lower extremity and the average of each side was recorded.

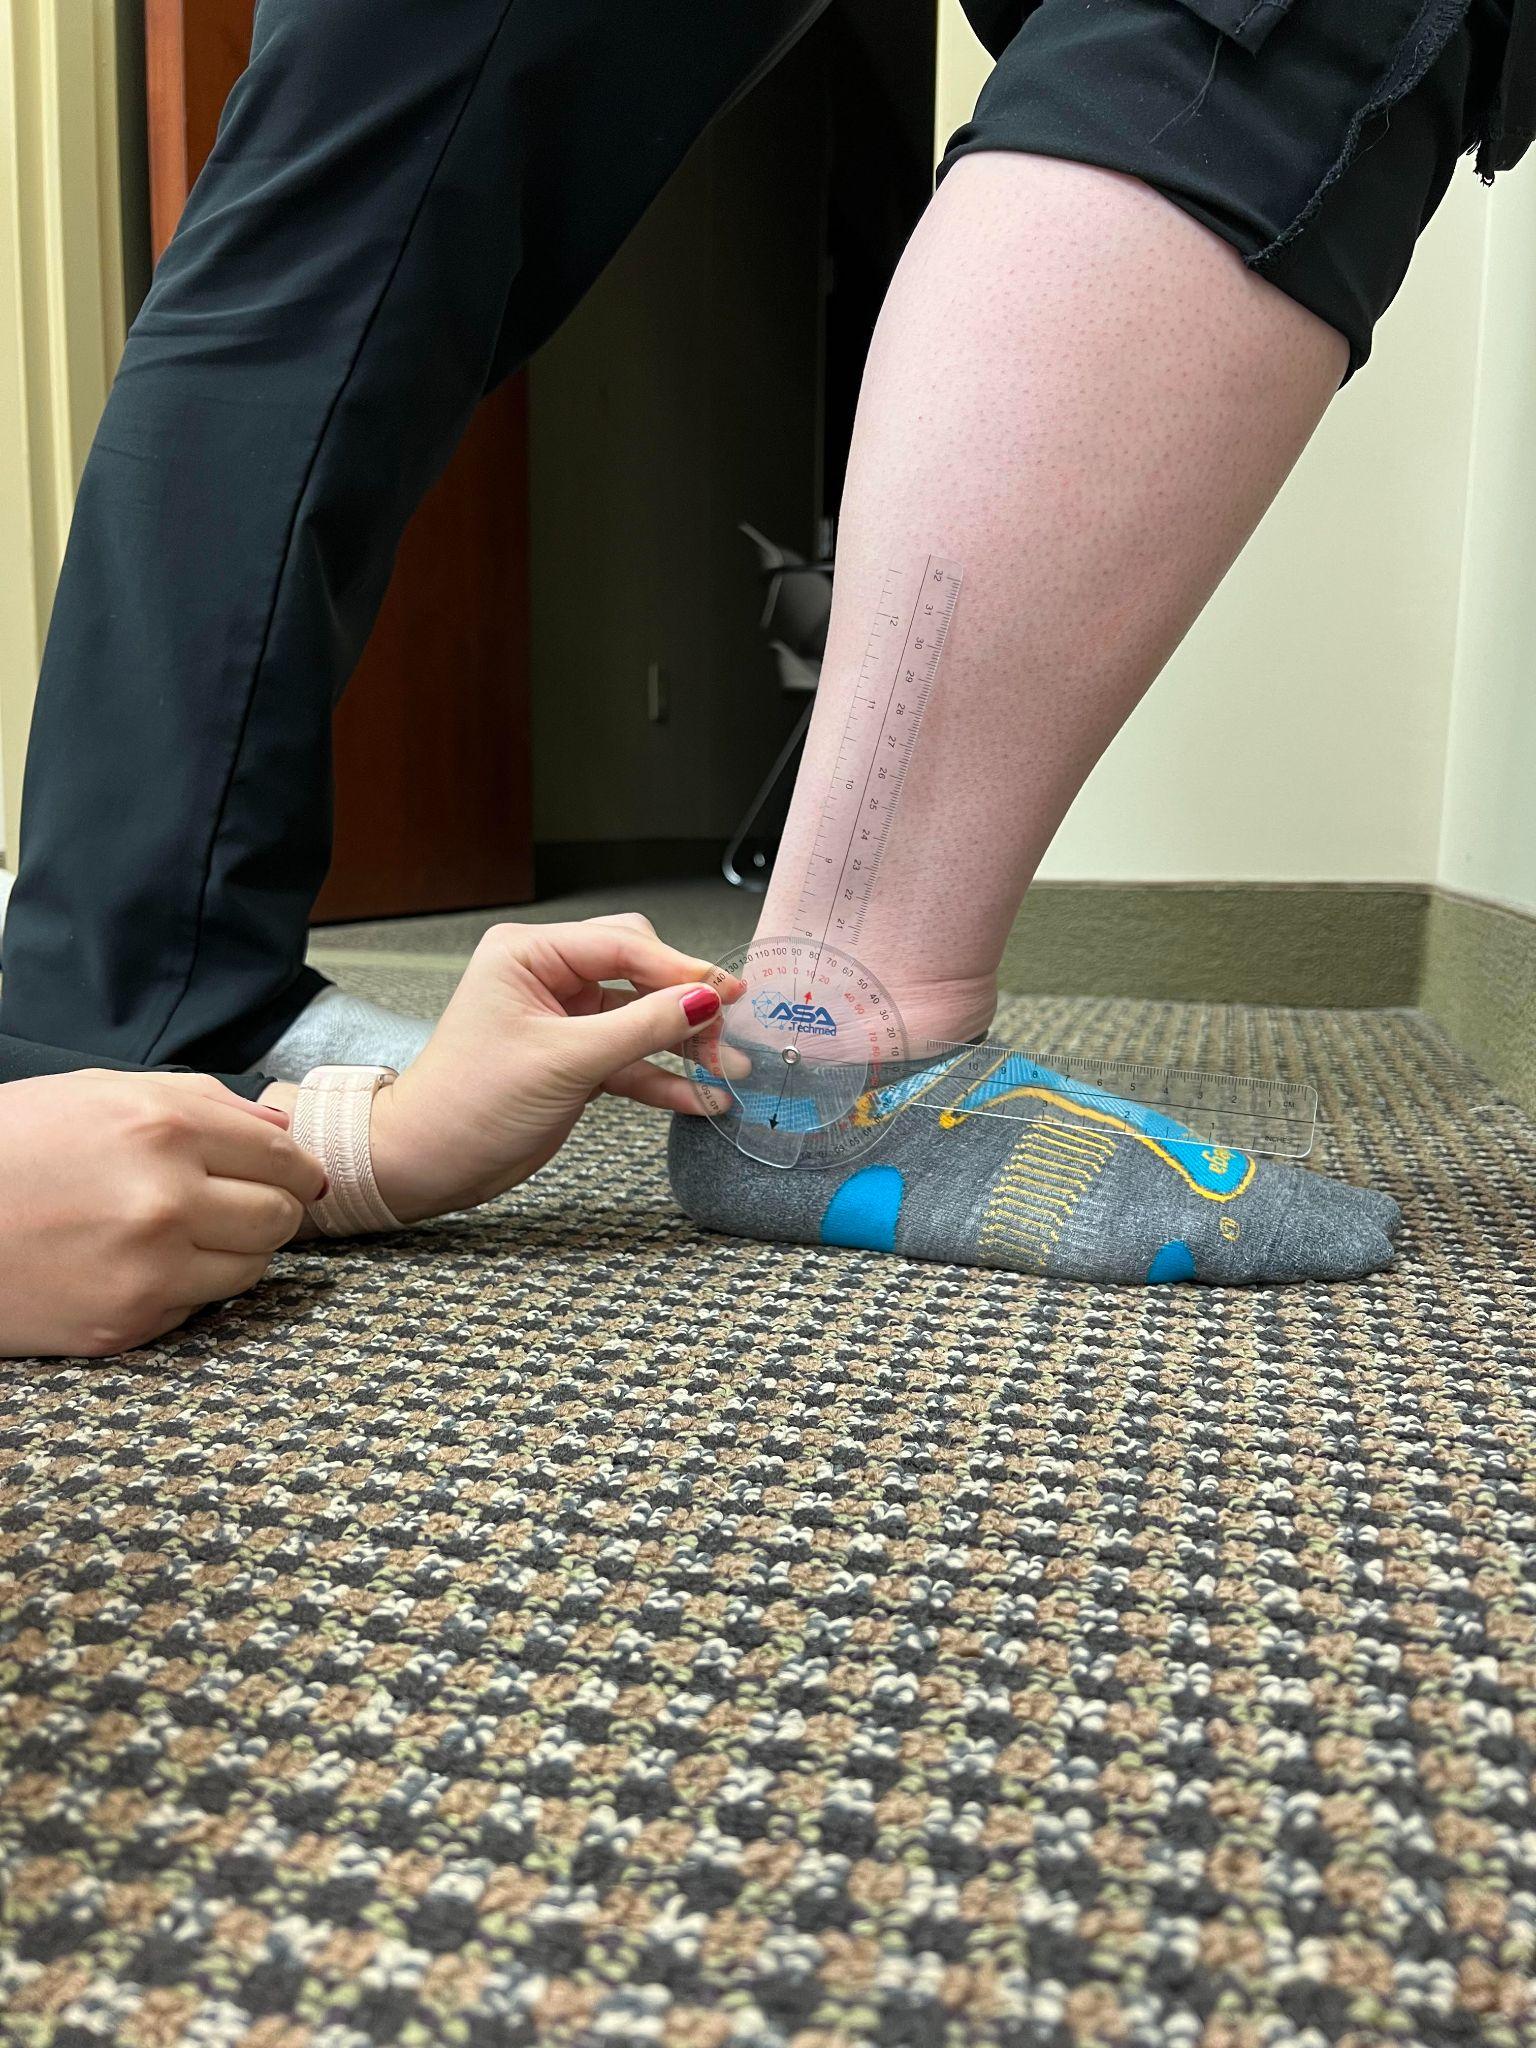
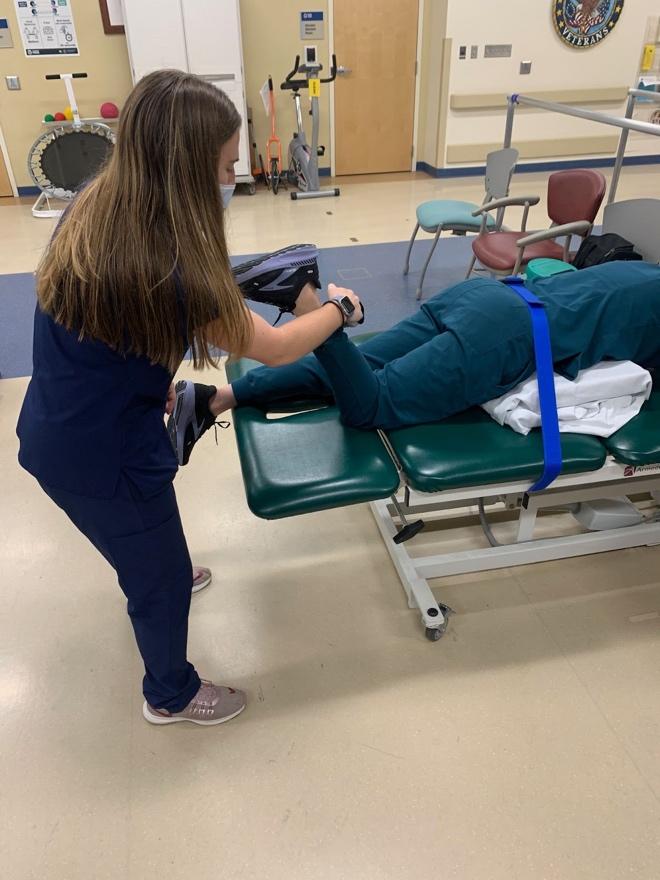
To measure weight-bearing ankle DF, the athlete was asked to stand with the ankle being measured perpendicular to the wall with the second toe and midline of the foot placed directly on a piece of tape placed on the floor.12 The athlete was then instructed to lunge the knee towards the wall until their maximal ankle DF was reached, which was indicated when the heel lifted off the ground.12 If the athlete’s knee contacted the wall before maximal DF was achieved, their foot was moved posteriorly.12 The axis of the goniometer was placed below the lateral malleolus, the stationary arm was in line with the 5th metatarsal, and the moveable arm was in line with the fibular head. This was completed three times on each lower extremity and the average of each side was recorded (Figure 3).

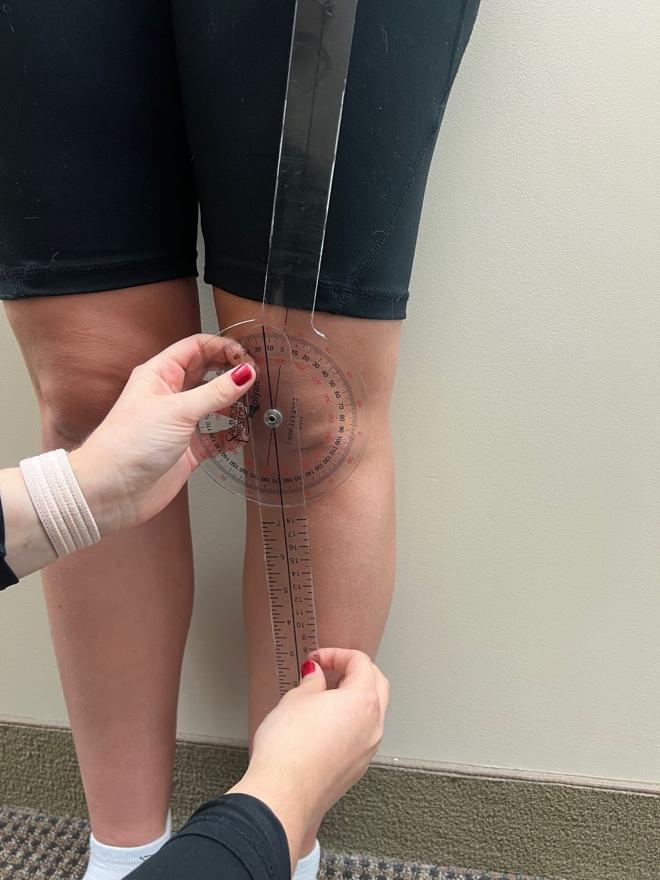
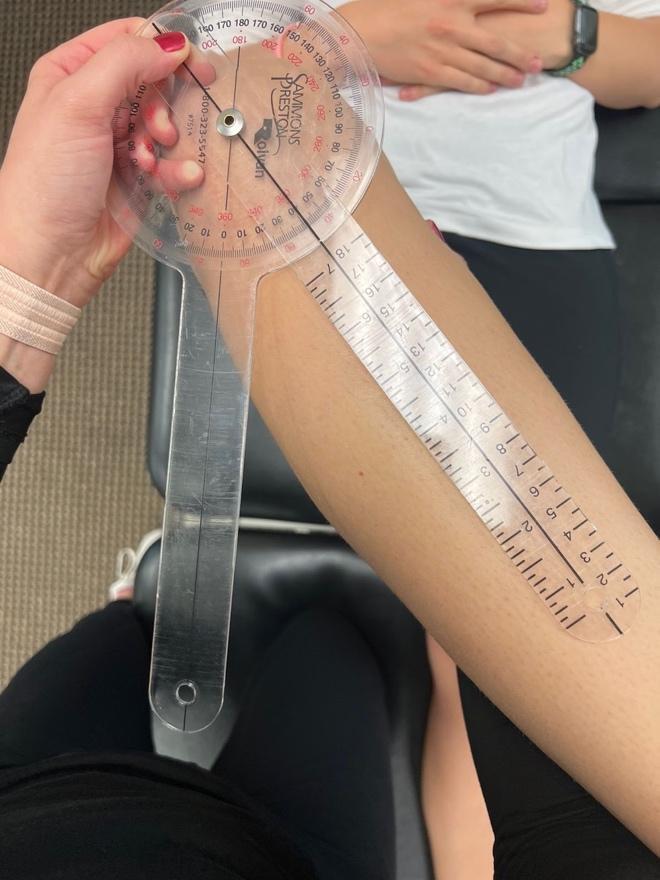
To measure the Q-angle, the athlete stood in anatomical position without shoes and socks. The examiner placed the axis of the goniometer at the center of the patella and aligned the stationary arm of the goniometer with the ipsilateral ASIS.18 Next, the examiner aligned the moveable arm of the goniometer with the tibial tuberosity (Figure 4). The intersection of the line drawn from the ASIS to the center of the patella and the line drawn from the center of the patella to the tibial tuberosity is considered the Q-angle.18 This was completed three times on each lower extremity and the average of each side was recorded.

Jump Landing Strategy
Jump landing was analyzed using the Landing Error Scoring System (LESS). The athlete stood on a 30 cm (12 in) box. A taped line that marked 50% of their height was positioned in front of the box. The athlete began the test standing on the box and was instructed to jump in front of the taped line followed by jumping as high as they could immediately upon landing. The test was repeated for a second trial with a minute-long break in between. Each trial was videotaped using iPads (Apple, Cupertino, CA) – in both frontal and sagittal views – and analyzed with the Hudl application (Hudl, Lincoln, NE). Hudl allowed for slowing down the videos and applying virtual angles to each frame. This test utilizes a 17-category scoring system to rate jump landing characteristics.19 Quality of jump landing mechanics are classified into four categories: ≤ 4 errors is rated as excellent, > 4 to ≤ 5 errors is rated as good, >5 to ≤ 6 errors is rated as moderate, and > 6 errors is rated as poor.20 Females commonly score lower than males, with one study finding that only 14% of the female participants were classified in the excellent category, compared to 29% of males scoring within the excellent category.20 College-aged athletes have been found to have lower scores on the LESS compared to their high school-aged counterparts (4.42 and 5.36 respectively); however, these reported scores combined both males and females.21 There are currently no studies reporting youth female LESS scores in isolation to determine normative values for this population. Research has demonstrated adequate interrater and intrarater reliability of the LESS test with intraclass correlation coefficient values of 0.84 and 0.91 respectively.20 Validity of the LESS was item-dependent when comparing the results with the “gold standard” of three-dimensional motion analysis and ranged from poor (10%) to excellent (100%).22
Muscle strength
A handheld dynamometer (HHD; Hoggan Scientific MicroFET2, Salt Lake City, UT) utilizing stabilization belts was used to assess hip ER, hip abduction, knee flexion, and knee extension strength. Proximal body segments were stabilized using external support via stabilization belts. For each strength measurement, the athlete was prompted to perform a make-contraction which consisted of a two-second ramp-up time followed by a five-second maximal contraction.23 After five seconds, the athlete relaxed, and data was recorded. This was completed three times on each lower extremity and the average of each side was recorded. The belt stabilized HHD displayed moderate to excellent intra-examiner reliability for measuring hip and knee muscle groups and was moderately to highly correlated with the isokinetic dynamometer.24 While the ideal method would be to use an isokinetic dynamometer, it is expensive, lacks portability, and requires expert training. An HHD has proven to be an appropriate alternative that is inexpensive, portable, and easy to use.24
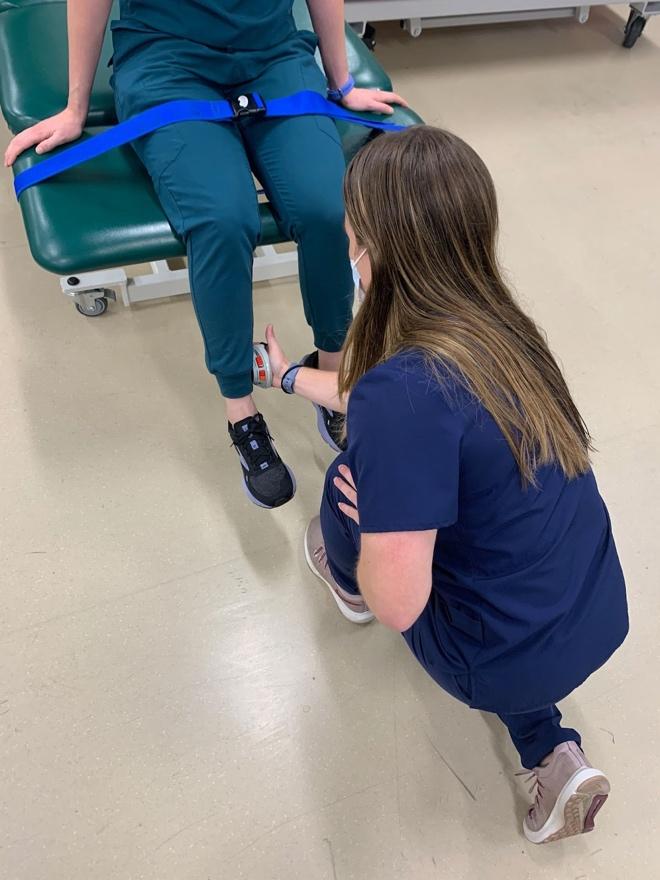
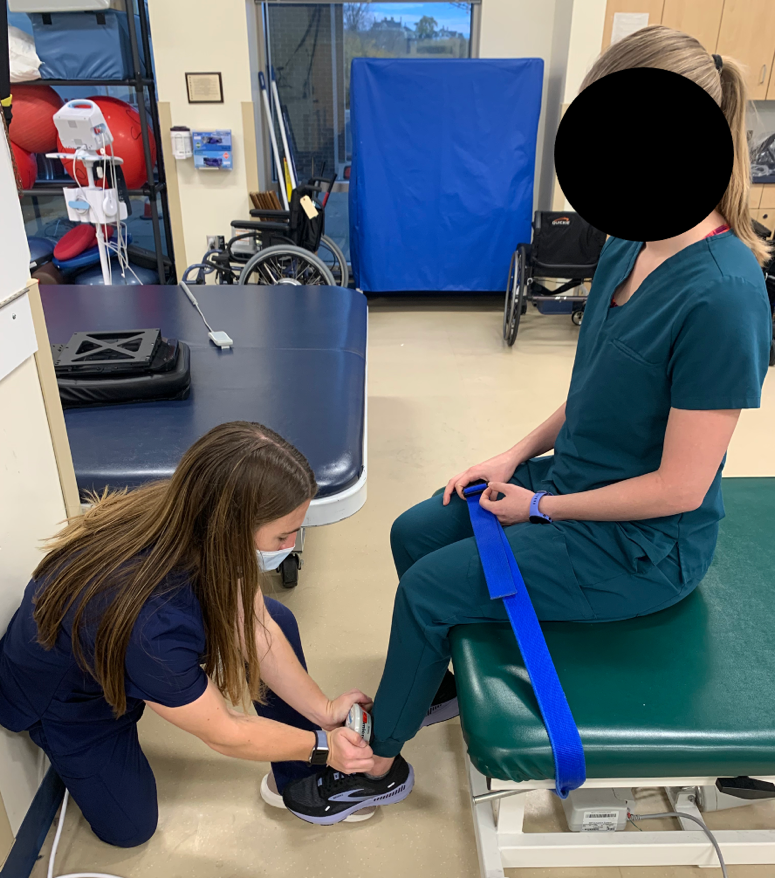
To measure hip ER strength, the athlete sat at the edge of a treatment table and a belt was positioned at the proximal thighs and secured around the table to stabilize the legs.25 The knees were bent to 90o, and the HHD was placed proximal to the medial malleolus.25 The examiner stood medial to the test extremity when measuring strength (Figure 5).25 Hip ER strength measures were recorded in kilograms (kg) and expressed as a percentage of body weight (BW).

To measure hip abduction strength, the athlete was side lying on a treatment table, and a belt was positioned around the waist proximal to the iliac crest and secured around the table to stabilize the pelvis.25 The hips were in neutral meaning no forward or backward rotation, neutral lumbopelvic positioning, and no hip extension or flexion.25 The HHD was placed 10 cm proximal to the lateral femoral epicondyle.25 The examiner stood posteriorly to the athlete when testing to ensure neutral alignment of the pelvis (Figure 6).25 Hip abduction strength measures were recorded in kg and expressed as a percentage of BW.
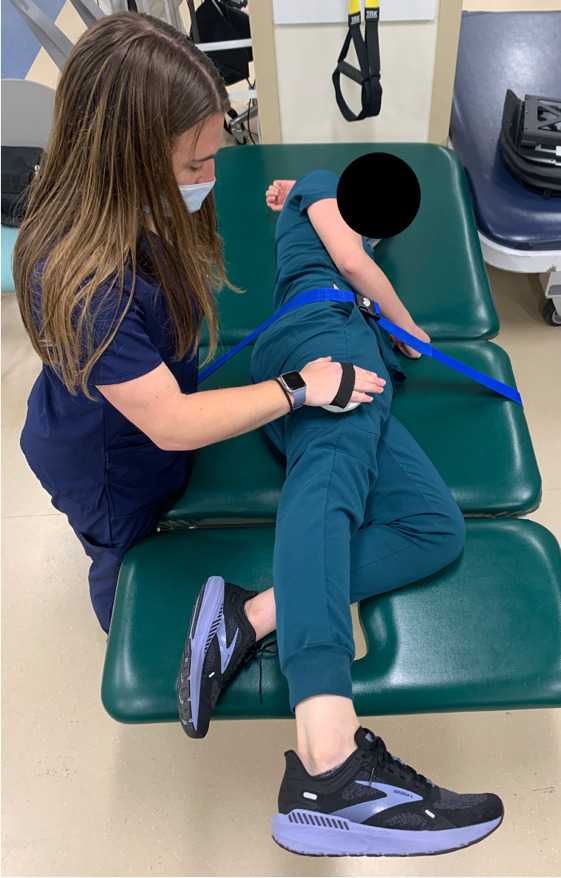
To measure knee flexion strength, the athlete was prone on a treatment table and two blue foam pads (Airex, Switzerland) were placed underneath their stomach to promote hip flexion for more optimal HS length-tension.26 With increased hip flexion, there is a greater knee flexion torque and a better replication of stride position in gait.26 A belt was positioned proximal to the iliac crest and secured around the table to stabilize the pelvis.26 The HHD was placed proximal to the Achilles tendon, and the examiner stood at the end of the table in line with the athlete.26 The make-contraction was performed into knee flexion of approximately 60o (Figure 7). Knee flexion strength measures were recorded in kg and expressed as a hamstring to quadriceps (H:Q) strength ratio.

To measure knee extension strength, the athlete was sitting at the edge of a treatment table and a belt was positioned at the proximal thighs.27 The knees were bent to 90o, and the HHD was placed at the anterior lower leg proximal to the ankle.27 The examiner held the HHD in position by placing their elbows in their abdomen with their back against the wall to provide a more stable barrier (Figure 8).27 Knee extension strength measures were recorded in kg and expressed as an H:Q strength ratio.

Single Leg Dynamic Balance
Dynamic balance was measured by assessing the quality of movement during a lateral step-down test (LSD). Athletes performed the LSD from a 6-inch step and quality of movement was visually assessed using a scale with scores ranging from 0 to 6.28 Using this scale, a total score of 0 or 1 is classified as “good” quality of movement, 2 or 3 is “moderate” quality, and 4 or above is “poor” quality.29 Scoring was based on five criteria: 1) Arm strategy. If the subject removed a hand off their waist during the test, 1 point was added; 2) Trunk movement. If the trunk leaned to any side, 1 point was added; 3) Pelvis plane. If the pelvis rotated or elevated one side compared with the other, 1 point was added; 4) Knee position. If the knee deviated medially and the tibial tuberosity crossed an imaginary vertical line over the 2nd toe, add 1 point, or, if the knee deviated medially and the tibial tuberosity crossed an imaginary vertical line over the medial border of the foot, add 2 points, and; 5) Maintain steady unilateral stance. If the subject stepped down on the non-tested side, or if the subject’s tested limb became unsteady (i.e. wavers from side to side on the tested side), add 1 point.28
Using the previously mentioned scale of measurement, several studies have found the interrater reliability to be substantial (Kappa Coefficient (K) = 0.67 & K = 0.81)28,29 for the LSD in females diagnosed with patellofemoral pain syndrome and moderate (K = 0.59)30 for healthy females. These values indicate a moderate to excellent level of agreement which is considered suitable for use in clinical practice. Validity has not been specifically mentioned in the literature for the LSD; however, studies have shown that altered movement patterns that lead to excessive knee valgus alignment, as measured by the LSD, have been implicated as a risk factor for lower extremity injuries including noncontact ACL injuries.30,31 There is an association between decreased quality of movement on the LSD and decreased ankle dorsiflexion ROM.30 Females who demonstrate decreased dorsiflexion during the LSD exhibit other altered movement patterns associated with ACL injury: increased frontal plane hip motion, increased transverse plane knee motion, and decreased sagittal plane knee motion.31
Athletes were asked to remove shoes and socks prior to the test, and a sticker was placed on the athlete’s tibial tuberosity to help with visualization during the test.28 A second sticker was placed on the step just under the athlete’s second toe once they assumed the starting position to aid examiners with scoring.28 A verbal explanation of the procedure was given to the athlete, followed by a demonstration. Athletes performed five practice repetitions, followed by five consecutive test repetitions that were scored.28 The LSD was evaluated by two examiners simultaneously, and after scoring the test, both examiners came to a consensus on the final score that was recorded. This process was then repeated for the contralateral leg.
RESULTS
A total of 15 female athletes participated in the screening program (Table 1). Athletes were considered to be at a higher risk of injury when meeting the cutoff score on at least one lower extremity. Group means were calculated for each variable, excluding the measurements for hip ER and abduction strength (Figure 9). These measures were excluded due to the normalization of the data based on each individual athlete’s weight.

Range of Motion
Hip ER below 30° or a combined measurement of hip IR and ER below 75° is correlated with a higher risk of ACL injury.11 In this sample, 13/15 athletes would be considered at a higher risk of injury due to lack of internal rotation; and when examined for total hip rotation, 11/15 athletes would be considered at a higher risk of injury (Table 2). Weighted ankle DF below 41° has been correlated with a higher risk of ACL injury.12 This measure was most prevalent in the sample with every athlete meeting the high-risk cutoff score in at least one lower extremity (Table 2). Q-angle of greater than 19° has also been correlated with a higher risk of ACL injury.18 Only one athlete was found to have met this cutoff score (Table 2).
Jump Landing Strategy
A score of five or greater on the LESS has been correlated with an increased risk of ACL injury (sensitivity = 86%, specificity = 64%).19 The LESS results indicate that 10/15 athletes met the high-risk cutoff score (Table 3). The most common suboptimal landing characteristics were lack of adequate knee flexion at initial contact and excessive medial knee displacement at both initial contact and at the point of maximal knee flexion.
Muscle Strength
Hip ER strength of ≤20.3% of body weight or a hip abduction strength of ≤35.4% of body weight has been correlated with an increased risk of ACL injury.25 For hip ER strength, 13/15 athletes met the high-risk cutoff score (Table 4). For hip abduction strength, 5/15 athletes met the high-risk cutoff score (Table 4).
Previous authors have suggested that a H:Q strength ratio of less than 60% was linked with a higher risk of ACL injury.32 For H:Q ratio, 10/15 athletes met the high-risk cutoff score with a higher prevalence of imbalance in the right extremity versus the left extremity (Table 4).
Single-Leg Dynamic Balance
Quality of movement categories were determined by the score on the LSD test – good, moderate, and poor.28 Based on prior research, scores between two and six were utilized as the cut off for increased risk of ACL injury.30
A majority of the sample fell into the “moderate” category. The remainder of the sample was split evenly between the “good” and “poor” quality of movement categories, with four athletes in each. For the LSD test, 11/15 athletes met the high-risk cutoff score with two athletes scoring the maximal score of 6 which signifies altered movement patterns, poor balance, and a higher risk of injury. Furthermore, only 1/15 athletes scored a perfect score of 0 (Table 3).
DISCUSSION
The purpose of this study was to screen female high school soccer and basketball athletes for the presence of modifiable risk factors that predispose them to increased risk of sustaining a non-contact ACL injury that have been identified in the research. Numerous studies have demonstrated screening methods that have the capability to identify athletes who demonstrate many of the known anatomical, biomechanical, or neuromuscular risk factors associated with an ACL injury.11,12,18,19,25,30,32 Several of these studies have focused on screening only one or two of these risk factor components in isolation.11,12,18,19,25,30,32 There were no studies found in the literature that completed a battery of tests to identify if a female athlete was at increased risk for a non-contact ACL injury.11,12,18,19,25,30,32
Currently, many authors have focused on identifying ACL injury risk using expensive, high-technology equipment that requires extensive experience, training, and time to use, which would be difficult to implement in a community program.14,20,26,31 Radiographic measurement is considered more precise than goniometric measurements; however, this method is expensive, exposes subjects to radiation, and is not readily accessible in the environment where most screening programs would be held.14 Force plates with electromagnetic tracking systems for 3-D analysis is the ideal method to assess jump landing and ground reaction force; however, not all clinics would be able to implement the equipment utilized for analysis due to their expense and spatial requirements.20 An isokinetic dynamometer is the gold standard to assess strength, but it is expensive and space-consuming.26 Kinematic motion and quality of movement during the LSD is best visualized using 3-D motion analysis; however, this method requires training and expertise to use properly, is expensive, and is time-consuming, which makes it not ideal for use in a screening program.31 For the program to be feasible, the chosen screening methods utilized readily accessible equipment and materials that were easy to implement by SPTs. This allowed the program to be conducted in an organized and timely manner.
Biomechanical and neuromuscular components are risk factors that can be identified and modified with appropriate screening and interventions.6,33 The screening methods and interventions utilized in this program have been shown to identify and address these types of modifiable risk factors which can be easily applied to clinical practice.11,12,18,19,25,30,32 After completion of the screening program, all 15 of the participating athletes demonstrated at least four of the eight modifiable risk factors that were measured. This demonstrates that there are likely several components that each athlete could improve upon, in order to help decrease the risk of an ACL tear.
Limitations
There are several limitations with the present study that need to be considered. First, the small sample size utilized in this study is a limitation. Thus, this is described as a pilot study. Due to the population under study, proximity to the testing facility was needed to participate in data collection. In addition, coordination of transportation presented as a barrier for the parents of the subjects participating in this study. Planning in accordance with sport seasonal demands and personal time away appeared to also challenge participant recruitment. Suggestions for future research would be to plan testing in accordance with practice schedules and at a facility that is easily accessible to the athlete, such as their practice location. A second limitation is the lack of long-term follow-up with at-risk athletes to assess if an ACL injury occurred, and whether that correlated to the findings of the athletes being identified as high-risk for injury or not. It is possible that players who were identified as a higher risk for ACL injuries completed the whole season without an injury or vice versa. Future research would benefit to follow the at-risk athletes through seasonal play to determine which factors in combination predict the outcome of injury and if there is a correlation to leg dominance. This would allow researchers to determine if there is a relationship between the quantity of identified risk factors and the rate of injury risk.
CONCLUSION
The screening program utilized was feasible to implement and identified potential risk factors for injury in the cohort of female athletes studied. Prior researchers have analyzed impairments in ROM, landing mechanics, strength, and balance that increase the likelihood of ACL injuries in female athletes; however, no screening programs have investigated these categories together to identify female athletes at elevated risk for an ACL tear. All the studied athletes were found to have at least one factor that could lead to risk of ACL injury. This pilot study provides clinicians with a battery of tests and measures that are quick to perform, inexpensive, and do not require extensive experience.
DISCLAIMERS
This study protocol was approved by the Institutional Review Board of Walsh University (#2021007). The authors report no conflicts of interest or financial compensation in the completion of this study.
ACKNOWLEDGEMENTS
The authors would like to thank the additional SPT volunteers that assisted in the completion of this program.