INTRODUCTION
Overuse injuries of the lower extremities are common in runners,1 with patellofemoral pain (PFP) reported as the most frequently occurring condition.2 Females have been found to be more than two times more likely to develop PFP when compared to males.3 Multiple theories for the development of PFP have been proposed, including motor performance deficits, movement coordination deficits, mobility impairments, and over-training, but PFP is likely the result of multifactorial contributions.4,5 PFP can often become chronic, with up to 91% of individuals reporting continued pain 4-18 years after the initial diagnosis.6
Sensitization of the nervous system has been proposed as a mechanism to explain chronic musculoskeletal pain.7–10 Both peripheral and central sensitization mechanisms may contribute to enhanced nociceptive drive beyond that seen with typical tissue injury.11 Peripheral sensitization is described as the increased responsiveness and reduced threshold of nociceptive neurons in the periphery to the stimulation of the of their receptive fields; whereas central sensitization is defined as the increased responsiveness of nociceptive neurons in the central nervous system to normal or subthreshold afferent input.12 The chronicity of PFP symptoms may be, in part, explained by changes in sensitization of the nervous system in some individuals.
Pain is highly subjective and is influenced by individual differences in pain perception, and typically assessed clinically through a pain intensity scale.13 One limitation to using a pain intensity scale includes the variability of patient interpretation of pain measurement.14 Quantifying pain is challenging due to the subjective nature of each individual’s pain experience.15 Objective assessment of nervous system sensitivity can be conducted through quantitative sensory testing (QST) via thermal or mechanical measures. QST is a noninvasive way of assessing and quantifying sensory nerve function.16 QST can objectively measure the central and peripheral components of pain, and can detect the facilitation and inhibition of pain.15
Numerous QST measurement tools have been described17–21 including pressure pain threshold, heat pain threshold, temporal summation, and conditioned pain modulation. Mechanical pressure pain threshold is utilized to assess the functioning of A-delta fibers.22 Both local and remote structures can be tested, with primary hyperalgesia determined through increased sensitivity at the site of the injury, and secondary hyperalgesia determined through increased sensitivity at sites remote from the site of injury. The presence of widespread mechanical hyperalgesia is suggestive of a centrally-mediated facilitation mechanism of chronic pain.23 Heat pain threshold testing is also utilized to assess the functioning of A-delta fibers.24 Temporal summation is used to assess the functioning of C-fibers and is a measure of pain facilitation.24 Conditioned pain modulation paradigms are designed to assess for an impairment in pain inhibition.18,22,25 Central nervous system sensitization can be inferred through QST by the presence of secondary hyperalgesia26 or enhanced pain facilitation.18
Several authors have reported signs of central sensitization in individuals with PFP as assessed through QST.27–34 The QST measurement method utilized in a majority of these studies utilized mechanical pressure pain threshold testing. Of these, only Holden et al.27 included temporal summation and conditioned pain modulation (through cuff pressure algometry), and two studies included heat pain threshold and cold pain threshold testing.28,29 No identified studies reported on the QST measures of pressure pain threshold (for the presence of primary and secondary hyperalgesia), heat pain threshold (for the presence of primary hyperalgesia), temporal summation (for the presence of impaired central pain facilitation), and conditioned pain modulation (for the presence of impaired descending inhibition) in patients with PFP. Additionally, of these identified studies, only Pazzinatto et al.32 controlled for the activity level of subjects and found evidence for lower local and remote pressure pain threshold values in female runners with PFP. In female runners with chronic PFP, heat pain threshold, temporal summation, and conditioned pain modulation findings have not previously been investigated, nor compared with healthy controls.
The relationship between pain and functional performance remains poorly understood. Individuals with greater localized hyperalgesia (due to peripheral sensitization) from chronic lower extremity conditions have been shown to exhibit impaired lower extremity mechanics that are believed to be related to increased nociceptive input.30 It has been proposed that movement changes which persist beyond the original protective phase of injury may lead to changes in function and further affect recovery.35 A lack of evidence exists for the association of functional performance with measures of primary hyperalgesia in female runners with chronic PFP.
The primary objective of this pilot study was to quantify and compare pain sensitivity as identified through QST measures, in active female runners with and without PFP. This information will help clinicians and researchers understand which of these QST procedures may be more sensitive to differences in pain between groups. A secondary objective was to determine if there was an association between a dynamic lower extremity functional performance measure and measures of pain sensitization.
METHODS
Twenty healthy, pain-free female runners and 20 female runners with chronic PFP symptoms were enrolled for this pilot research study from April 2017 through January 2018. No formal power analysis was performed for this pilot study. Twenty subjects in each group were selected based on similar studies which compared pressure pain threshold values in patients with PFP.32,36 A convenience sample of subjects were recruited from the university community, local running clubs, and local running shoe stores via advertisement flyers and social media postings. The study protocol was approved by the Institutional Review Boards of Arcadia University and Rutgers, The State University of New Jersey. All subjects gave informed consent to participate in this study.
Inclusion criteria for all subjects included female sex, age between 18-45 years, and a self-reported involvement in running activity for a minimum of one hour per week. A time-based criterion for running activity was selected to standardize a minimal amount of joint loading time, versus a distance-based criterion. The upper age limit of 45 is consistent with the typical clinical presentation of patients with PFP, and to control for possible effects of degenerative joint disease.37 Inclusion criteria for both groups also included intact skin (no cuts or abrasions to the lower legs that would interfere with the testing), intact sensation via verbal self-report by the subject, and the ability to converse, read, and write in English. Subjects were excluded if they reported a recent musculoskeletal injury that limited participation in running over the prior two weeks, a history of any neurological condition that may affect sensory perception, the presence of any other acute or chronic pain conditions, and use of prescription medication for pain or psychological conditions, as such medications may affect pain perception. Subjects were instructed to not take any over-the-counter pain medication for 24 hours prior to testing.
For the PFP group, inclusion criteria included unilateral or bilateral knee pain of at least 3/10 (during running), pain for at least six weeks prior to enrollment, and clinical examination findings indicative of PFP (e.g., anterior, retropatellar, or peripatellar pain, pain reproduction with knee loading activities or prolonged knee flexion, atraumatic onset, exclusion of other knee pathologies).5 Subjects were initially screened by phone to confirm their anterior knee or retropatellar pain was of an insidious onset for a minimum of six weeks. Additional screening included the presence of knee pain symptoms provoked by at least two of the following activities: prolonged sitting or kneeling, squatting, running, hopping, or stair climbing; and pain intensity with running in the previous week of at least a 3/10 on the Numeric Pain Rating Scale (NPRS). Prior to the initial testing session, subjects in the PFP group underwent a physical examination by a physical therapist to rule out other knee joint injuries such as ligamentous, tendon or meniscal injury, and to confirm the presence of PFP. Presence of PFP was confirmed if pain was reproduced or worsened with any activities that served as diagnostic criteria for PFP.5
Questionnaires
All subjects completed the Knee injury and Osteoarthritis Outcome Score for Patellofemoral Pain and Osteoarthritis (KOOS-PF), the Brief Pain Inventory short-form (BPI), and the University of Wisconsin Running Injury and Recovery Index (UWRI). The KOOS-PF has been shown to be a valid and reliable self-report measure for patients with PFP.38 This is an 11-item knee-specific outcome scale, with a high score of 100 indicating no limitation with daily function and sport activity in addition to the absence of symptoms, and 0 indicating extreme limitations. The KOOS-PF has good test-retest reliability38 and has a published minimally important change of 14.2 points.39
The BPI has been shown to be valid and reliable for measuring pain severity and impact on function.40 It is a nine item self-report questionnaire, which is scored in two parts: pain severity and pain interference. Both parts of the BPI are calculated out of a maximum of 10 points. For pain severity, a 0 indicates no pain and a 10 indicates pain “as bad as you can imagine”. For pain interference, a 0 indicates no interference and a 10 indicates that pain completely interferes with activity. The minimum clinically important difference (MCID) for the pain severity score has been found to be 2.2 points in patients with fibromyalgia.41 No published MCID for BPI interference score has been identified in the literature.
The UWRI has been shown to be a valid and reliable patient-reported outcome measure to assess issues related to injury recovery, frustration, and training progression following a running related injury.42,43 It is a nine question self-report measure, with a maximum possible score of 36 which indicates no deficit in running ability, with lower scores indicating a greater limitation in running ability. The MCID for the UWRI has been found to be eight points.43
Functional Testing
Quantification of lower extremity functional performance was conducted via the Y-Balance Test-Lower Quarter (YBT-LQ) utilizing the YBT testing kit (Move2Perform, Evansville, IN). Testing of the YBT-LQ was performed following procedures previously published utilizing this measure.44 The YBT-LQ has been described as integrating strength, flexibility, neuromuscular control, stability, range of motion, balance, and proprioception.45 A significant positive correlation has been shown between the YBT-LQ and hip abduction strength.46 The YBT-LQ has demonstrated excellent inter- and intra-rater reliability in healthy individuals.47
Quantitative Sensory Testing
All QST measurements were performed by the primary investigator. For pressure pain threshold testing, subjects were positioned supine on a plinth with the knee in full extension, and a handheld pressure algometer with a 1 cm2 tip (Wagner Instruments, Greenwich, CT) was used to apply increasing amounts of pressure (~1kg/sec) to each testing site bilaterally. The force was withdrawn as soon as the subject reported that the sensation changed from pressure to pain. Two trials were performed at each location with a minimum of 30 secs of rest in between, with the mean of the two trials used for data analysis. At the knee, two sites were tested: the center of the patella and lateral retinaculum.33 The location of the center of the patella was determined by measuring the midpoint in the medial-lateral and superior to inferior direction and determining the center. For the lateral patella retinaculum, a point 2 cm lateral to the lateral border of the patella was used. Two sites along the medial aspect of the tibia were also tested. Tibial sites were determined from a measurement from the distal tip of the medial malleolus to the medial tibial condyle. The length of the tibia was divided into thirds, with the distal third and proximal third measurement utilized for pressure pain threshold testing. Additionally, pressure pain threshold testing was performed at the mid-portion of the patellar tendon (mid-point between the inferior pole of the patella and tibial tubercle) and at mid-quadriceps muscle belly (midline of the anterior thigh, midway between the iliac crest and the superior border of the patella). The patella tendon pressure pain threshold measurement was performed with the subject’s knee flexed to 90 degrees. Pressure pain threshold testing order was performed in the following standardized sequence: right distal tibia, left distal tibia, right central patella, left central patella, right proximal tibia, left proximal tibia, right patellar lateral retinaculum, left patellar lateral retinaculum, right mid-quadriceps, left mid-quadriceps, right patella tendon, left patella tendon. This order was chosen to alternate between extremities to allow adequate time for wash-out between pain testing, and to provide for separation of potential cutaneous dermatome overlap.
Thermal heat testing was performed using a computer-controlled contact thermode (TSA-II Neurosensory Analyzer, Medoc, Ramat Yishai, Israel) which was fastened to the anterolateral aspect of the knee at the tibiofemoral joint line. The subject was seated in a chair with the dominant (healthy group) or most painful leg (PFP group) extended, facing away from the computer monitor. The temporal summation test consisted of 10 heat pulses which rise rapidly from 42-51°C at 10°C/second at a rate of one pulse every three seconds. During this test, the participant rated their perception of pain intensity for each of the 10 heat pulses using a rating scale following prompts by the investigator. This scale consists of a 100mm line with descriptor anchors attached (0mm = no pain, 20mm = pain threshold, 100mm = worst pain imaginable) which was adapted from Staud et al.48 For the heat pain threshold test, the thermode temperature started at 35°C and increased at a rate of 0.5°C/second until the participant indicated a change from perception of warmth to the perception of pain by clicking a mouse to stop the test; or when the temperature reached a maximum of 51°C, whichever came first. Following a 60-second rest the test was repeated.49 The mean value of the two trials was used for data analysis.
For the conditioned pain modulation test, subjects were seated with both feet on the floor. A cold water bath with a circulating pump was maintained at a temperature of 6° C and monitored by a digital thermometer. An initial pressure pain threshold rating was recorded at the tibialis anterior on the dominant (healthy group) or most painful lower extremity (PFP group). The anterior tibialis location was the midpoint distance as measured from the medial malleolus to the lateral joint line of the knee. Subjects then placed their dominant hand into the cold water bath for one minute, with subsequent pressure pain threshold measurements recorded at the tibialis anterior 30 and 60 seconds while the was hand submerged. The subject was also asked to report the pain rating at its worst in their hand while submerged at 60 seconds on a 10cm visual analog scale. A standardized video of ocean waves was shown to subjects on a separate computer monitor during the conditioned pain modulation test. This was to provide the subjects with something to look at for distraction from the discomfort while their hand was submerged in the cold water bath.50,51
Statistical Analysis
Statistical analysis was performed with SPSS version 26 (IBM Corporation, Armonk, NY). Means, standard deviations, and/or confidence intervals were calculated for each outcome variable and examined for normality using graphical approaches. Comparison of between-group data were performed with independent t-tests. The most painful knee was utilized for data collection for those in the PFP group with bilateral symptom complaints (n=4). For the healthy control group, no significant difference was found between extremities for the healthy control group for all pressure pain threshold sites, so the dominant extremity was utilized for comparison with the involved extremity of the PFP group. For all statistical calculations, a p value < 0.05 was considered significant. Effect sizes for QST measures (Pearson’s r) from the independent t-tests were calculated, with the following interpretation: ≥ 0.1 a small effect, ≥ 0.3 a medium effect, and ≥ 0.5 a large effect. Correlations between pressure pain threshold values at the knee and functional testing were assessed via Pearson’s correlation coefficient.
RESULTS
From September 2017 through June 2018, a total of 40 subjects (20 with PFP and 20 healthy controls) participated in the study. Three subjects with PFP were excluded from data analysis, as they had reported a past knee surgery (two with a prior anterior cruciate ligament reconstruction and one with a medial meniscus repair). A total of 17 subjects with PFP and 20 healthy controls were included in the final analysis (Table 1). The participant characteristics are presented in Table 1. There were no significant differences between groups for age (t(35)= -1.735, p=0.091), BMI (t(35)= 1.208, p=0.235), years of running (t(35)= -.599, p=0.553), and average weekly running mileage (t(35)= -.933, p=0.357).
Table 2 presents the between group comparison of pain and self-reported function. There was a significant difference between groups for worst pain (t(35)=4.655, p<0.001), pain severity score (t(35)=5.064, <0.001), and pain interference score (t(35)=3.365, p=0.002), with a large effect for worst pain (r=.619) and pain severity score (r=.650) and medium-to-large effect for pain interference score (r=.495). Significant and very large differences were found for the self-report functional outcomes of KOOS-PF (t(35)=12.676, p<0.001, r=.906)) and UWRI (t(35)=-7.882, <0.001, r=.800).
For QST testing, a significant difference was found at all sites tested for pressure pain threshold between the PFP group and healthy controls (Table 3). A lower value on pressure pain threshold is indicative of an increase in sensitivity of the tested structure. Both local (patellar retinaculum, patellar tendon, and central patella) and remote sites (mid-portion quadriceps, distal tibia, and proximal tibia) were significantly different between groups with a medium to large effect sizes. No significant difference was detected for heat pain threshold (t(35)=-12.69, p=0.213), temporal summation (t(35)=-.544, p=0.590), or conditioned pain modulation (t(35)=.230, p=0.819) between groups (Table 3).
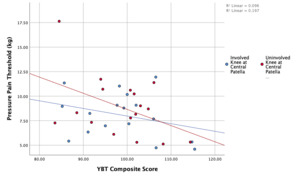
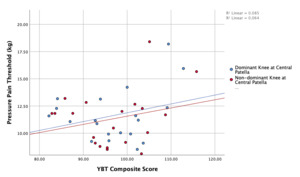
In terms of lower extremity functional performance as assessed via the YBT-LQ, no significant difference was found between groups for anterior reach distance, posteromedial reach distance, posterolateral reach distance, or composite score (Table 4). A weak and non-significant relationship was found for YBT-LQ composite score and pressure pain threshold at the central patella for the involved knee (r=-.310, p=0.227) and uninvolved knee (r=-.161, p=0.538). Additionally, a weak and non-significant relationship was found for YBT-LQ composite score and pressure pain threshold at the central patella for the dominant knee (r=.292, p=0.211) and non-dominant knee (r=.253, p=0.281). A scatterplot summarizes the correlation results in Figure 1 and 2.


DISCUSSION
Compared to healthy controls, female runners with chronic PFP symptoms exhibit signs of both peripheral sensitization, via reduced pressure pain threshold to sites local to the knee, and central sensitization, as determined through reduced pressure pain threshold to remote sites in the lower extremities. These widespread findings of hypersensitivity at remote sites from the involved knee is commonly interpreted as resulting from central sensitization.18,52,53 The additional QST measures of heat pain threshold, temporal summation, and conditioned pain modulation were not found to be significantly different between those with and without PFP symptoms.
Primary hyperalgesia, a sign of peripheral sensitization, was indicated through the reduced pressure pain threshold at local structures of the involved knee, which in this study included the central patella, patella retinaculum, and patella tendon. Additionally, secondary hyperalgesia, a sign of central sensitization, was determined through the reduced pressure pain threshold values at remote sites from the involved knee, which included the involved and uninvolved distal tibia, proximal tibia, and mid-portion quadriceps, and uninvolved central patella, patella retinaculum, and patella tendon. Pressure pain threshold values were found to be significantly lower at all locations tested in both the involved and uninvolved lower extremities of the PFP group when compared to the healthy control group. This widespread hyperalgesia suggests that central sensitization may contribute to the chronic pain state in females with patellofemoral pain. Such nervous system sensitization has been demonstrated in other lower extremity musculoskeletal conditions such as osteoarthritis,54 patellar tendinopathy,55 and Achilles tendinopathy.56
The results of this study are similar to findings from two recent systematic reviews and meta-analyses which found the presence of pain sensitization in patients with PFP as assessed with pressure pain threshold.57,58 A medium to large effect was found for decreased pressure pain threshold at all sites, both local and remote, in female runners with chronic PFP. Conclusions from Bartholomew et al.57 similarly noted a medium effect for pressure pain threshold local to the knee and small effect distal to the knee. Contrary to these findings, Rathleff et al.51 did not find evidence for an impaired pain state in individuals with PFP with pressure pain threshold measures. Rathleff et al51 included both males and females in their study which may have affected their findings as females have been shown to exhibit lower pain thresholds (thermal and mechanical) as compared to males.59,60 Increased pain sensitivity in females may be suggestive of a less efficient endogenous pain mechanisms in females.61 More research is needed to help understand the link between sex and increased pain sensitivity.
Regarding heat pain threshold, temporal summation, and conditioned pain modulation, there were no significant differences found for these measures between females with chronic PFP symptoms and healthy controls. QST measures can provide information about the processing of sensory inputs and the facilitation or inhibition of the nervous system.15 While differences were found in pressure pain threshold, a mechanical stimulus which targets A-delta fibers,24 the other QST measures did not achieve statistical significance between groups. Different QST tools are often used to assess different pain pathways. The lack of significant findings, aside from pressure pain threshold, between groups may be explained by the lack of disability (via KOOS-PF scores) in the current study population or the fact that PFP symptoms may not necessarily affect all pain pathways.
Heat pain threshold was not found to be different between groups in this study. This result is similar to two studies that compared heat pain threshold at the involved knee of subjects with PFP to both the uninvolved knee and healthy controls.28,29 Hence, differences in heat pain threshold may not be present in individuals with chronic PFP symptoms. Thermal sensory deficits in the painful region are commonly found in patients who present with neuropathic pain,62 and the lack of difference with thermal testing in this study may indicate that neuropathic pain symptoms were not prevalent in the this group of subjects with PFP.
Temporal summation is another potential sign of central sensitization.48,63 Impaired temporal summation of pain levels have previously been demonstrated in individuals with fibromyalgia,48 osteoarthritis,64 temporomandibular disorder,65 and migraine headache.66 No significant difference was found between groups in temporal summation in this study. Two previous studies assessed temporal summation via cuff pressure in patients with PFP but reported conflicting results.27,67 Rathleff et al.67 found no between group difference in female subjects with PFP compared to pain-free controls, whereas Holden et al.27 reported a significant difference in elevated temporal summation pain levels (effect sizes were not reported in either study). Similar to this study, Rathleff et al.67 included subjects with PFP of which 80% were currently involved in sports despite their pain. Perhaps maintaining an individual’s activity level may help to modulate this measure of central facilitation. Additionally, the elevated temporal summation levels reported by Holden et al.27 may be attributed to the high chronicity rate of subjects with PFP (subjects with a mean of 8 years duration of symptoms) compared to this study and Rathleff et al.67 Facilitated central pain mechanisms have been shown to worsen with a greater duration of symptoms.68
Impaired conditioned pain modulation is indicative of impaired descending inhibition of pain. The inability of a noxious conditioning stimulus to increase pain thresholds may signify a potential deficiency in the body’s endogenous pain modulation system.67 No significant difference was found for conditioned pain modulation using cold water immersion between groups in this study. These findings are similar to those published on individuals with PFP by Rathleff et al.51 who also used cold water immersion for the conditioned stimulus, but in contrast to the results of Rathleff et al.67 and Holden et al.27 who did find impaired conditioned pain modulation utilizing cuff pressure as the conditioned stimulus. The differences in methodology of the noxious conditioning stimulus may explain the inconsistent findings for impaired conditioned pain modulation in patients with PFP. Oono et al.69 found that conditioned pain modulation paradigms with different noxious stimuli may yield different results.51 Less efficient conditioned pain modulation has been reported in other chronic musculoskeletal pain conditions such as chronic low back pain,70 neck pain,71 and temporomandibular disorders.72 This study found no difference in conditioned pain modulation, which may have been offset by the high level of physical activity of the participants with PFP. Engagement in cardiovascular exercise and knee-loading activity may help minimize impairments in descending pain inhibition.
There was a significant difference in pain rating between a group of healthy controls and subjects with chronic PFP, which was expected as the inclusion criteria consisted of a minimum pain rating at worst of 3/10 on the NPRS. Additionally, the BPI pain severity score and BPI pain interference score were significantly worse in the PFP group. These differences between groups suggest indirect evidence of a relationship between subjective pain rating and functional scores. Both the KOOS-PF and UWRI, subjective measures of functional ability, demonstrated significant differences between groups. Even though the subjects with chronic PFP symptoms continued to engage in running activity, their scores on these scales reflect measurable impaired function. A large effect for KOOS-PF and UWRI were found between groups.
A secondary objective of this study was to determine if there is an association between a dynamic lower extremity functional performance measure and quantitative measures of pain. The YBT-LQ was included as a measure of functional performance due to its ease of application, good test-retest reliability, and applicability to the athletic population, in addition to being positively correlated with hip abduction strength.46 Decreased hip force production, including hip abduction) has been demonstrated in individuals with PFP.5 Since the only significant measure between groups was pressure pain threshold, functional performance on the YBT-LQ was compared with pressure pain threshold values at the central patella. The central patella location was the predominant location of pain in the PFP group and exhibited the largest effect size. No significant association was found between YBT-LQ anterior reach and pressure pain threshold values at the center patella in either group. For correlation between pressure pain threshold at the central patella and YBT-LQ scores, there was a negative correlation for subjects in the PFP group and a positive correlation for the subjects in the heathy group. The YBT-LQ may not be effective in identifying movement dysfunction in subjects with chronic PFP symptoms. Further research is need to better understand the influence of pain on movement.
There was also no significant difference in reach distance or composite score between the PFP and healthy control groups. Although the YBT-LQ was designed to predict lower extremity injury,73 this test was not able to discriminate between female runners with and without PFP symptoms. For the anterior reach portion on the YBT-LQ, there was a lack of significant difference between groups. In addition, the mean anterior reach difference between sides was less than 3cm for both groups in this study. The lack of a significant difference and clinically meaningful difference in the anterior reach portion of the YBT between the PFP group and healthy control may be explained by the fact that the knee pain may not have been high enough to contribute to alterations in lower extremity functional movement.
Limitations of this study include the small sample size and lack of pressure pain threshold assessment outside of the lower extremity. Three subjects with PFP were excluded from data analysis due to a history of prior knee surgery, which affected the overall sample size in this study. Due to the potential structural changes from the surgery and possibility that their knee symptoms may be related to their surgery, it was determined post hoc to exclude them from analysis. Heat pain threshold was not assessed outside of the local site of pain. A standardized temperature for temporal summation testing was utilized for all subjects, whereas an individually determined value for peak temperature in the temporal summation test may have provided different results. Formally assessing strength of the lower extremity via hand held dynamometry or isokinetics, may have yielded better insight on the strength of the lower extremity musculature as opposed to the YBT-LQ. Other functional performance tools should be considered in future investigations to help determine if subjects with chronic musculoskeletal present with impaired movement patterns.
CONCLUSION
The findings of this study provide additional evidence for the use of pressure pain threshold to help determine the presence of signs of peripheral and central sensitization in individuals with chronic PFP. Physical therapy management may need to consider interventions which address the signs of central sensitization in order to achieve optimal outcomes and recovery. Future studies should focus on investigating what interventions may lead to favorable changes in nervous system sensitization specifically for runners with chronic knee pain complaints.
Female runners with chronic PFP exhibit signs of both peripheral and central sensitization through pressure pain threshold testing. However, the presence of impaired central pain facilitation and descending pain inhibition were not evident in a population of active female runners with chronic PFP symptoms. Thus, interventions to address the nervous system sensitization may be needed in some patients in order to achieve optimal outcomes.
CONFLICTS OF INTEREST
The authors have no conflicts of interest to disclose.