INTRODUCTION
Anterior cruciate ligament (ACL) injury poses a significant risk to individuals participating in cutting and pivoting sports.1 ACL injury is debilitating as it often requires reconstructive surgery, intense rehabilitation, and a time loss from sport of nine months or greater.2 Despite completion of rehabilitation, 20% to 30% of individuals returning to sport will sustain a second ACL injury.3,4 Traditional measures of motor function (i.e., strength and hop performance) may not accurately predict patient function,5 warranting the investigation of other systems, such as the central nervous system (CNS).6 Individuals after ACL reconstruction (ACLR) have alterations in the brain’s blood oxygen level dependent (BOLD) response within sensorimotor regions of the brain during basic knee movement.7–9 The BOLD response is a hemodynamic function which measures the oxygen consumption in a given brain region, and directly reflects the neurologic activity occurring due to local input and processing.10,11 This BOLD response has been associated with patient reported functional outcome measures after ACLR9 but has yet to be linked with other aspects of patient function, such as biomechanical performance. Restoration of functional movement patterns is an aspect of patient function vital to recovery following ACLR.2 Movement patterns are often quantified with biomechanical analysis and abnormal biomechanics are a key indicator of dysfunctional motor control within the CNS.12,13 Resolving movement pattern dysfunction through neuromuscular training is a high priority for individuals following ACLR,2 yet movement patterns remain dysfunctional for years.14,15 Determining an association between CNS activity and more dynamic movement control may provide insight on the neurologic mechanisms underlying prolonged movement dysfunction following ACLR.
The BOLD response in bilateral motor cortex (M1), ipsilateral secondary somatosensory area, and lingual gyrus is altered in individuals who are on average three years following ACLR.8 Researchers have prospectively identified connectivity patterns in the brain’s BOLD response which differentiate high school athletes who sustain a future ACL injury and those who do not.16,17 Despite the growing body of literature to support altered CNS function in association with future ACL injury16,17 and ACLR,8,18 there is a missing link between the brain’s BOLD response and biomechanical performance. Evidence indicates that musculoskeletal indicators of function, such as strength, may not fully explain the loading deficits in an individual’s involved knee which start immediately after surgery, continue throughout rehabilitation, and remain years after returning to full activity.19,20 The negative biomechanical consequences of ACLR have been reported through systematic reviews evaluating gait,21 running,22 and landing biomechanics.23 These tasks are functionally relevant but lack a targeted application to cutting and pivoting sports where ACL injuries are most prevalent.1 A recent narrative review24 highlighted the need to increase testing for change of direction (CoD) movements following ACLR due to their frequent performance in sports such as football, soccer, and basketball, among others.24–26 The long-term negative impact to knee joint loading biomechanics after ACLR is well documented, but less is known about how manipulating sensory information (i.e., visual) during movement affects joint loading in sports-relevant tasks.
ACL injury impairs mechanoreceptor function inherent to the ligament, disrupting afferent input to the primary somatosensory cortex (S1).27 Restoration of this somatosensory signaling to S1 after ACLR, and the CNS’s ability to interpret the signal, is unclear.28,29 Vision and somatosensory input are complementary sources of sensory information used to support motor control.30 Vision may be more heavily relied upon when somatosensory input is dampened as vision is able to adapt more quickly to changes in stimuli than vestibular input.31 For individuals with altered somatosensory input after ACLR, the addition of a visual perturbation reduces available sensory information which may negatively impact the brain’s ability to regulate motor control. Disrupting visual sensory information can be accomplished with stroboscopic goggles which intermittently restricts vision and is known to impact landing biomechanics.32 The effect of stroboscopic perturbation on CoD movements is unknown and determining its impact on biomechanics will provide insight on how vision influences key indicators of knee and lower extremity function during highly dynamic, sport relevant movement.
The purpose of this study was to investigate the relationship among CNS function and lower extremity kinetics, under multiple visual conditions, during 180° change of direction task in individuals with a history of ACLR. The primary hypothesis was that there would be distinct neural correlates of sagittal and frontal plane limb loading in the motor cortices during FV and in regions within the parietal and occipital cortices during the SV condition. The secondary hypothesis was that limb loading strategies would differ between the FV and SV conditions.
METHODS
Subjects
Eight individuals after primary, unilateral, left ACLR participated in this specific study as part of a larger cross-sectional investigation.8 Individuals signed informed consent prior to participation and the study was approved by Ohio State University Institutional review board. Individuals were screened for participation with the following inclusion criteria: primary left ACLR, Tegner level of activity ≥ 5, cleared for return to full activity, no lower extremity injury in the prior six months, no history of lower extremity injury besides primary ACLR, and normal or corrected to normal vision. Participants were cleared for return to full activity by their surgeon, but neither objective return to activity testing nor time-based discharge criteria were controlled for in this study. Injury was defined as anything causing a time loss from activity for at least one day. Individuals were excluded for the following reasons: multiligament injury, prior orthopedic surgery besides ACLR, known neurologic condition, pregnancy, and right ACLR. Movement from one side of the body can elicit a negative BOLD response in ipsilateral sensorimotor cortex and a positive response in contralateral sensorimotor cortex, therefore participants were excluded based on ACLR laterality to avoid confounding BOLD response across hemispheres.33 Participant demographics can be viewed in Table 1.
Biomechanics Data Collection Procedures
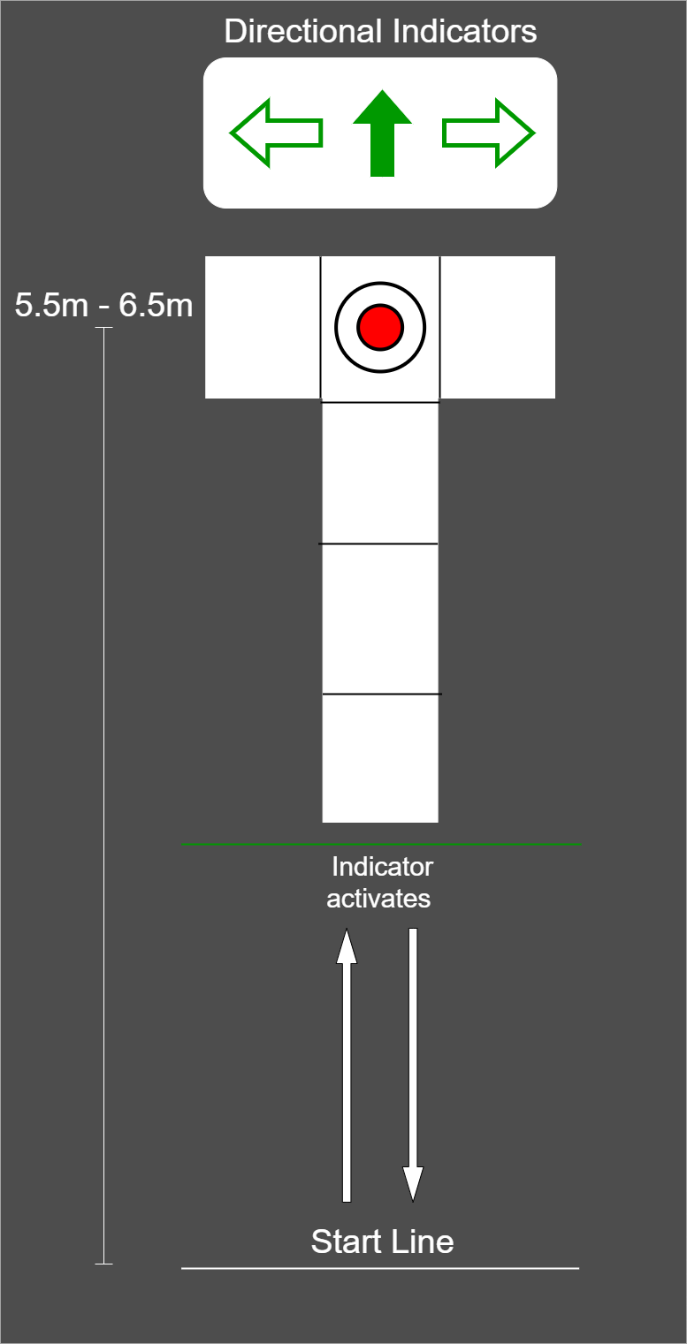
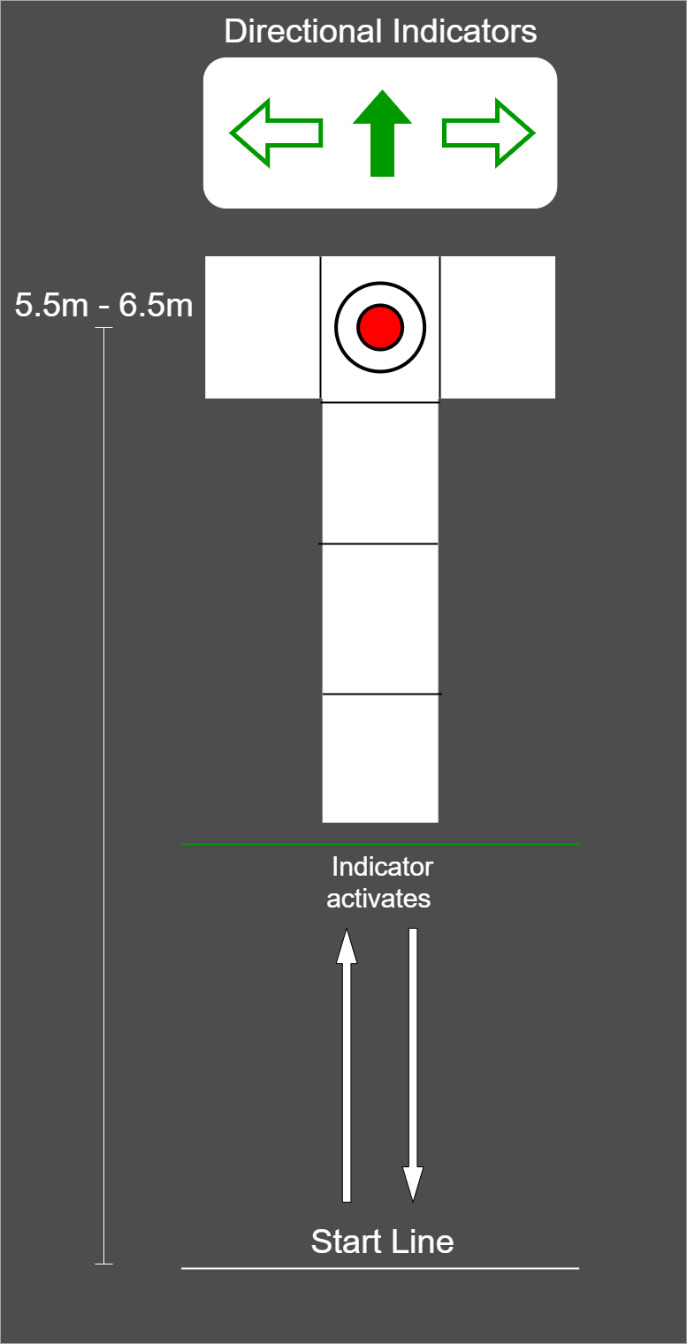
Participants performed three-dimensional (3D) motion analysis testing and a functional magnetic resonance imaging (fMRI) scan within one week, a majority of participants performed both testing sessions within two days of one another. Lower extremity kinematic and kinetics were captured during performance of a run-pivot task. Kinematic data were tracked with a 10-camera 3D motion analysis system, at 240Hz (Vicon model MX-F40; Los Angeles, CA). Retroreflective markers were placed directly over the skin on specific anatomic locations, including the pelvis, thigh, shank, and foot, consistent with the point cluster marker set.32,34,35 Ground reaction force data were simultaneously captured using three embedded 40cm x 60cm platforms (Bertec Corporation, Columbus, OH; 1500 Hz). For the change of direction (CoD) task, participants began 5.5 to 6.5 meters away from the force platforms and the starting distance was modified to accommodate each individual’s stride length so contact with force platforms occurred at the same stride number for each participant (Figure 1). Participants performed all trials in full vision (FV) first, followed by trials under stroboscopic visual (SV) perturbation (SPARQ Vapor stroboscopic goggles, Nike, Inc, Beaverton OR) until 3 successful trials were captured on each lower extremity. The SV goggles oscillated between opaque (lasting 43ms) and transparency (lasting 100ms). Participants were aware of which lower extremity would make contact with the force plate target, but were unaware of whether to perform a 45° or 180° CoD until the directional indicators illuminated. The directional indicator illuminated when participants were halfway between the start line and force plate target. Up arrow indicated a 180° CoD, horizontal arrows indicated a 45° CoD towards the side opposite of the foot contacting the force plate target (right arrow = 45° CoD to the right, planting on the left foot). The average of three pivot trials, in both the FV and SV condition, were used for subsequent analysis.
Biomechanical Data Analysis
Biomechanical data analysis was performed in Visual 3D (v6.03.3 Professional, C-Motion, Inc., Germantown, MD). Variables of interest [peak vertical ground reaction force (vGRF), peak internal knee adduction moment (pKAM), peak internal knee extension moment (pKEM), peak knee flexion angle (PKFA)] were extracted using a custom MATLAB code (R2021b, MathWorks, Natick, MA, USA) and were body weight normalized. Data were analyzed during the weight acceptance phase only, defined as initial contact (IC) to peak knee flexion angle of the ACLR limb. A matched low-pass Butterworth filter was applied at 15Hz to filter both kinematic and kinetic data, methods that have been used previously.32 To determine the influence of the stroboscopic condition on biomechanical performance, a strobe effect change score was calculated by the following equation:
Strobe Effect Change Score (SECS): SV − FVabs(FV)⋅100
where = strobe vision performance, = full vision performance, and = absolute value. Three values (FV performance, SV performance and strobe effect change score) for each variable of interest were demeaned and included as explanatory variables in the follow-up neural correlate analysis. Three paired samples t-tests were conducted using STATA (StataCorp LLC, College Station, TX) to determine if group average vGRF, pKEM, or pKAM were statistically different across visual conditions. Two follow-up paired t-tests were performed to compare pKEM of the involved and uninvolved limbs. Other biomechanical variables are provided for reference in the results section and reported as descriptive, but statistical testing was not performed.
fMRI Data Collection
A 3 Telsa MAGNETOM scanner (Siemens AG, Munich, Germany) with a 12-channel head coil was used for fMRI data collection. A T1 weighted anatomical scan was collected at TR = 2000ms, TE = 4.58ms, field of view (FoV) = 256mm, slice thickness = 1mm for a total of 176 slices. BOLD signal was captured during functional data collection using 90 whole brain gradient echo scans (TR = 3000ms, TE = 30ms, 2.5mm slice thickness, 55 total transverse slices, voxel size = 2.5mm3, FoV = 256mm). Participants performed a repetitive active knee flexion/extension task from full knee extension to approximately 45° of flexion, at a 1.2 Hz frequency or roughly 36 cycles per 30 second block, while in the scanner. Each movement block was separated by 30 seconds of rest, participants performed four blocks of movement and five blocks of rest.8
fMRI Pre-Processing & Analysis
Pre-processing steps were performed in FSL (5.6.0, FMRIB, Oxford, UK) including brain extraction using BET, MCFLIRT motion correction,36,37 Gaussian kernel 5mm spatial smoothing, and high-pass temporal filtering at 90 Hz.38,39 Denoising and reduction of signal variation secondary to motion was completed using an Independent Component Analysis for Automatic Removal of Motion Artifacts (ICA-AROMA).40,41 Functional images were registered to the high resolution anatomical image for each participant and structural normalization to Montreal Neurological Institute template 152 was performed using 12 degrees of freedom. Whole brain images were collected during the functional run and BOLD signal during the movement block was contrasted against the rest block using fixed effects at the subject level. A one sample t-test was used to determine group level BOLD signal exceeding a z-statistic threshold of 3.1 and cluster corrected to p = .05 using Gaussian Random Field Theory. A binarized mask was then created from the group average voxels identified as significantly active during the movement vs. rest contrast. This step was performed to include only voxels significantly active during the task in our subsequent neural correlate analysis. General linear models (GLM) were created using FMRIB’s Local Analysis of Mixed Effects (FLAME) 1 + 2 with biomechanical variables entered into the model as explanatory variables. Nine GLMs were performed, with a separate de-meaned biomechanical variable entered in each iteration of the GLM (Model 1: FV pKEM, Model 2: SV pKEM, Model 3: pKEM SECS, etc.). Each GLM creates a parameter estimate which fits the biomechanical variable to BOLD signal in each voxel. Parameter estimates are transformed into z-statistics and the correlate analysis identifies associated fluctuations in BOLD signal and the biomechanical variable. A z-statistic threshold of 3.1 and voxels cluster corrected at p = .05 using Gaussian Random Field Theory was again applied for each GLM.
RESULTS
Lower extremity biomechanical performance
vGRF, pKAM and PKFA were not different between visual conditions (Table 2). pKEM was lower in the SV condition compared to the FV condition (Table 2, p=0.018). When comparing the involved to uninvolved limb performance, pKEM was not different in either the FV or SV conditions (Table 4). Kinetic and kinematic values for the uninvolved limb are provided to characterize cohort performance (Table 3).
Neural Correlate Analysis
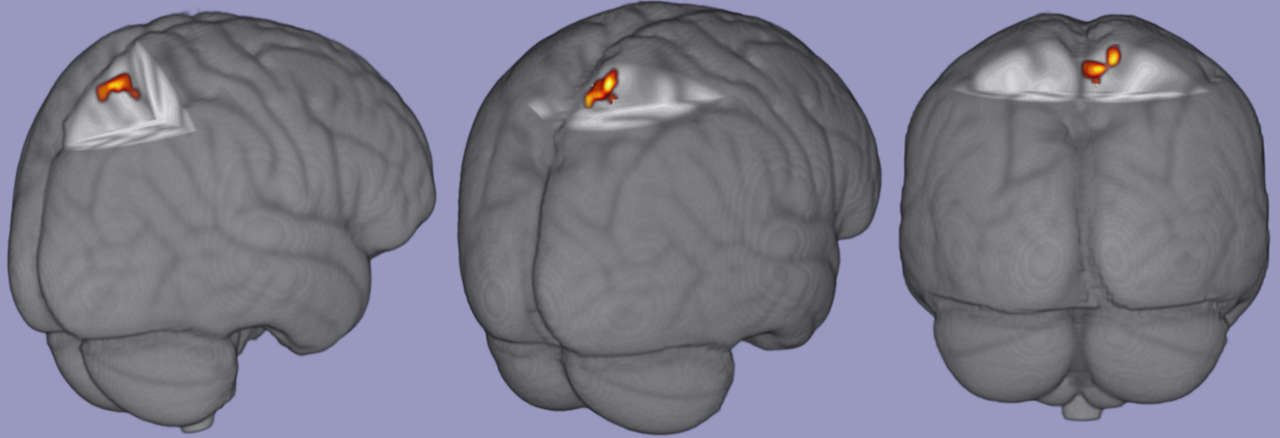
There were no significant associations among task relevant BOLD response and FV biomechanical variables of interest. There was a significant positive correlation between pKEM and task relevant BOLD signal in the contralateral (right) precuneus and superior parietal lobe [53 voxels; p = .017; zstat max = 6.47; MNI Coordinates (6, -50,66), figure 2]. There were no significant correlations among task relevant BOLD response and vGRF or pKAM in the SV condition and no significant associations with any variable’s SECS and BOLD response.

DISCUSSION
The purpose of our study was to investigate the relationship between BOLD response during repetitive knee movement and lower extremity biomechanics during a run to pivot task, under multiple visual conditions. The primary hypothesis was partially supported as involved limb pKEM in the SV condition was positively correlated with BOLD response in the contralateral precuneus and superior parietal lobe. However, there were no associations among any biomechanical variables of interest in the FV condition and task relevant BOLD response. Our secondary hypothesis was partially supported as well; involved limb pKEM was significantly lower in the SV condition compared to the FV condition.
Biomechanical Response
This cohort had a significant reduction in pKEM during the SV condition compared to FV, representing an underloading of their involved knee in response to visual perturbation. Visual disruption in individuals after ACLR has previously caused reduced knee velocity and knee displacement during a change of direction task.42 The authors concluded that the small change to the overall movement pattern may be due to task design as participants were static prior to the CoD task and vision was only disrupted for one second while participants were actively changing direction.42 This could have allowed participants ample time to plan their movement prior to visual disruption, leading to only minor changes in movement performance. The task design of the current study consisted of continuous intermittent visual perturbation as participants were running and changing direction which may account for the different results. Other work has reported greater knee flexion excursion but no change in knee moments comparing SV to FV during a drop vertical jump.32 Greater knee flexion excursion in the SV condition was deemed to be a clinically important alteration in neuromuscular control32 as the condition elicited a similar effect to a laterally directed physical perturbation delivered mid- jump,43 a situation common to various sports. This finding related to pKEM may be attributable to the different requirements of the run-pivot task evaluated here. The CoD task in this study is a highly dynamic, multi-planar, single limb and unpredictable task whereas the drop vertical jump, used in previous work,32 is bilateral and linear. The complexity of this CoD task may be difficult enough to induce changes in knee joint loading in response to the SV perturbation, whereas the bilateral and linear nature of a drop vertical jump may not be complex enough to create this effect.
There were no statistically significant differences in pKAM or vGRF between visual conditions, despite a trend towards greater vGRF in the SV condition compared to FV. This corroborates prior work reporting no effect of SV perturbation on frontal plane knee kinetics during a drop vertical jump32 or vGRF during CoD.42 When evaluating this cohort’s pKEM performance across limbs, there was a trend towards lower involved limb pKEM in FV compared to their uninvolved limb. Albeit just a trend, this supports numerous publications reporting individuals after ACLR underload their involved knee across many tasks compared to their contralateral limb and healthy controls.21–23 This includes a 90° CoD task as individuals exhibit lower pKEM compared to healthy controls, despite no difference in timed performance.44 Previously reported normative data for pKEM during a CoD task is 2.3 ± 0.6 N*m /kg45 whereas this cohort’s involved limb pKEM performance was 2.0 ± 0.34 N*m /kg (FV) and 1.90 ± 0.37 N*m /kg (SV). This may represent a clinically meaningful difference in pKEM,46 however, the difference in this cohort’s involved limb pKEM across visual conditions (0.11 ± 0.16 N*m/kg) is between the minimum detectable change (0.10 N*m/kg) and minimal clinically important difference (0.12 N*m/kg).46 Therefore, the difference in performance between FV and SV conditions reported here is statistically different but may not represent a clinically meaningful difference.
Neurologic Response
The association of greater pKEM in the SV condition and increased BOLD response in contralateral precuneus and superior parietal lobe during knee extension-flexion suggests a potential sensory activation strategy in the CNS to maintain joint loading when vision is perturbed. The precuneus and superior parietal lobe have been associated with motor imagery,47,48 cross modal sensory matching tasks,49 visuomotor mapping,50 and coordinated motor behaviors that connect cognition with action.51 Following ACLR, it has been theorized that the CNS undergoes an adaptive re-organization which may occur to integrate sensory information differently,52–54 likely due to the disruption in somatosensory signaling to spinal cord and S1 after ACLR.28,29 Identification of precuneus and superior parietal lobe as neural correlates of biomechanical performance during visual perturbation suggest these regions play an important role in sensorimotor function for individuals after ACLR. Prior work has established a greater BOLD response in bilateral precuneus during combined hip and knee flexion compared to rest,18 and greater BOLD response in superior parietal lobe18 and lingual gyrus8,18 in those with ACLR compared to healthy controls. Greater BOLD response in the superior parietal lobe has shown significant connectivity with primary motor cortex, primary and secondary somatosensory cortices, and regions of the frontal lobe associated with executive function and attention.18 Although a connectivity analysis was not performed with the cluster identified here, the previous association of superior parietal lobe to areas within the frontal lobe may warrant further investigation as the BOLD response in multiple areas of the frontal lobe decrease from 2 to 10 weeks after ACLR.9 However, this cohort was on average 3.5 years post ACLR and thus may not require the same level of attentional cognitive resources to perform basic knee flexion/extension as individuals weeks after surgery, potentially indicating a sensory neuroplasticity, separate from cognition, as time from injury increases.
Results from this work suggest that greater neurologic activity within the precuneus is positively associated with sagittal plane knee loading in situations of visual perturbation. Visual perturbations occur frequently in sport related activity and vision training is recommended during rehabilitation following ACLR55,56 to improve anticipatory timing during high-velocity movement and to re-weight sensorimotor processing.56,57 With the results presented here, and due to the known cross-modal functionality of the precuneus,49 clinicians may consider incorporating interventions which manipulate visual and somatosensory stimuli simultaneously during late phase rehabilitation. Targeting multiple sensory systems may help CNS processing of stimuli simultaneously which, in theory, may improve neural efficiency throughout the sensorimotor network. Future work should investigate sensory re-weighting interventions to determine their impact on precuneus and other regions of the sensorimotor network since it is unclear which sub-regions within the network are impacted by reweighting interventions. Future work should also seek to determine a causal relationship between sensorimotor network activation and biomechanical performance during sport related tasks to determine which brain regions are critical to knee sensorimotor control after ACLR.
Limitations
This was a preliminary analysis of the neural correlates of biomechanical performance including only eight participants, and thus a larger sample is needed to draw definitive conclusions. This work included individuals from a wide range of time points following ACLR which may have influenced the results due to a lack of control for their physical activity since completion of rehabilitation. No control group was included which limits the ability to interpret this data as a beneficial or negative adaptation in the ACLR population. Statistical testing for all biomechanical interactions was not considered due to the small sample and the correlational approach limits the ability to establish a cause-and-effect relationship of these results.
Another consideration when interpreting these results is the attentional demand of the SV paradigm. Attentional demands and visual-spatial memory requirements are increased under SV conditions, due to the lack of visual monotony, but the amount of time an individual can maintain a higher level of attention and visual memory performance without cognitive fatigue is uncertain.58 Participants performed numerous trials on both lower extremities, requiring a prolonged period of time under the SV condition. Neither visual memory nor visual attention were recorded in this study, but it is an important factor to consider which may have influenced the results.
CONCLUSION
From previous work, BOLD response during basic knee movement is altered in active individuals years after ACLR and is associated with patient reported knee function and visual performance. This study evaluated the correlation between BOLD response during basic knee movement and knee loading during a dynamic sports maneuver in an ACLR population. In this preliminary analysis, there was a positive association between involved limb sagittal plane knee loading during perturbed vision and BOLD response in areas of visual-sensory integration. Activation of visual-sensory integration brain regions may be a strategy to maintain joint loading when vision is perturbed. Clinicians may consider incorporating interventions which manipulate visual and somatosensory stimuli simultaneously to target cross-modal processing within the sensorimotor network for individuals after ACLR. However, the correlational statistical approach limits a cause-and-effect interpretation of the results presented here. Further investigation is warranted to identify which patients could most benefit from multi-sensory interventions and understand potential sensory related neural activity variation after ACLR.
DISCLOSURES
All authors report no relevant financial disclosures to the submitted work.