INTRODUCTION
Anterior cruciate ligament (ACL) tears present a challenging injury for athletes to recover from and return to sport. While the mechanisms of primary injury have been well defined,1 risk factors and mechanisms for contact and non-contact secondary ACL injury continue to be investigated.2,3 Risks for both primary and secondary ACL tears occur during sports that involve cutting, pivoting, and landing maneuvers such as basketball, football, rugby, and soccer.4–6 Although surgical treatment and rehabilitation protocols have improved over past few decades thanks to increased research investigation,7 only 63% of athletes, across levels of competition, have been reported to return to pre-injury sports participation level and only 44% returned to competitive sport level following primary ACL reconstruction at a mean follow up of 41.5 months.8 Moreover, with the increasing rate of athletes who return-to-play (RTP) after primary ACL injury, the incidence of secondary ACL injury has become a more prominent topic of interest. Recent studies have reported rates of secondary ACL injury to be between 5-34% of athletes following RTP.9–11
Secondary ACL injuries include both ACL graft ruptures and contralateral (uninjured) side ACL tears. Factors that have been identified that increase the risk of non-contact secondary ACL injury include age, sex, rehabilitation time after primary ACL injury, graft type, biomechanical deficits, lower limb kinematics and muscle strength.10,12 Regarding biomechanical deficits, prospective screening after ACL reconstruction revealed transverse plane hip kinematics and frontal plane knee kinematics during landing, sagittal plane knee moments at landing, and postural stability deficits predict secondary ACL injury (C statistic = .94) with excellent sensitivity (0.92) and specificity (0.88).2,3 More specifically, using the Biodex stability system, Capin et al. found an increase in total frontal plane (valgus) movement, greater asymmetry in internal knee extensor moment at initial contact, and a deficit in single-leg postural stability of the involved limb, to be predictive of secondary ACL injury. In a separate investigation of gait mechanics after primary ACL injury, despite the absence of clinical or gait impairments, athletes who returned to sport sooner were at a greater risk for secondary ACL injury.5 Although identification of functional joint biomechanics during an injury screening movement can provide important information for injury prevention and training, it may not be sufficient to identify athletes at risk for second injury due to biological considerations such as graft maturation, religamentization, and proprioceptive compensation.4,5
In addition to the intrinsic factors and biomechanical mechanisms that contribute to an injury mechanism, player behaviors and the playing situation have also been reported to influence the overall injury mechanism and are important factors to consider in a comprehensive model of injury causation.13 Previously, researchers have used publically available video footage of injury situations in collegiate and professional basketball games to identify factors such as kinematics, playing situation, and player behavior involved in primary ACL injury mechanisms.14,15 Significant differences were observed in both frontal and sagittal plane kinematics between male and female athletes as measured from video captured during a play where ACL injury occurred.14,15 In addition, analysis of the playing situation and playing behavior indicated that although 72% of the injuries were classified as non-contact, perturbations in the playing environment may have influenced the movement patterns leading to injury.14 However, similar quantifications of scenario and behavior have not been described for secondary ACL injury events.
Publically available high quality video footage of secondary ACL injuries can similarly be evaluated for comprehensive secondary ACL injury mechanism analysis. Therefore, purpose of this study was to characterize the mechanisms of non-contact secondary ACL injuries using video analysis. It was hypothesized that during secondary ACL videos athletes would exhibit greater frontal plane hip and knee angles, but not greater hip and knee flexion, at 66 ms following IC than they would at IC and 33 ms following IC.
MATERIALS AND METHODS
Data Collection
An exhaustive google search for news articles was completed using the search terms “ACL injury” AND “Basketball” OR “Soccer” OR “Football” OR “Rugby” OR “AFL” AND “secondary” OR “second”. News articles were used to identify athletes who suffered secondary ACL injury. Videos of these injuries were then obtained by searching through publicly available records, highlights, news reports and game replays available from January 2010 through April 2017. A total of 78 videos of non-contact secondary ACL injuries suffered by male and female collegiate and professional athletes across various sports that incorporate jumping and cutting maneuvers were identified and 26 (10 contralateral and 16 graft rupture) were included for analysis (Table 1). From the initial search, 52 videos were excluded due to poor video quality in the frontal or sagittal planes at IC or thereafter. Poor video quality was determined by direct obstruction of the knee or hip during the targeted landing or change of direction event. Furthermore, as this investigation was targeted to non-contact secondary ACL ruptures, contact injuries that were incurred by a direct blow of force to the knee were excluded.
Videos were analyzed in both the frontal and sagittal planes dependent on the camera angles available for each athlete. Out of 26 videos, six allowed for complete angle measurement of the hip and knee joints in both planes, eight were restricted to frontal plane analysis, and twelve were restricted to the sagittal plane. For trunk angles, six videos allowed for both frontal plane and sagittal plane measurements, eight were restricted to frontal plane only, and twelve were restricted to sagittal plane only.
Video Analysis
Videos obtained from the internet were recorded using Screencast-O-Matic (free version, Big Nerd Software, Seattle, WA). Full screen recordings were made from broadcast footage and saved in MP4 format and imported to Kinovea (v0.8.15, Kinovea, France). Inter and intrarater reliability of the assessment of angular measurements was established with a subcohort from the total sample of this investigation. Twenty videos were randomly selected to comprise this cohort. Two investigators determined the initial contact (IC) frame for the injured leg in each video and used this as the reference frame for analysis. Initial contact frame was selected as the instant where the athlete’s whole foot had come in contact with the ground. A second set of angular measurements was collected at 33 ms (one broadcast frame) following IC. A third set of angular measurements was collected at 66 ms (two broadcast frames) following IC. Any disagreements between the two investigators were resolved by the senior author. Interrater reliability was excellent for frontal and sagittal plane knee (ICC ≥ 0.975), hip (ICC ≥ 0.973), trunk (ICC ≥ 0.977), and ankle dorsiflexion (ICC ≥ 0.973) angle measurements each at IC as well as 33 ms and 66 ms following IC. Once interrater reliability was established, one investigator completed angular analysis of all 26 included videos.
In previous video analysis and simulation-based studies, ACL injury was thought to occur promptly following IC.16,17 More recent literature, however, has shown that an ACL injury event is expected to occur between 0 and 61 ms after IC, with mean time to peak strain roughly 53 ms after IC.18,19 Common media capture frame rate is 30 Hz, therefore, two broadcast frames are expected to be recorded in the injury event period following IC. Because the authors were unable to manipulate the playback rate of publically available video footage, IC as well as 33 ms and 66 ms following IC were examined, which corresponds to one and two frames following IC.
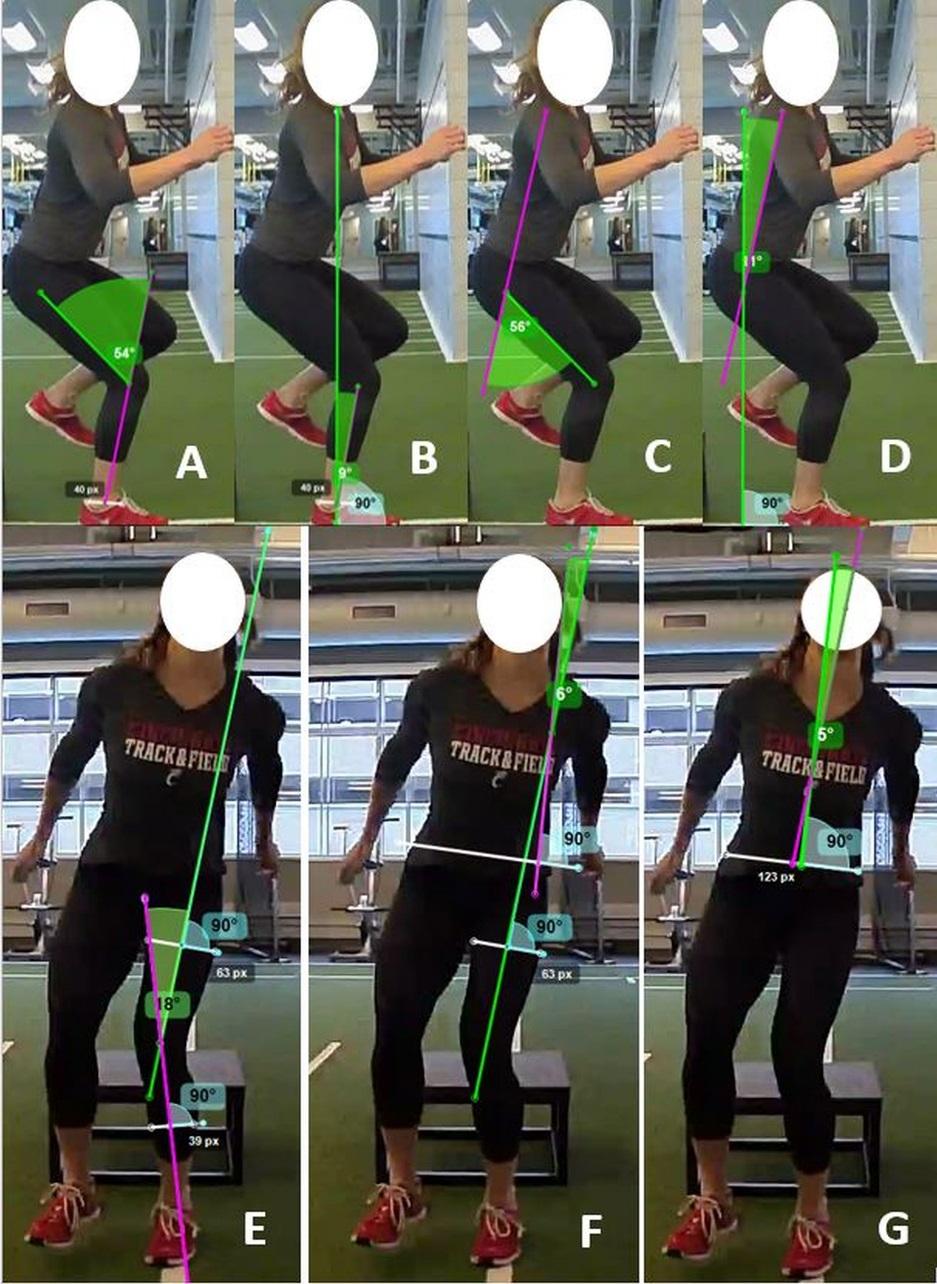
A kinematic joint analysis protocol was designed to extract frontal plane angles (knee valgus-varus, hip abduction-adduction, trunk left-right sway) and sagittal plane angles (knee flexion-extension, hip flexion extension, ankle flexion and trunk flexion; Figure 1). All angle measurements for the kinematic joint analysis protocol (see supplemental file) were completed using Kinovea software. Knee flexion-extension angle was measured as the angle between a line that started immediately superior to the greater trochanter and passed through the femoral epicondyle at the knee and a second line that started at the anterior-posterior midpoint of the ankle and passed through the center of the femoral epicondyle at the knee. Hip flexion-extension angle was measured as the angle between a line that started at the acromion and stopped immediately superior to the greater trochanter and a second line that started immediately superior to the greater trochanter and passed through the center of the femoral epicondyle. Trunk flexion angle was measured as the angle between a vertical line passing through the hip joint and a second line that started at the acromion and ended immediately superior to the greater trochanter. Knee varus-valgus angle was measured as the angle between a line that passes through the middle of the femoral shaft and the second line through the middle of the tibial shaft. The femoral shaft was determined by drawing a line perpendicular to the long axis of the thigh, selecting the midpoint of that line, then drawing a second line perpendicular to the first that passes through this midpoint. In the same manner, the tibial shaft was located relative to the shank. The hip abduction-adduction angle was measured as the angle between the femoral shaft line and a second line that was drawn perpendicular to an axis formed between the right and left ASIS or PSIS (dependent on a primarily ventral or dorsal view). Frontal plane trunk angle was measured as the angle between the line perpendicular to the ASIS or PSIS axis and a second line that started at the midpoint of the ASIS or PSIS axis and passed through either C7 or the manubrium (dependent on a primarily ventral or dorsal view). In adherence to previous convention, hip flexion, hip adduction, knee extension, knee adduction, and ankle dorsiflexion were represented as positive values.20 Frontal plane trunk angle was treated as an absolute magnitude of deviation from center.

In addition to angular measurements, several categorical variables were independently assessed from each video by the rater. Playing situation was categorized as attacking, defending, or celebrating. Player action was categorized as single-leg landing, double-leg landing, cutting, or pivoting. Player attention was selected based on where the player’s focus appeared to be immediately prior to injury and was categorized as on the ball, on an opponent, on the objective, or on landing.14 Player attention was then considered to be external if it was categorized as on the ball, on an opponent, or on the objective. Internal player attention was determined if the players focus was immediately directed at their feet or foot placement instead of being directed at the playing environment. If the categorical variable was unclear, that variable was scored as indeterminate for the given video. In addition, each video was classified as a contralateral tear, or a graft rupture based on each athlete’s searchable injury history.
Data Reporting and Statistical Methods
Dependent variables were reported as angles in degrees. Statistical calculations were performed in JMP Pro (version 10, SAS Institute, Inc., Cary, NC, USA) and significance was assessed with a 2x3 ANOVA between contralateral tear and graft rupture as well as between IC, 33 ms, and 66 ms time points. Significance was determined at α < 0.05. A Tukey’s Test was used for time point post-hoc testing between pairs. Interrater reliability was assessed in MATLAB (version 2021b, The MathWorks, Inc., Natick, MA, USA) and was assessed separately for each dependent variable via interclass correlation coefficient (ICC 2-1). ICC values were scored based on previous literature where ICC < 0.4 was poor, 0.4 < ICC < 0.75 was fair-to-good, and ICC > 0.75 was excellent.20–22 A Fisher’s Exact Test was used in order to analyze trends in player characteristics in both the contralateral tear and graft rupture groups.
RESULTS
Playing Circumstances
Of the 26 second injury cases analyzed, 10 cases were contralateral tears and 16 were graft ruptures. Fourteen second injuries occurred while the player was attacking, eight occurred while defending, and the remaining four were a celebration or indeterminate (Table 2). For the present cohort, there were no statistically significant differences between the contralateral tear and graft rupture groups for playing situation, player action, player attention, or ball possession (p ≥ 0.57). However, the raw percentage of athletes in possession of the ball was larger for the contralateral tear group (five cases, 50%) than graft rupture group (seven cases, 44%), while the raw percentage of athletes without the ball was lower in the contralateral group (one case, 14%) than in the graft rupture group (five cases 38%). In two cases in the contralateral group (28%) and three cases for the graft rupture group (23%), injury occurred while the ball was in transition. Sidestep cutting was responsible for just under half of all second injuries observed (Table 1), while single-leg landing constituted the other remaining injuries. Single-leg landing injuries made up 50% of contralateral tears (five cases) and 50% of graft ruptures (eight cases).
Knee Motion
Knee valgus collapse was identified in 18 of 26 cases, adduction collapse in one case, no collapse was readily evident in four cases, and three cases could not be accurately judged. The mean knee flexion angle at IC was 40± 17°, while the mean knee abduction angle at IC was 14 ± 8° (Table 3). There were no statistically significant differences between the contralateral and graft rupture groups in frontal or sagittal plane knee angles (p ≥ 0.19). Time point had a significant effect on sagittal and frontal plane knee angle (p = 0.04) as knee flexion angle and knee abduction angle were greater at 66 ms than at IC (p ≤ 0.03).
Hip Motion
The mean hip flexion angle at IC was 53 ± 26°, while the mean hip abduction angle at IC was 35 ± 13° (Table 4). Tear type (contralateral, graft rupture) was a significant factor to sagittal plane hip angles (p < 0.01), as the graft rupture group exhibited greater hip flexion than the contralateral tear group (p = 0.02). There were no statistically significant differences between the two groups in frontal plane hip angles (p = 0.25). Timing was not a significant factor in frontal or sagittal plane hip angles (p ≥ 0.88).
Trunk Motion
The mean trunk flexion angle at IC was 20 ± 13°, while the mean trunk frontal plane angle at IC was 16 ± 14°, away from center (Table 5). There were no statistically significant differences between the two groups in frontal or sagittal plane trunk angles (p ≥ 0.22). Time point was also not a statistically significant factor (p ≥ 0.82).
Ankle Motion
The mean ankle dorsiflexion angle at IC was 18 ± 13° (Table 6). Tear type (contralateral, graft rupture) was not a significant factor to ankle dorsiflexion (p = 0.95). Time was also not a significant factor to ankle dorsiflexion (p = 0.39).
DISCUSSION
The purpose of the current study was to characterize the mechanisms of non-contact secondary ACL injuries using publically available video of the injury event. Joint kinematics, playing situation, and player attention were analyzed to provide comprehensive analysis of the injury mechanism. It was hypothesized that athletes would exhibit greater frontal plane hip and knee angles, but not greater hip and knee flexion, at 66 ms following IC than at IC and 33 ms following IC. No change was observed between IC and 33 ms for any variables of interest. Knee frontal plane motion did support the hypothesis that knee abduction would increase over the observed time period. Additionally, sagittal plane hip angles supported the hypothesis as they did not change over the observed time period. However, contrary to our hypothesis, frontal plane hip angles did not change over the observed time period. In addition, knee flexion at 66 ms following IC did not support the stated hypothesis that athletes would exhibit less knee flexion over the observed time period. Therefore, the initial hypothesis was not fully accepted due to the mixed nature of these results.
Joint Kinematics
In the present study, a clear increase in frontal knee angle from IC to 66 ms following IC was found. This finding supports existing literature, which suggests abduction drives the ACL toward injury.23,24 Hewett et al. previously reported that athletes with ACL injury display up to 2.5 times greater knee abduction moments and 20% higher ground reaction force than uninjured atheltes.24
In addition to increased knee abduction, reduced sagittal plane motion was observed which has been found to be linked to ACL injury.1,25 Previous kinematic analysis has shown there to be greater sagittal plane motion in healthy landings as compared to ACL injury events. Using a three-dimensional analysis system, sagittal plane angles at the hip and knee during the first and second landings of a drop vertical jump were evaluated in a cohort of healthy female basketball athletes.26 In these landings, the healthy athletes demonstrated approximately 30° and 60° of change in the sagittal plane at the hip and knee, respectively, from IC to the lowest center of mass position in the first landing. In the second landing of the drop vertical jump, the same athletes demonstrated approximately 20° and 50° change in the sagittal plane at the hip and knee, respectively.26 Analysis of total joint excursion during a drop vertical jump in healthy male elite athletes demonstrated an average of 15.4° and 43.4° change in hip and knee flexion, respectively, for the dominant leg in the first landing.27 In the current analysis of injury events, the average change in sagittal plane angles were 4° and 29° at the hip and knee. In comparison to the joint excursions previously reported during healthy landings, the average joint excursions for hip and knee flexion from IC to 66 ms during an injury event were significantly lower. It is important to acknowledge that previous research has reported mixed results for the agreement and correlation between two-dimensional video analysis and three-dimensional kinematics.16,28,29 However, recent research by Schurr et al. demonstrated moderate to strong relationships between two-dimensional analysis and three-dimensional motion capture in lower extremity investigation.30 Additionally, a drop vertical jump does not take into account potential player distraction and cannot be fully compared to an athletic task.
In addition to the combination of increased knee abduction and reduced sagittal motion, lateral trunk motion has been shown to further increase the load on the ACL.31 Lateral trunk movement shifts the ground reaction force vector lateral to the knee, which increases the potential for knee valgus loading and thus ACL strain. Knee valgus motion is a predictor in both primary and secondary ACL injury risk models.1,2 Neuromuscular training studies have identified strategies to modify athletes’ landing techniques to lessen lateral trunk and knee valgus motions to reduce injury risk.32–34
The results of the current investigation did not reveal statistically significant differences between IC and 33 ms; however, a trend toward significance occurred after the 33 ms time point. Knee flexion angle was greater at 66 ms than at IC (p ≤ 0.03). In addition, frontal plane angles trended toward reduced hip adduction at 66 ms. This trend may indicate that the injury occurs somewhere between the 33 ms and 66 ms time points following IC; however, additional studies are necessary to determine the exact timing of an injury event.
Player Attention, Action, and Playing Situation
In previous primary injury analysis, player attention was most commonly on the basket rim (the objective) (38%), the opponent (28%), or the ball (23%).14 In the present secondary injury analysis, player attention was found to be primarily split between the ball (46%) or an opponent (27%). Rehabilitation programming and future studies should consider the incorporation of diverse training environments and playing situations which challenge player attention (via “distraction” exercises) to assist with secondary ACL injury prevention. Additionally, in comparison to primary injury video analysis, different trends for secondary ACL injury regarding player action and playing situation were observed.14 In the present study, 54% (14/26) of secondary injury events occurred during a single-leg landing while the remaining 46% (12/26) of events occurred during a cutting or pivoting movement. Comparable to the findings of the present study, Krosshaug et al. reported a substantial percentage (26%) of ACL injury events occurred during a single-leg landing. However, they did not find a substantial percentage (10%) of ACL injury events which occurred following a cutting or pivoting movement. Furthermore, in primary analysis, 33% of injuries occurred in double-leg landings, while in secondary analysis of the present study 0% of injury events involved a double-leg landing. In both analyses, a larger percentage of injuries occurred while the player was attacking compared to defending. In addition to the inclusion of “distraction” training, which would challenge an athlete’s ability to divide their attention across multiple tasks, preventative programs should include exercises which involve unanticipated landing and cutting movements. Comparisons of player attention, action, and playing situation in primary ACL and secondary ACL injury can be found in Table 7.
Future Directions
While 26 videos of secondary ACL were analyzed in the current study, this does not give a true representation of the prevalence of secondary ACL injuries that occur in these sports. An average of 200,000 ACL injuries occur annually in the United States, and meta-analysis of recent literature reported that secondary ACL injury rate for athletes younger than 25 is 23%.9,35 Few videos of secondary ACL injuries are publically available. Additional videos of secondary ACL injuries would help strengthen the analysis of secondary ACL injury mechanisms, playing situations, and player behaviors.
LIMITATIONS
Although the use of videos allows for insight into an injury mechanism, previous authors have reported mixed results for the agreement and correlation between two-dimensional video analysis and three-dimensional kinematics.16,28,29 In addition, the publically available video camera angles are not directly aligned with the subject in the frontal or sagittal plane, which may skew video measurements and limit comparison across videos. Furthermore, due to the presence of protective equipment and/or other sport clothing, identification of anatomical landmarks used for joint angle measurements were not exact. Unfortunately, true three-dimensional kinematics or perfectly aligned videos of injury-inducing plays do not exist. Despite the inconsistencies in camera angles, there was excellent reliability of measurement for each of the frontal and sagittal plane angles considered in this analysis. Although an exhaustive search of publically available records was conducted, this study had a limited sample size and small cohort due to poor camera quality and/or angles which could influence the study results. Additionally, it is important to note the inability to account for ground reaction forces in video analysis, as a result, how forces and loads propagated through the closed kinetic chain could not be evaluated. We were unable to appreciate how forces and loads propagated through the closed kinetic chain. Finally, knowledge of the athletes’ injury history as well as the details of athletes’ primary ACL injury, rehabilitation time, and RTP time were unknown.
CONCLUSION
Secondary ACL injuries occurred most frequently during single-leg landing and cutting movements. Injuries occurred in both attacking and defensive plays, and most commonly the player was determined to have an external focus, such as the ball or an opponent. Knee valgus collapse was identified in the majority of cases at the time of injury, with knee flexion angle increasing from IC to 66 ms. Additionally, at time of injury, most athletes exhibited a stiff landing in the hip, with no significant changes in hip frontal or sagittal angles from IC to 66 ms. Athletes experiencing secondary ACL injury exhibit frontal and sagittal plane angle deviations in knee kinematics but not hip kinematics following IC. These patterns were consistent whether the secondary injury was on the contralateral limb or a graft rupture. Secondary injury prevention intervention should focus on restricting frontal plane knee motion while mobilizing sagittal plane hip motion. Furthermore, preventative and rehabilitation programming should consider the inclusion of “distraction” training to mimic the athlete’s playing environment.
ACKNOWLEDGEMENTS
This investigation was supported by funding from NIH grant R01-AR055563.