INTRODUCTION
Hip osteoarthritis (OA) is a debilitating degenerative joint disorder that leads individuals to experience a multitude of symptoms including pain, disability in daily activity, reduced independence and quality of life (QoL).1,2 With the multifaceted nature of hip OA on the rise, there is a need for a valid multidimensional (i.e., not specific to body location or injury) scale to adequately assess constructs across varied sub-populations.3–6 Although several region-specific instruments (e.g., Lower Extremity Functional Scale) exist,3,4 the majority of patient-reported outcome (PRO) measures for the hip joint primarily measure recovery following a total hip arthroplasty (THA) due to hip OA. Thus, many scales may not sufficiently assess all the relevant dimensions associated with OA (e.g., QoL), other pathologies, nor may be applicable to certain sub-populations (e.g., individuals who have not had a total hip replacement, younger active individuals, etc.). Additionally, some scales place an excessive response burden on patients and clinicians due to item redundancy, excessive number of items, or inclusion of items with inappropriate difficulty.7 To adequately address these concerns, the Hip Disability and Osteoarthritis Score (HOOS) scale was developed.8–11
The HOOS consists of 40 items used to assess five dimensions: pain (10 items); other symptoms (five items); function in daily living (activities of daily living [ADL]; 17 items), function in sport and recreation (Sport/Rec; four items); and hip-related QoL (four items).7,10,12 The HOOS can be used over both short-term and long-term intervals. For example, the HOOS can be used to evaluate changes from week-to-week, as produced by treatments such as medication, operation, or physical therapy, or to evaluate changes over years as a result of the primary injury or post-traumatic OA.7,12 The HOOS is primarily intended to evaluate functional limitations and symptoms related to hip pathology or disability, with or without OA.7 The HOOS has been studied in relatively small sample sizes (n < 200) of adults aged 42-85,1,7,10,13 and in patients who have either been diagnosed with hip OA or who have received a THA due to OA.7,14 The HOOS, has not been extensively studied in healthy or younger populations, or in patients without hip OA. Additionally, the psychometric properties of the HOOS have not been established between groups (e.g., sex, different pathologies) or across patient visits (e.g., intake, discharge) using invariance testing.
In addition to the original 40-item HOOS, there have been several short-form versions created: the HOOS-JR (Joint Replacement), multiple HOOS-PS versions (Physical Function Short-Form), and the HOOS-12 item scale. The short-form versions were developed using items from different subdimensions of the original 40-item HOOS instrument, and have been studied in patients who have undergone THA.10,15,16 The HOOS-JR includes six items from the original HOOS: two items from pain subscale, and four items from the function in daily living subscale.16 One version of the HOOS-PS includes three items from the subscale function in daily living and two items from the Sport/Rec subscale10; whereas, other versions of the HOOS-PS include additional items (i.e., as many as seven items).13 Because the HOOS-JR and HOOS-PS only provide a summary score and assess a single dimension,10,17 the HOOS-12 short-form was developed to assess multiple dimensions.15,17
The HOOS-12 was created by developing an item bank using item response theory modeling, confirmatory factor analysis (CFA) procedures, and computerized adaptive test (CAT) simulations.17 The item bank consisted of a set of items, taken from the original HOOS questions, that were identified to measure the same domain and parameters.17 Individual CFAs were then performed on the individual constructs (i.e., pain, function, QoL) to verify that each item was unidimensional.17 Following development of the item bank, CAT simulations were used to reduce the bank to include the fewest, yet most informative, items measuring each domain.17 The final version of the HOOS-12 consisted of three constructs (pain, function, and QoL), that include four items from each of the subscales of the original HOOS.15,17
Psychometric examination of the HOOS and short-form versions have primarily focused on the construct validity, reliability, and responsiveness of the instrument. Construct validity has been established by correlating scores (i.e., Spearman’s Correlation Coefficient) on the HOOS with the Short Form (SF)-36, which was intended to measure similar constructs within the HOOS (i.e., physical function vs. ADLs, physical function vs. sport and recreation, and bodily pain vs. pain), where low to moderate correlations (r = 0.49-0.66) were found.7,18 Lower correlations were identified among the HOOS and SF-36 constructs measuring mental health, whereas higher correlations were found between physical health constructs.7,19 Internal consistency, or the assessment of homogeneity of the items, was assessed by interpreting Cronbach’s alpha values, values ranging from > .70 to ≤ .90 have been recommended.20–22 For the HOOS, Cronbach’s alpha values have ranged from 0.75 to 0.98 across multiple studies13,18,23; high values (i.e., >.90) may be indicative of potential issues (e.g., of item redundancy, construct underrepresentation, inclusion of too many items, etc.).21,24–26 Test-retest reliability has also been assessed and values found have ranged from good to excellent (ICC = 0.75 to 0.97).13,18,23 Finally, responsiveness to the 40-item HOOS has been assessed using the standardized response mean (SRM); researchers report a high response rate (SRM = > .80) when compared to the Western Ontario and MacMaster Universities Osteoarthritis Index LK 3.0.7
The HOOS-JR and HOOS-12 have been reported to have acceptable internal consistency (0.70-0.92),15,16 and high responsiveness (0.80).16 External validity assessed using Spearman’s Correlation Coefficient of the HOOS-JR has been reported to be acceptable with moderate to high correlations with the HOOS subscales (0.60-0.94)15,16 and the HOOS-PS (0.81-0.86).16 The HOOS-12 was also highly correlated with the HOOS (r = 0.75-0.94).15 The HOOS-JR, HOOS-PS, and HOOS-12 are all considered to be reliable (Cronbach’s alpha = 0.77-0.92).15
Although the HOOS, HOOS-JR, HOOS-PS, and HOOS-12 have been suggested as reliable and valid instruments, factorial validity, invariance across subgroups, and repeated testing of the scales across different time points (i.e., longitudinal invariance) have not been well supported in the literature. Additionally, complete psychometric analysis of the HOOS and the short-form versions of the scale to ensure the instrument can be used in clinical practice and research have not been completed. Conducting a CFA to examine the factor structure of the proposed scales (i.e., HOOS, HOOS-JR, HOOS-PS, HOOS-12) and conducting CFA-based invariance testing to explore measurement properties of the scale across subgroups of the population (e.g., sex, physical activity levels, etc.), stages or types of musculoskeletal injury (i.e., healthy, acute, sub-acute, persistent, and chronic), and across time (i.e., intake, discharge) are warranted prior to adoption of a model for practice and research.26,27 Establishing measurement properties through invariance testing ensures that the interpretations between groups or across time are valid and reliable.20,27 Additionally, identifying a meaningful factor structure via CFA procedures enhances the rigor of psychometric examination of an instrument’s measurement properties.20,27
Researchers have performed CFAs on the individual constructs (i.e., pain, function) proposed in the original HOOS17: some model fit recommendations for the pain and function constructs were met (CFI = 0.97-0.99, TLI = 0.97-0.98), while other construct fit indices did not meet recommendations (i.e., RMSEA = 0.14-0.19).17 However, no assessment of the complete model structure, nor results from invariance testing have appeared in the literature to date. Thus, there exists need for additional assessment of the measurement properties of the HOOS and the proposed short form versions of the scale. Therefore, the primary purposes of this study were to: (1) assess the model fit of the original HOOS scale using a diverse sample to examine its psychometric properties, (2) assess the model fit of the HOOS-JR, (3) assess the model fit of the HOOS-PS, and (4) assess the model fit of the HOOS-12. The secondary purpose, if model fit held, was to perform multigroup invariance testing of the scale across physical activity level and hip pathology subgroups.
METHODS
Participants
After institutional review board approval (19-142), informed consent was obtained from all participants prior to data collection. Participants between the ages of 18 and 65 were recruited through social media (i.e., Facebook), email, and ResearchMatch. Participants self-reported their physical activity (i.e., inactive, low-, moderate-, high-activity), injury status (e.g., healthy, acute injury), and athlete level (e.g., competitive athlete, recreational athlete) classification (Table 1).
Social media recruitment was performed by providing study information (e.g., purpose of the study, inclusion/exclusion criteria, estimated survey duration) and a link to the survey on multiple Facebook pages.28 Email recruitment was performed by emailing the same study details from the social media recruitment and a separate survey link to a convenience sample of coaches (NCAA and recreational sports teams), athletic trainers, and ROTC officers across different higher education institutions, requesting the survey email to be shared with their athletes, patients, or cadets.
ResearchMatch was utilized as an additional online email recruitment tool. Searches of the ResearchMatch database were performed to identify potential participants (i.e., participants that were healthy, diagnosed with hip osteoarthritis, individuals who had undergone a THA, and those who had sustained a lower extremity musculoskeletal injury). Members of the database who fit the search criteria were recruited for this study per ResearchMatch protocol. Potential participants were identified and emailed invitations for study participation. If the participant voluntarily consented to participate, a follow-up email was sent to the individual containing a link to the survey.
Instrumentation
Qualtrics (Qualtrics, LLC, Provo, UT) software was utilized to create an electronic survey via a weblink. The survey responses were collected directly into Qualtrics. Information collected included demographic information (e.g., age, sex, physical activity level) and responses to the items of the HOOS.
Hip Disability and Osteoarthritis Outcome Scale
The HOOS asks participants to rate how frequently they engaged in the behaviors over the past week using a 5-point Likert scale (1 = none/not at all/never, 2 = rarely/mild/monthly, 3 = sometimes/moderately/weekly, 4 = often/severe/daily, and 5 = extreme/always). Items were summed to create a score for each subscale, and global HOOS score, where 0 indicated extreme problems and 100 indicated no problems.7,12
Data Analysis
Data were exported from the Qualtrics software and downloaded using Statistical Package for Social Sciences Version 24.0 (IBM Corp., Armonk, NY). Missing data were treated conservatively and any participant’s data missing more than 10% of the responses on the HOOS (i.e., four or more missing responses) was removed from the data set.26 Individuals missing less than 10% (i.e., three items or less) of the items within the HOOS were replaced with the mean score of the respective item for analysis purposes.26 Participants with missing demographic data were not excluded from analysis and were left as missing values. Data were assessed for normality using z-scores, skewness, and kurtosis values. Multivariate outliers were also identified using descriptive statistics and Mahalanobis distance, the cut-off value was for 5 degrees of freedom at a p-value of 0.001, was 15.089.26,29 This methodology generated the final data set used for analysis.
Scale Structure
The final data set was used to conduct a CFA using Analysis of Moment Structures (AMOS) software (IBM Corp., Armonk, NY) on the 40-item HOOS and associated subscales. Consistent with the original proposed model, the HOOS scale was specified as a five factor, 40-item model.12 Additionally, the HOOS-JR was specified as a one factor, 6-item model, the HOOS-PS was specified as a one factor, 5-item model, and the HOOS-12 was specified as a three factor, 12-item model. Given the subscales were created using items from the 40-item HOOS, the original item number labels were retained from the HOOS during the CFA procedures.10,15–17 Full Information Maximum Likelihood Estimation was used to generate the parameter estimates. Model fit statistics included the likelihood ratio statistic (CMIN), Goodness of Fit Index (GFI), Comparative Fit Index (CFI), Tucker-Lewis Index (TLI), Bollen’s Incremental Fit Index (IFI), and Root Mean Square Error of Approximation (RMSEA).26 Model fit was evaluated based on a priori values: GFI ≥ 0.95, CFI ≥ 0.95, TLI ≥ 0.95, RMSEA ≤ 0.06, IFI; ≥ 0.95.26,30 Latent construct correlations and path coefficient values with R2 ≥ 0.90 were used to identify potential multicollinearity among the latent constructs, which indicates that item removal within a potential dimension might be beneficial to prevent model misspecification.31,32
Multigroup Invariance Testing
Confirmatory factor analysis invariance testing was conducted if recommended model fit criteria were met to determine if the association between the latent constructs (i.e., symptoms, pain, function, QoL) and the respective items were stable and equal across groups.26,31,33 This was accomplished using a set of hierarchical procedures with an increasing level of constraint.26,31,33 Individual CFAs were first conducted by subgroup category (i.e., activity level, injury type), ensuring the construct and factors (e.g., pain, function, symptoms) were measuring what was intended.31,33 The model then underwent configural, metric, and scalar invariance testing.31–33 First, the configural invariance test placed all groups in the same model to ensure the same factors have similar items across subgroups. Secondly, the metric model then tested if factor loadings were equal across subgroups.32 If the model met metric invariance requirements, equal variances (i.e., group differences) between groups were then assessed.32 Lastly, the scalar invariance test ensured that item intercepts were equal across groups, which indicated the means were not determined or altered by external factors.32 If the model met scalar invariance requirements, equal mean models (i.e., score differences) were tested between groups.32
Model fit was compared using the CFI difference test (CFIDIFF) and the chi-square difference test (χ2DIFF), with a p-value cut-off of 0.01.30,33 Given the sensitivity of the χ2DIFF test to sample size,30 the CFIDIFF test held greater weight in decisions regarding invariance testing model fit. If a model exceeded the χ2DIFF test, but met the CFIDIFF test, invariance testing continued. Specifically, the HOOS-PS and HOOS-JR underwent invariance testing across physical activity level (i.e., inactive, low, medium, high) and injury type (i.e., hip OA and THA pathology, no hip pathology).
RESULTS
Among the total responses (ResearchMatch = 487; social media = 370; total = 857), 149 participants were missing responses to more than 10% of the HOOS items and most of the demographic items. Thus, information could not be verified (e.g., sex, injury status) and these responses were removed from the dataset. Three individuals were missing responses to less than 10% of the HOOS; the missing values for those participants were replaced with the rounded mean for each item missing. Additionally, 53 (6.18%) participants reported scores that were identified as univariate (z scores ≥ 3.4) or multivariate (Mahalanobis distance ≥ 15.089) outliers and were removed from the dataset.29,34 Of the participants removed, all injury categories (i.e., healthy, acute, persistent, chronic) and both sexes were represented. A total of 655 participants (i.e., social media/email: n= 247 [37.7%]; ResearchMatch: n = 408 [62.3%]) were included in the final data set (mean age = 38.93 ± 15.05 yrs.; mean weight = 165.42 ± 41.99 lbs.; Table 2). Participants self-reported their injury status and level of activity. The sample primarily included healthy participants (i.e., free of musculoskeletal injury; n = 453, 69%; Table 2), and the largest physically active response group indicated a level of moderate activity (n = 276, 42.1%; Table 2). Respondents reported participation in a variety of sports (Table 3) and a variety of injury locations (Table 4).
Scale Structure of the HOOS Scale
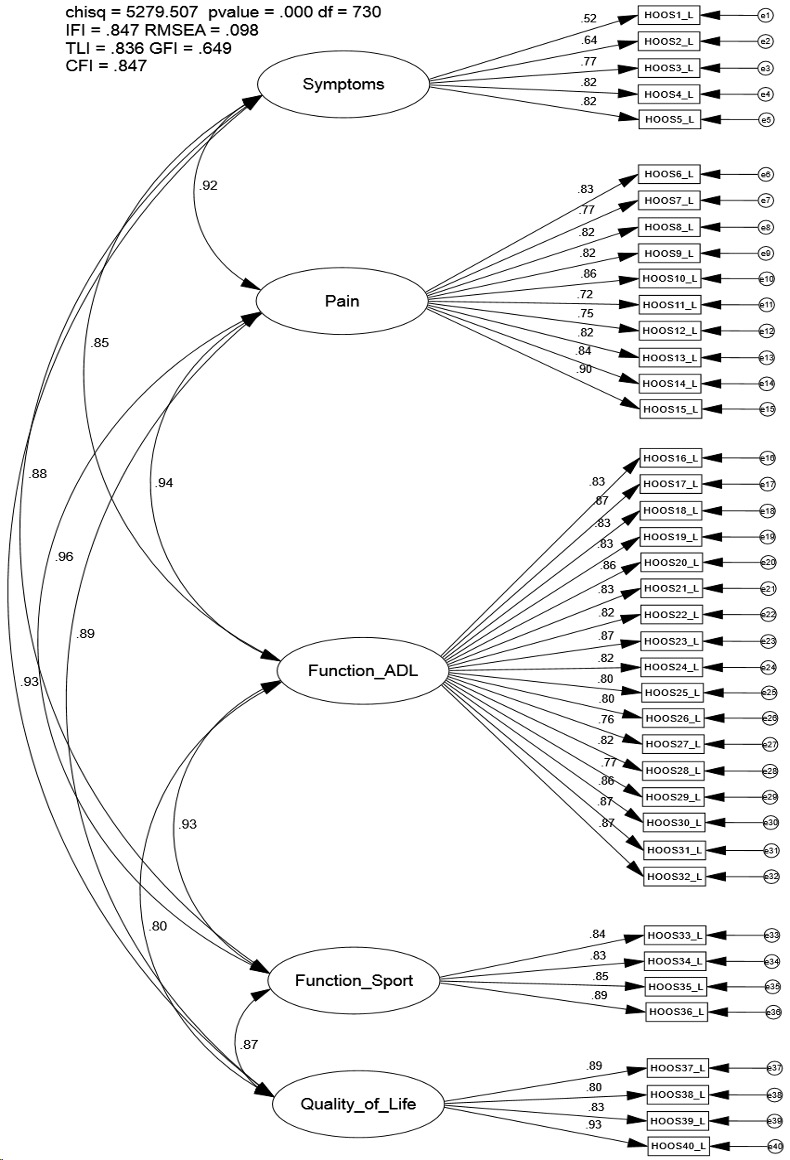
The proposed CFA model of the HOOS did not meet contemporary fit recommendations (CFI = 0.847; TLI = 0.836; IFI = 0.847; RMSEA = 0.098; Figure 1). Correlations between the first-order latent constructs (e.g., symptoms and pain) were high (0.80-0.96; Figure 1). Modification indices indicated a number of meaningful cross-loadings between several items (e.g., item 6 and item 37 [134.58]) were present.26 Additionally, modification indices revealed the incorporation of error correlations amongst several items (e.g., item 24 [putting on socks/stockings] and 26 [taking off socks/stockings; 344.25]) would improve model fit (CFI = 0.934; TLI = 0.927; IFI = 0.934; RMSEA = 0.065).
_scale_hierarchical_confirmatory_factor.png)
Scale Structure of the HOOS-JR Scale
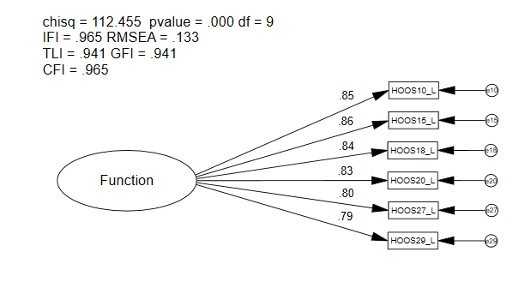
The CFA model fit indices of the HOOS-JR met some, but not all contemporary recommendations (CFI = 0.965; TLI = 0.941; IFI = 0.965; RMSEA = 0.133; Figure 2); however, CFI and IFI values exceeded recommendations and loadings were statistically significant (p < 0.001; Figure 2). Modification indices revealed the incorporation of error correlations between two items (i.e., item 10 [going up or down stairs] and 15 [walking on an uneven surface; 69.57] would improve model fit (CFI = 0.994; TLI = 0.988; IFI = 0.994; RMSEA = 0.059).

Scale Structure of the HOOS-PS Scale
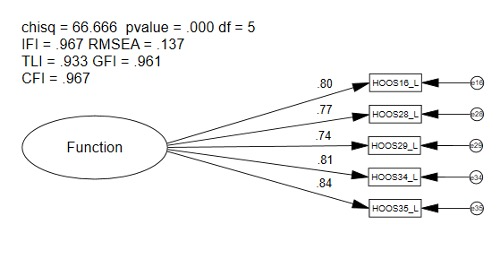
The CFA model fit indices of the HOOS-PS met some, but not all, contemporary recommendations (CFI = 0.967; TLI = 0.933; IFI = 0.967; RMSEA = 0.137; Figure 3); loadings were statistically significant (p < 0.001; Figure 3). Modification indices revealed that the incorporation of error correlations between two items (i.e., item 16 [descending stairs] and 15 [getting in and out of the bath; 28.90] would improve model fit (CFI = 0.986; TLI = 0.966; IFI = 0.986; RMSEA = 0.098).

Scale Structure of the HOOS-12 Scale
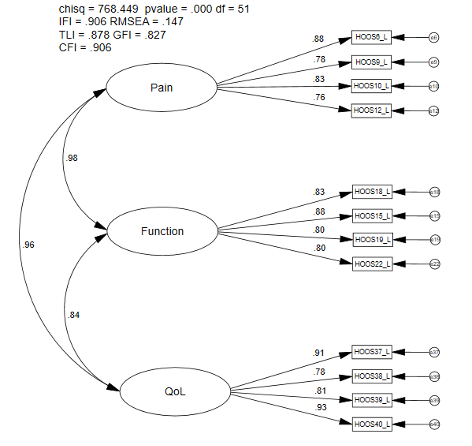
The CFA model fit indices of the HOOS-12 did not meet contemporary recommendations (CFI = 0.906; TLI = 0.878; IFI = 0.906; RMSEA = 0.147; Figure 4). Correlations between the first-order latent constructs (e.g., pain and function) were particularly high (0.84-0.98) (Figure 4). Modification indices indicated meaningful cross-loadings between several items (e.g., item 6 and item 37; 57.77) and constructs (e.g., error 37 and pain; 43.34).26 Additionally, modification indices revealed the incorporation of error correlations between several items (i.e., item 6 [how often is your hip pain] and 37 [how often are you aware of your hip problem; 218.42]) would improve model fit (CFI = 0.976; TLI = 0.965; IFI = 0.976; RMSEA = 0.079).

Multigroup Invariance Testing Across Injury Subgroup for the HOOS-JR and HOOS-PS
Given that several model fit indices met recommended fit criteria for the HOOS-JR (i.e., CFI, IFI) and the HOOS-PS (i.e., CFI, TLI), multigroup invariance testing was performed across two subgroups: a hip pathology group (i.e., those diagnosed with hip OA and/or those who underwent a THA) and a non-hip pathology group. The analyses were conducted on the hip pathology group (n = 48; CFI = 0.940), along with a random sample of those who had no self-reported hip pathology (n = 94; CFI = 0.954).
For the HOOS-JR, the initial model (configural) met some recommended model fit indices (CFI = 0.95; χ2 = 48.01; TLI = 0.914; IFI = 0.95; RMSEA = 0.067; Table 5), indicating equal form between groups on the one factor, 6-item model. The metric model (i.e., equal loadings) passed both the CFIDIFF and the χ2DIFF tests, which warranted testing of equal latent variances. After constraining the variances to be equal, the metric model did not pass the CFIDIFF or the χ2DIFF test, indicating variances were not equal between groups. When variances were not constrained to be equal, the hip pathology group reported scores with more variance compared to the group without a hip pathology. The scalar model (i.e., equal loadings and intercepts) also passed both the CFIDIFF and the χ2DIFF tests (Table 5), which warranted assessment of the equal means. When the means were constrained to be equal, the model did not pass the CFIDIFF or the χ2DIFF tests (Table 5), which indicated differences in means between scores. When means were not constrained to be equal, the hip pathology group reported higher mean scores (i.e., more hip dysfunction) than the group without a hip pathology.
For the HOOS-PS, the initial model (configural) met some, but not all, model fit indices (CFI = 0.948; χ2 = 48.01; TLI = 0.88; IFI = 0.942 RMSEA = 0.13; Table 6). The metric model (i.e., equal loadings) did not pass the CFIDIFF or the χ2DIFF tests, which indicated that the meaning of the items was not the same across groups. As such, further exploration of the multigroup invariance testing procedures was not warranted on the HOOS-PS.
Multigroup Invariance Testing Across Activity Level Subgroups for the HOOS-JR and the HOOS-PS
For the HOOS-JR, the initial model (configural) met some recommended model fit indices (0.95; χ2 = 171.91; TLI = 0.92; IFI = 0.95; RMSEA = .076; Table 7), which indicated equal form between groups on the one factor, 6-item model. The metric model (i.e., equal loadings) passed both the CFIDIFF and the χ2DIFF tests, which warranted testing of equal latent variances. After constraining the variances to be equal, the metric model did not pass the CFIDIFF or the χ2DIFF test which indicated variances were not equal between groups. When variances were not constrained to be equal, the inactive group reported scores with more variance compared to the other three groups. The scalar model (i.e., equal loadings and intercepts) also passed both the CFIDIFF and the χ2DIFF tests (Table 7), which warranted assessment of the equal means. When the means were constrained to be equal, the model did not pass the CFIDIFF or the χ2DIFF tests (Table 7), which indicated differences in means between scores. When means were not constrained to be equal, the inactive group reported higher mean scores (i.e., more hip dysfunction) than the active groups.
For the HOOS-PS, the initial model (configural) met model fit indices (CFI= 0.97; χ2 = 79.03; TLI = 0.93; IFI = 0.97; RMSEA = 0.067; Table 8), which indicated equal form of the one factor, 5-item model between groups. The metric model (i.e., equal loadings) passed both the CFIDIFF and the χ2DIFF test, which warranted testing of equal latent variances. After constraining the variances to be equal, the model did not pass the CFIDIFF or the χ2DIFF test, which indicated differences in variance between groups. When variances were not constrained to be equal, the inactive group reported more variance in scores than the active groups (i.e., low-, moderate-, and high activity). The scalar model (i.e., equal loadings and intercepts) also passed both the CFIDIFF and the χ2DIFF tests (Table 8), which warranted assessment of the equal means model. When means were constrained to be equal, the model did not pass the CFIDIFF or the χ2DIFF tests (Table 8); when means were not constrained to be equal, individuals in the inactive group reported higher mean scores (i.e., more hip dysfunction) than the active groups.
DISCUSSION
The purpose of this study was to examine the psychometric properties of the published 40-item HOOS, HOOS-PS, HOOS-JR, and HOOS-12 scales by using contemporary CFA and multigroup invariance testing procedures in a larger and more diverse physically active sample. Confirmatory factor analysis procedures were used as an approach to examine these scales for use in clinical practice and research, while invariance testing procedures helped assess for item-level bias and substantive differences between groups.27 Previous literature demonstrated good model fit of individual constructs (i.e., pain, function, and QoL)17; however, previous researchers failed to provide model fit of the full latent variable scale model as recommended26,31 to assess scale properties for use in practice and research.26,31,33 The current results indicate the original HOOS and HOOS-12 do not meet recommended measurement criteria for this sample of physically active participants. Therefore, caution is warranted if using results from either measure for research or clinical practice. The HOOS-JR and the HOOS-PS demonstrated stronger evidence supporting their use given the CFA and multigroup invariance findings. Further exploration to determine when to use the scales and when the measurement properties may not be sufficient for assessing group differences in larger samples of physically active patients with and without hip pathology is warranted to confirm or refute our findings.
Confirmatory Factor Analysis of the original 40-item HOOS Scale
The original five factor, 40-item HOOS scale structure was not supported in our study.26,33 Poor model fit indices, along with high correlation values between latent constructs, indicates potential multicollinearity and a lack of unique constructs. Additionally, the modification indices revealed that model fit could be substantially improved if numerous modifications in the model (e.g., error-terms were correlated) were instituted.26,33 Assessment of the error-term cross-loadings revealed that most of the items shared commonalities.26,35 Correlation of the error terms may indicate the presence of overlapping items, or items that are perceived to ask similar questions.26 Further, there were concerns with Cronbach’s alpha values; in our sample, the high values (0.84-0.98) were similar to previously reported levels (0.75-0.98)13,18,23 and may be indicative of potential item redundancy.20,36 The high correlation values between constructs and items, along with high Cronbach’s alpha values, re-affirmed multicollinearity as a concern and may indicate respondents are unable to differentiate between the items used to measure different constructs.20,36
The current findings suggest the model may be improved by re-writing items or by removing items from the original model.26,31 Furthermore, the results make it difficult to conclude that items in the constructs are measuring unique phenomena.26,31,33 Also, exploration may be warranted to determine if the correlated errors are theoretically justified and to determine when the inclusion of those correlations are warranted in research.26,35 Thus, the instrument may be improved through exploratory procedures (i.e., EFA procedures) to help determine if a more concise instrument can be identified from the originally developed item.20,26,31 However, given the design of the HOOS items, further modification may be necessary. For example, many HOOS items are double-barreled questions (i.e., asking more than one question in an item), which may result in analysis complications because the respondent may not know which aspect of the item to respond to for their scored response and may cause confusion and generate inconsistent results.37 As such, it would be prudent for researchers to rewrite items or provide fewer overlapping examples which may result in improved model fit and more precise assessment of the patient experience.37
The current CFA analysis approach on the full HOOS scale provides insight where previous studies separated the dimensions to conduct CFAs on individual dimensions of the scale (i.e., the development of the HOOS-12).17 To the authors knowledge, this study is the first to perform CFA procedures on the full HOOS reflective latent variable model. Analyses examining psychometric properties of a scale should first examine the full model prior to conducting exploratory procedures and item removal.26,31,33 The model fit indices found in our study were substantially lower than those previously reported for the pain and function dimensions when the constructs were examined individually.17 These results demonstrate the importance of testing the full model before recommending a multi-dimensional scale for use in practice or research.30,31
Confirmatory factor analysis of the HOOS-JR
The HOOS-JR met recommended CFI and IFI values26,33; model fit concerns (e.g., high item cross-loadings) may have contributed to a reduced overall model fit. Additionally, the modification indices revealed that model fit could be substantially improved if modifications in the model were instituted.26,33 Assessment of the error term cross-loadings identified in the modification indices indicated two items (i.e., item 10 [going up or down stairs] and item 15 [walking on an uneven surface]) shared commonalities, which may warrant further exploration as including the error term covariances may be appropriate in certain analysis situations.26,35 Similar to the HOOS, another potential explanation for poor model fit indices could be item design. It may be beneficial to address double-barreled questions and overlapping items to improve model fit and reduce response burden for respondents.15,37
The HOOS-JR was subjected to multigroup invariance testing by injury type and activity level as certain model fit criteria (i.e., CFI, IFI) thresholds were met. The multigroup invariance findings across injury type provide some evidence for scale validity. As the model met criteria for measurement invariance, group differences for variances and latent means could be assessed as these differences could be considered true differences as opposed to differences due to item bias or measurement error.26,31 If the HOOS-JR was valid scale, it would be expected that respondents who had hip OA or previous history of a THA would report higher mean scores with greater variances if the scale is measuring the intended phenomenon. A higher score on the HOOS-JR construct indicates those respondents have more difficulty related to pain and function,16,17 while a finding of more score variance and higher mean scores for impaired function and pain in the injured group would be expected because hip OA is one of the leading causes of decreased function due to pain.10 Our results indicate the individuals with hip pathology reported larger amounts of variance and higher mean scores compared to the no hip pathology group. These substantive findings provide support that the HOOS-JR is capturing valid group differences among those who are suffering from a hip injury/dysfunction and those who are not. Thus, clinicians and researchers could assess score differences between these groups on the HOOS-JR.
Multigroup invariance testing was then performed by activity level subgroups. Group differences for variances and means were also found between activity level subgroups, which also support the validity of the HOOS-JR. A higher score on the HOOS-JR constructs indicates those respondents have greater difficulty related to pain and function16,17 and it could be theorized that individuals with higher levels of hip dysfunction (e.g., pain) would be less active than those with lower levels of dysfunction. The current findings reveal individuals who were classified as inactive reported larger amounts of variance in their scores and exhibited higher mean scores (i.e., more pain and decreased function) compared to those who were more active (i.e., low-, moderate-, and high-activity). The findings indicate the group differences likely represent true score differences as opposed to measurement error; thus, our results provide substantive support for scale validity, given that the HOOS-JR identified higher dysfunction in inactive patients who likely alter activity levels due to hip pain and dysfunction. Further analysis of the inactive group supports this theory as 42% (N = 17) of theses participants reported a current physical injury, and 20% (N = 8) reported a previous injury to their hip. Thus, the findings support the HOOS-JR is capturing valid group differences in those who are less active and suffering from a hip injury/dysfunction as compared to healthy, active respondents.
Confirmatory Factor Analysis of the HOOS-PS Scale
The one factor, 5-item HOOS-PS met the recommended levels for CFI, GFI, and TLI26,33; however, additional model fit concerns such as item cross-loadings may have contributed to reduced overall model fit. Like the HOOS and the HOOS-JR, a potential explanation for poor model fit indices could be item design. Assessment of cross-loadings identified through the modification indices was performed; review of the items did not indicate a theoretical justification for the shared commonalities.26,35 Thus, sound rationale for further exploration of the correlation of error terms was not identified.26,35 However, it may be beneficial to address double-barreled questions and overlapping items to improve model fit.15,37
Next, the HOOS-PS was subjected to multigroup invariance testing by injury type. As model fit indices for the metric invariance model were not met,26 the use of this scale may not be appropriate for examining group differences and differences in scores between respondents who have a hip pathology and those who do not in its current form. Without meeting multigroup invariance testing recommendations, it should not be assumed that score differences between healthy or injured respondents are true differences and not measurement error.26 Multigroup invariance testing should be performed again in a larger sample of healthy and hip injured respondents to confirm or refute our findings.
Lastly, when performing invariance testing by activity level subgroups, evidence was found to support scale structure with the configural, metric, and scalar results.26 Group differences in variances and means for function were found between activity levels. Individuals who were classified as being inactive had more variance in their responses compared to those who were classified as active. A higher score on the HOOS-PS constructs indicates those respondents have more difficulty related to physical function.10,38 A finding of more score variance and higher mean scores in physical function of the inactive group would be expected, as some participants in this sample were more likely to have difficulties pertaining to their hip while performing physical activity. Thus, the substantive findings provide support that the HOOS-PS is capturing valid group differences between activity levels in our sample, which provides theoretical support for the HOOS-PS.
Confirmatory Factor Analysis of the HOOS-12 Scale
As the HOOS-12 model did not meet the recommended model fit indices in our sample26,33; a number of concerns regarding model fit were present. First, a high correlation values between latent constructs indicate potential multicollinearity and an inability of the items to measure unique constructs. The modification indices also revealed model fit could be substantially improved if modifications in the model (e.g., error terms were correlated) were made.26,33 Additionally, concerns with Cronbach’s alpha values were present; the values were high (0.88-0.91), which are similar to previously reported levels (0.77-0.95)15 indicates potential item redundancy.20,36 Lastly, assessment of cross-loadings identified through the modification indices revealed that some, but not all, of the items shared commonalities which could be justified.26,35 As such, further exploration may be warranted to determine if and when the correlated errors should be included in a model.26,35 High correlation values between constructs and items, coupled with high Cronbach’s alpha values, reiterate the concern regarding the presence of multicollinearity bordering on singularity and the potential need to remove items, alter items to improve clarity, or to develop new items which better measure the intended construct.26,31
Limitations and future research
While the present study identified concerns regarding the factorial validity in the HOOS, the HOOS-JR, the HOOS-PS and the HOOS-12, there are still limitations to consider. The current sample was larger than those used for most studies on the HOOS, but this sample was comprised mostly of self-reported healthy individuals. Moreover, the sample used included few participants who had been diagnosed with hip OA, THA, or injury to their hip. Of note, a sub-sample of the healthy participants was used in the multigroup invariance testing due to the limited sample of injured participants. Utilizing such a small sample size may impact the statistical power of the test and result in model misspecification, which is why larger sample sizes are recommended.26 As such, further exploration is warranted using larger, more evenly distributed and diverse samples. Also, due to the limited sample size and the current clinical application of the scale, invariance testing using the HOOS-JR was limited to the originally proposed model; however, future research should explore the validity of including the error term correlation identified and how it influences findings.
The sample of participants also responded to all 40-items of the HOOS. Thus, it is possible that responses to the short forms were influenced by the additional items not on the scale. Therefore, future research should be completed on a sample of participants who only responded to the items on the instrument. The authors also did not conduct long-term follow-up nor compare the results of the modified scale with another criterion scale. Due to study design (i.e., collection at one time point), we could not perform test-retest reliability, assess the minimal detectable change, assess responsiveness (e.g., the minimal clinically important differences [MCIDs]), or perform longitudinal invariance testing. Future research should aim to assess longitudinal invariance and measures of instrument precision (e.g., MCIDs) to fully establish the psychometric properties of each scale and to provide guidance for use of the scales in clinical practice and research.
CONCLUSIONS
In conclusion, the scale structure of the original HOOS and HOOS-12 were not supported in the current study. Analyses found preliminary evidence to support the use of the HOOS-JR and HOOS-PS as psychometrically sound instruments and multigroup invariance testing results provided substantive support for these scales measuring the intended phenomenon and ability to assess true group differences in certain situations. Clinicians and researchers who utilize the scales, should do so with caution regarding their limitations or untested properties (e.g., longitudinal invariance testing). Thus, more research is warranted to establish the full psychometric properties of these scales and identify an improved version which meets contemporary recommendations to measure the multi-dimensional experience of patient disability following hip pathology.
Conflicts of interest
The authors report no conflicts of interest