INTRODUCTION
One of the most common causes of exercise-induced pain in the lower leg is chronic exertional compartment syndrome (CECS).1 The cause of this syndrome has been debated and is still not fully clarified.2,3 CECS has been defined as pain due to exertion-increased muscle compartment pressure, causing tissue perfusion and ischemic pain.2,4 Symptoms include cramping pain, paraesthesia and muscle weakness.5 Most often, the anterior compartment is affected, but the deep posterior compartment, the lateral compartment and the superficial posterior compartment may also be affected.6 CECS has been described as a problem exclusively in athletes, but the condition has also been observed in both nonathletic individuals as well as in individuals with a sedentary lifestyle.2 Running and walking were reported as the main activity causing pain among 36 patients with CECS.2
The CECS diagnosis relies on a medical history of exercise-induced pain in the lower leg with symptom resolution after exercise cessation, and CECS may further be accompanied by increased intramuscular pressure after exercise.2,4,6 The intra-compartmental pressure can be measured using a needle or catheter inserted into the muscular compartment.4 However, this is an invasive and painful intervention, and near-infrared spectroscopy (NIRS) has been suggested as a non-invasive alternative allowing assessment of tissue oxygen saturation (StO2) and muscle hemodynamics in both patients and healthy populations.3
First-line treatment for CECS includes reduced exercise volume, gait alteration, running alteration and/or strengthening exercises.6,7 If a conservative approach fails, CECS can be treated surgically with subcutaneous fasciotomy.8 A recent systematic review based on 68 studies evaluated results of a total of 3783 patients of whom 95% were surgically treated for CECS.9 The review found an overall satisfaction rate of 85% after surgery compared to a satisfaction rate after conservative treatment of 47%.9 The overall return to physical activity rate was 80% after surgery and 50% after conservative treatment.9 Thus, further studies aiming to identify potential physiological treatment targets in patients with CECS are highly warranted.
The primary aim of the study was to compare muscle strength, StO2 and physical activity among patients with CECS and a group of sex- and age-matched asymptomatic controls. It was hypothesized that patients with CECS would have (i) higher maximal muscle strength in the plantar and dorsiflexion of the ankle joints, (ii) lower StO2 in the affected compartment during running and (iii) higher daily physical activity levels compared to a group of sex- and age-matched asymptomatic controls. The secondary aim was to investigate any association between oxygen saturation and lower leg pain.
METHODS
The present case-control study compared a group of patients with CECS and a group of sex- and age-matched asymptomatic controls. The study was conducted in accordance with the Helsinki declaration. The design, aim and procedures were presented to the local research ethics committee (record number: 183/2018). According to Danish law, no ethics approval was needed for this type of study. The Danish Data Protection Agency approved handling of personal data (record number: 1-16-02-181-19), and all included participants provided written consent prior to data collection.
Patients
Patients with suspected CECS were recruited at Department of Orthopaedic Surgery at Aarhus University Hospital between November 2019 and June 2021. Inclusion criteria were unilateral or bilateral symptoms of CECS, such as intense anterior lower leg pain or intense tightness after approximately 10 minutes of physical activity, muscle cramps and/or decreased muscular function of one of the compartments in combination with pain. In addition, symptoms had to have persisted for three months, and symptoms had to be normalized within ~30 minutes of exercise cessation. Patients were excluded if they demonstrated symptoms of nerve or artery entrapment, lumbar spine disease, muscle herniation, tibial stress fracture, or tibial stress syndromes. As the NIRS technology might be less accurate in patients with highly pigmented skin or a fat layer of more than 4 cm subcutaneous at the testing area, these patients were excluded from the study after assessment.
Asymptomatic Controls
Asymptomatic controls were recruited by advertisements at the educational institution VIA University College, Aarhus University Hospital and through social media. Controls were matched by sex and age (+/- 5 years) with patients with CECS and were able to read and understand Danish. Controls were not considered eligible if they (i) had been diagnosed with CECS, (ii) had a chronic disease or a musculoskeletal injury affecting their gait or muscle function, (iii) were undergoing elective surgery in the lower extremities within the next six months, (iv) had undergone surgery in the lower extremities within the prior two years or (v) were pregnant.
Test Procedure
Patients and controls were tested by a physiotherapist or an exercise physiologist trained in the test procedure at Department of Public Health, Aarhus University. Weight was measured using a Tanita weight (SC-330MA, Tanita Corporation of America, Illinois, USA), and height was measured using a telescopic height measuring device from ADE (MZ10023, DES Germany Gmbh, Hamburg, Germany).
Isometric Muscle Strength
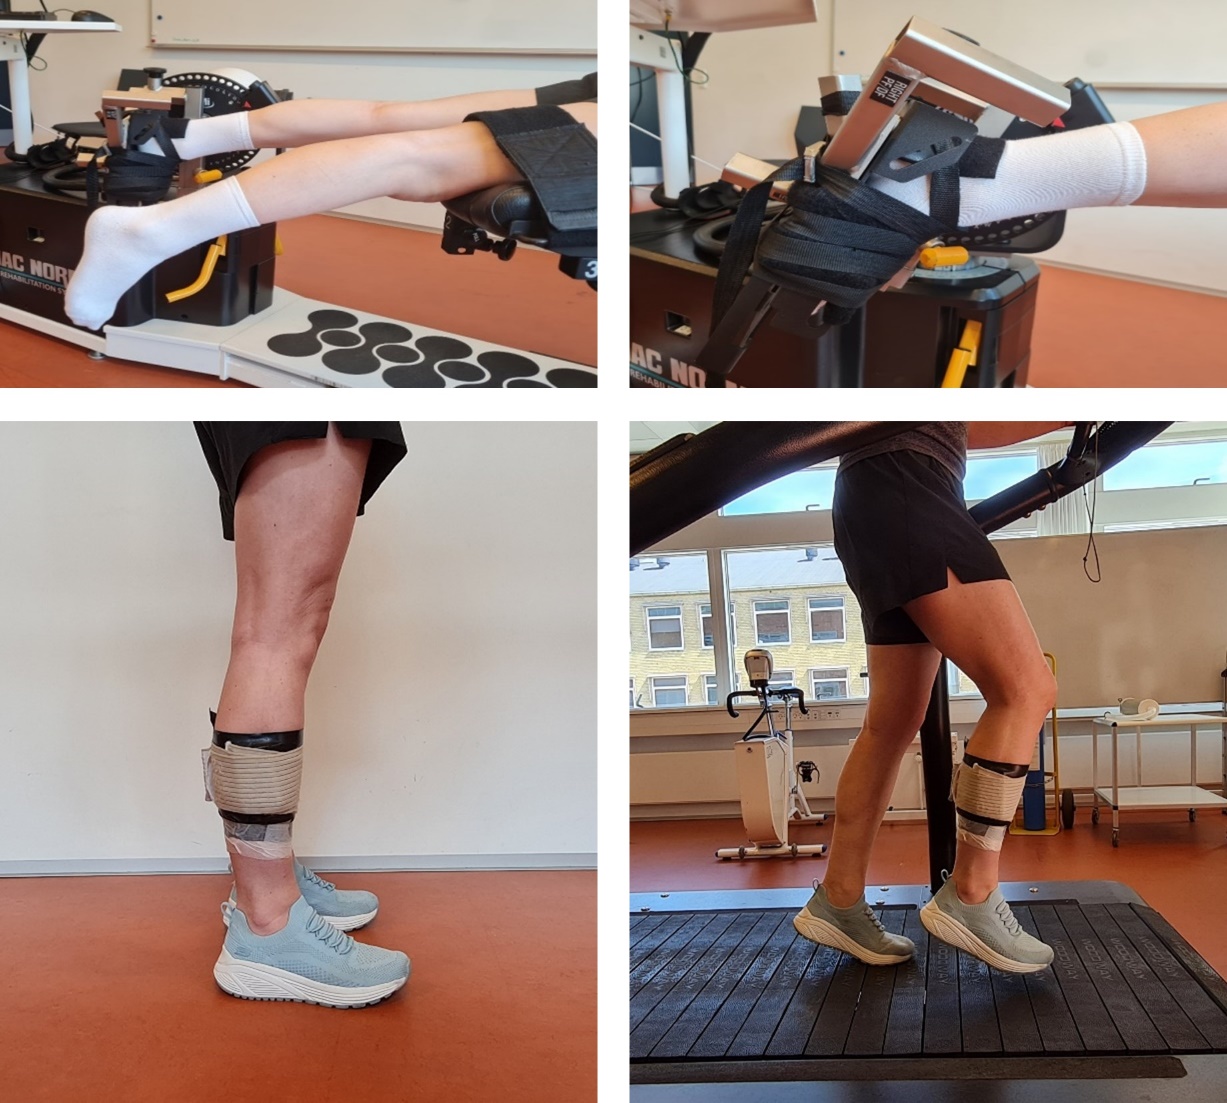
Maximum voluntary isometric contraction of the plantar and dorsiflexors of the foot was measured in an isokinetic dynamometer (Humac Norm CSMi, Stoughton, Massachusetts, USA). Motor-driven dynamometry has been described as the gold standard in assessment of muscle strength.10 Isometric plantar flexion was tested first, starting with the contralateral leg, followed by dorsiflexion of the same leg (Figure 1). The test was performed with the patient in a prone position, without shoes and with the knee in 0o. The dynamometer rotation axis was aligned with the lateral malleolus on the tested leg when the foot was in a neutral position (0o). Plantarflexion was tested in this position, while dorsiflexion was tested in 25o plantar flexion. Patients and controls were instructed to press against the dynamometer pad with as much force and as fast as possible for about four seconds. Subsequently, isometric plantar flexion followed by dorsiflexion was tested in the affected/paired leg. Between each attempt, a rest period of 30 seconds was provided. To correct for gravity, the weight of the leg was measured for each movement. One test attempt was made followed by at least three maximum voluntary contraction attempts. If an improvement of more than 10% in the last attempt was detected, an additional attempt was performed. However, a maximum of five attempts was completed to avoid muscle fatigue. A test-retest was performed for the first six patients. The intraclass coefficient (ICC) was 0.92 (95% CI: 0.66;0.98) for the measure of plantar flexion and 0.77 (95% CI: 0.24;0.95) for dorsi flexion in the affected leg. For the nonaffected leg, the ICC was 0.77 (95% CI: 0.26;0.95) for plantarflexion and 0.76 (95% CI: 0.18;0.95) for dorsiflexion.

Near-Infrared Spectroscopy
StO2 was measured using NIRS. The PortaMon, a wearable wireless NIRS unit (Artinis Medical System, Elst, The Netherlands), was placed on the affected leg at the affected compartment in patients and on the right leg at the matched compartment in controls (Figure 1). First, fibula length was measured, and 1/3 of the fibula length was marked distal from the head of the fibula. If the anterior compartment was affected, the PortaMon was placed 2 cm laterally from the forward facing bone margin (margo anterior) on tibia and in line with the mark on fibula. If the lateral compartment was affected, the PortaMon was placed 6 cm laterally from margo anterior on tibia and in line with the mark on fibula. If the posterior superficial compartment was affected, the PortaMon was placed on the muscle belly of the medial gastrocnemius. The area was shaved and cleansed before placing the PortaMon with two bandages to keep free of light. Data were collected using the OxySoft software (Artinis Medical System, Elst, The Netherlands). All participants were instructed to run on a treadmill starting at 10 km/hour. The speed was increased by 1 km/hour every two minutes until the patients experienced intense recognizable leg pain or reached exhaustion. Information on perceived pain and exertion was obtained using a Numeric Rating Scale (NRS)11 and the Borg Rating of Perceived Exertion scale12 every minute. The test was terminated for controls when they reached exhaustion. Patients and controls were then instructed to sit down and relax for 10 min. while still measuring StO2. During the test, the timepoints for starting, stopping, and terminating the test were registered in the OxySoft software. After the test, baseline StO2 was registered as an average of 15 StO2 registrations prior to the baseline mark and peak StO2 as an average of 15 StO2 registrations prior to the stop mark and the absolute and relative (percentage) change was calculated.13 A test-retest was performed for the first six patients. The ICC was 0.73 (95% CI: 0.02;0.96) for the measure of baseline StO2 and 0.92 (95% CI: 0.59;0.99) for the peak exercise StO2. NIRS has been found to be a valid and reliable noninvasive measurement to measuring StO2 and diagnose CECS, compared to intracompartmental pressure, with a sensitivity of 85%.4
Physical Activity
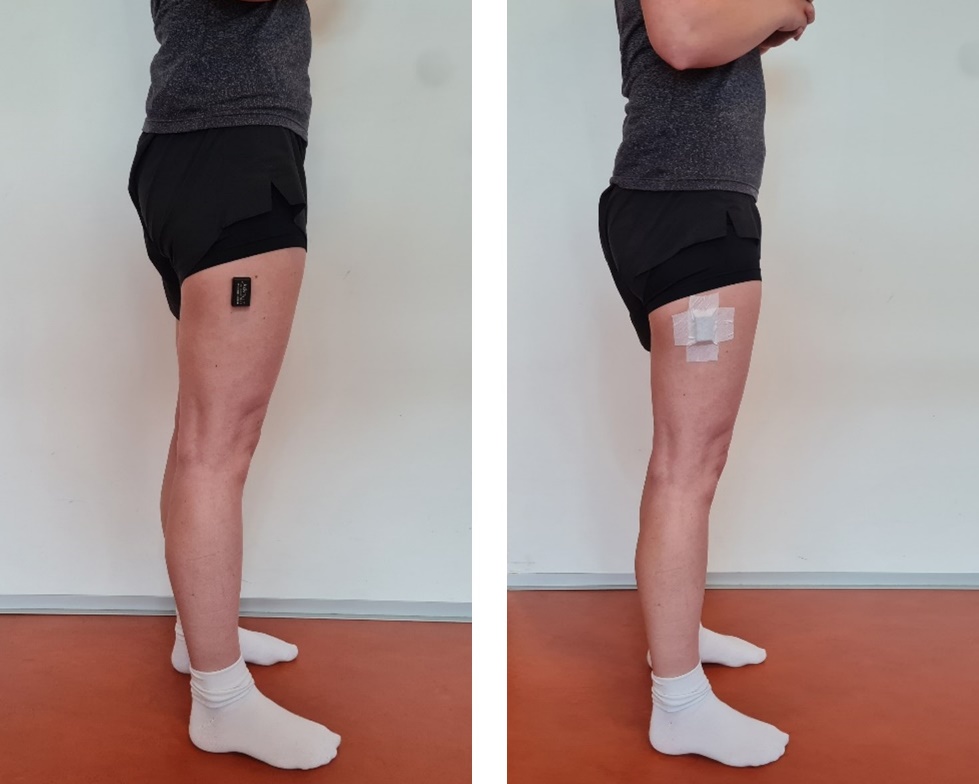
Daily physical activity was measured using tri-axial accelerometry by placing an accelerometer (AX3 Axivity Ltd., Newcastle, UK) on the lateral side of the thigh, at half the distance from the major trochanter to the lateral femoral condyle, on the affected leg in patients and on the right leg in controls (Figure 2). The accelerometers were small wearable sensors measuring acceleration in three dimensions at 100 Hz. Patients and controls were asked to wear the accelerometer for seven consecutive days following the physical tests and to remove the accelerometer at night. Each day, patients registered information on when they had put on and removed the accelerometer and whether it had been removed during the day. In the same logbook, the patients rated their daily level of pain during rest and activity on a 100-millimetre-long visual analogue scale (VAS). The accelerometer and the logbook were returned to the hospital and data was downloaded using the OMGUI Configuration and Analysis Tool (Version 1.0.0.43, Newcastle, UK). Data were split into days and analysed using a validated algorithm to identify different types of activities based on the average magnitudes of the three acceleration vectors and the gait cycle frequency.14 Furthermore, an intensity parameter was constructed, grouping each 10-second data window into one of the following categories; (i) very low intensity activity (0-0.05 g) e.g., sitting or standing, (ii) low intensity activity (0.05-0.1 g) e.g., standing or shuffling, (iii) moderate intensity activity (0.1-0.2 g) e.g., slow or normal walking and (iv) high intensity activity (>0.2 g) e.g., fast walking, running or jumping.14 Days containing less than 10 hours of data were excluded.15 To describe the daily physical activity collected with accelerometers, the four dimensions of physical activity according to the World Health Organization (WHO): Frequency, Intensity, Time and Type (F.I.T.T.) were used.16

The Exercise-Induced Leg Pain Questionnaire
The exercise-induced leg pain questionnaire (EILP) was originally developed for German-speaking patients (EILP-G) with exercise-induced leg pain such as CECS, medial tibial stress syndrome and stress fractures.17 The German version of the questionnaire has been found to have excellent reliability, with an Intraclass Correlation Coefficient ranging from 0.86-0.99, as well as good face and construct validity to measure the severity of symptoms and functional limitations for patients with exercise-induced leg pain.17 The questionnaire consists of 10 items scored on a five-point Likert scale ranging from no difficulty to unable to do (0-4). The total score was calculated by dividing the sum score with the maximum possible points and then converted to a score from 0-100, where 0 indicated severe problems and 100 indicated no problems. A Danish version of the questionnaire was used, translated in accordance with international standards18 and approved by the authors of the original German version.
Statistical Analysis
Categorical variables were presented as numbers with percentages and analysed using the chi-squared test. Continuous variables were presented as means with 95% confidence intervals (95% CI) if normally distributed, otherwise as medians with interquartile ranges (IQR). The assessment of normality was performed using probability plots and histograms. Comparisons between the two groups were made using the student t-test when data were normally distributed, and the Mann-Whitney U test was used to compare the not normally distributed EILP-D and VAS scores between groups. The Spearman’s Rank Correlation Coefficient assessed associations between StO2 and lower leg pain. Correlations were interpreted as follows: a correlation >0.90 was interpreted as very strong, 0.70-0.89 as strong, 0.50-0.69 as moderate, 0.30-0.49 as weak and <0.29 as low.19 All statistical analyses were performed in Stata version 17.0 (StataCorp LLC, College Station, TX, USA).
RESULTS
Twenty-four patients with CECS and 24 age- and sex-matched controls were included in this study. Characteristics of patients and controls are presented in Table 1.
Isometric Muscle Strength
There were no significant differences between the two groups in either isometric plantar or dorsiflexion, nor in the affected/matched leg or the contralateral leg (Table 2). In addition, the difference between the affected and the contralateral leg in plantarflexion for patients with CECS was 1.8 Nm (95% CI -10.3;14.0), though not statistically significant (p=0.76). The difference was 0.6 Nm (95% CI -2.4;3.5) for dorsiflexion, which was not statistically significant (p=0.69).
Oxygen Saturation
The baseline StO2 in the affected or matched compartment was 4.5pp (95% CI: 0.7;8.3) lower for patients with CECS compared with controls (Table 2). The peak exercise StO2 was similar for the two groups as the mean peak exercise StO2 was 51.4% (SD 11.2) for patients and 52.9% (SD 16.7) for controls. There were no significant differences in the absolute and relative change scores between the two groups (Table 2). However, the treadmill running time during the test was 3.5 minutes (95% CI: 1.7;5.3) lower for patients compared with controls.
Physical Activity
Unfortunately, four patients did not return the accelerometers and these patients were thus excluded from the analysis of physical activity. In addition, two days of physical activity measurement from two patients with CECS and seven days from seven controls were excluded as these days contained less than 10 hours of data collection (range 2.5-9.9 hours). Patients had worn the accelerometer for an average of 6.6 days, ranging from two to seven days, and controls had worn the accelerometer for an average of 6.6 days, ranging from five to seven days. During a day, comparable levels of walking, standing and being sedentary were observed in persons with CECS and controls, respectively. Controls spent 11.0 minutes (95% CI: 3.6;18.3) more cycling per day than patients with CECS (p=0.004). On average, the two groups performed the same amount of very low, moderate, and high intensity activity per day, but patients performed 4.0pp (95% CI: 0.5;7.5) more low intensity activity than controls (p=0.02). There were no significant differences between the groups in number of daily steps, walking cadence or number of sit to stand transfers (Table 3).
Patient-Reported Leg Pain
The last obtained NRS and Borg values were significantly higher for patients than controls (p<0.001) (Table 2). There was no association between either peak or absolute change StO2 and patient-reported leg pain (Table 4).
DISCUSSION
No differences were found in maximal isometric plantar- or dorsiflexion muscle strength between patients with CECS and a group of sex- and age-matched asymptomatic controls. Baseline StO2 was lower for patients with CECS than controls, however no difference existed when they experienced pain or reached exhaustion, even though patients with CECS did this significantly earlier than controls. Overall, no differences were found in daily physical activities and StO2 was not associated with leg pain.
Patients with CECS did not have greater muscle strength in isometric ankle plantar- or dorsiflexion compared with controls. In addition, no differences were found between the CECS-affected leg and the contralateral leg. Birtles et al. also observed no difference between isometric dorsiflexion in patients with CECS and asymptomatic controls.20 However, they did report a significant difference in eccentric dorsiflexion, favouring patients with CECS.20 Furthermore, Birtles et al. did not observe a difference in muscle thickness or change in muscle size after the exercise between patients and controls.
In the present study, patients with CECS had significant lower StO2 in the affected compartment before running on the treadmill compared to controls. However, the baseline group difference was no longer apparent at peak exercise StO2. This result contrasts with the study by van den Brand et al., who did not find a difference in baseline StO2 between 13 patients with CECS and eight healthy volunteers, but observed a significant group difference at peak exercise StO2.13 Moreover, patients with CECS had a lower peak exercise StO2 than the healthy volunteers and also lower change scores.13 The mean baseline StO2 was 87 (SD 11) for the 20 legs of patients with CECS and 91 (SD 5) for the 16 legs of the healthy volunteers in the study by van den Brand et al.13 In the current study, baseline StO2 was 64.3 (SD 5.4) among the 24 patients with CECS and 68.8 (SD 7.4) among the 24 controls. Baseline StO2 was thus very different between this study and the study by van den Brand et al., which is probably explained by differences in study population as the patients in the study by van den Brand et al. were all in the army and were predominantly young men. In addition, the difference could indicate a possible systematic difference between the two measurement systems as well as the testing procedures, as van den Brand et al. used two InSpectraTM Spectrometers (Hutchinson Technology Inc., Hutchinson, Minnesota) and tested both legs.
Patients with CECS did not spend more time walking and standing than controls and sedentary time was also similar between groups. In addition, there were no differences between the groups in the number of daily steps, walking cadence or number of sit to stand transfers. Controls, however, spent 11 minutes more cycling per day than patients with CECS. This could indicate that patients with CECS avoid cycling. This is interesting as cycling has been reported as both a conservative treatment in CECS as well as part of rehabilitation after fasciotomy.21 Furthermore, both patients and controls had a mean number of daily steps and walking cadence exceeding the minimum recommendations for physical activity (7000-8000 steps per day for healthy adults with a cadence of 100 steps per minute22). The physical activity level among controls included in this study was generally comparable to the physical activity level in a group of asymptomatic controls included in a similar study of young individuals from the same geographical area, although different recruitment methods had been applied.23 The physical activity level found among controls in the current study thus seems representative for young Danish individuals.
There was a statistically significant difference in running time during testing, as patients on average experienced pain or reached exhaustion 3.5 min. (95% CI: 1.7;5.3) earlier than controls. Despite this, there was no association between StO2 and leg pain. The included patients with CECS experienced more exercise-induced leg pain than controls. Also, patients had statistically significant more lower leg pain when resting and during activity throughout the day than controls. Patient-reported pain of the lower leg was measured using EILP-D and VAS, both valid and reliable methods.17,24 Birtles et al. used a Numeric Rating Scale (NRS) ranging from 0-10 to assess pain among patients with CECS and a group of asymptomatic controls, 24 and 48 hours after assessment.20 They also observed a statistically significant difference in pain levels between patients and asymptomatic controls during activities. Thus, pain is the primary parameter that distinguishes patients with CECS from controls.
Strengths and Limitations
A strength of this study is the relatively high number of patients and controls compared to similar studies in patients with CECS.13,20 The study by van den Brand et al. included 13 patients and eight healthy volunteers,13 while Birtles et al. included 10 patients and 14 healthy controls.20 However, a sample size calculation was not performed, and the study population was thus based on a convenience sample. Moreover, the comprehensive test procedure, allowing investigation of both muscle strength, StO2, daily physical activity and patient-reported leg pain is a strength. A limitation to the NIRS measurement was that ultrasound was not used to evaluate the placement of the PortaMon above the painful compartment. The NIRS measurement may thus be biased by measurement errors.
CONCLUSION
The included patients with CECS did not differ from the asymptomatic controls in lower leg muscle strength, oxygen saturation, or physical activity. However, patients experienced higher levels of lower leg pain than controls during running, daily activities and at rest. There was no association between oxygen saturation and lower leg pain between groups.
ACKNOWLEDGEMENT
The authors would like to thank Anna Karina Beck and Signe Schütt Kobberrød for testing all the asymptomatic controls, as well as Kathrine Krone, Katrine Salling Kjøller, Mathias Floor Andersen, Nana Hedegaard Kristensen and Niklas Munk for testing the first half of the patients.
CONFLICTS OF INTEREST
The authors report no conflicts of interest.
FUNDING
No funding was received in relation to this project.