INTRODUCTION
Musculoskeletal injuries are the leading cause of disability worldwide, affecting approximately 1.7 billion people.1 In the United States, musculoskeletal injuries affect one in two Americans, resulting in 62.7 million medical visits and $53.1 billion in direct treatment costs.2 The annual cost for treatment and lost wages is a staggering $980 billion.2 In addition to monetary cost, musculoskeletal injuries limit mobility, leading to early retirement, reduced well-being, and reduced societal participation.1
Participation in athletic activities produces a substantial number of injuries. Each year, 4.2 million sports injuries require medical attention; 61% of these injuries involve the musculoskeletal system.2 In collegiate athletics, the overall rate of injury is estimated to be 13.8 per 1000 exposures during games and 4.0 injuries per 1000 exposures during practices.3 For a team of 50 athletes, this equates to one injury for every two games and one injury for every five practices.
Severe injuries (those that restrict participation for greater than three weeks, cause an athlete to discontinue the season, or extend beyond the current athletic season) comprise 9.5% of all injuries reported to the National Collegiate Athletic Association (NCAA), with an estimated rate of 0.7 per 1000 exposures.4 Of all severe injuries, 14.4% were fractures.4 Severe injuries to the foot/ankle and wrist/hand are common. In NCAA football, foot/ankle injuries occur at a rate of 1.5 per 1000 exposures, with the most common being fractures of the metatarsal (0.03 per 1000 exposures), malleolus (0.02 per 1000 exposures), and phalanx (0.01 per 1000 exposures).5 When examining differences in ankle injuries between athletic settings, fractures account for 3.8% of high school injuries but only 0.8% of collegiate injuries.6 The rate of wrist/hand injuries in all NCAA sports is 0.5 per 1000 exposures, with the most common being metacarpal fractures (0.51 per 1000 exposures) and phalangeal fractures (0.5 per 1000 exposures).7
In the military, 50% of Army soldiers sustain a new injury annually.8–11 These injuries contribute to over one million medical encounters and over 10 million limited duty days per year.8,10–12 In a two-month study of 1,475 Soldiers across a variety of units, medical care associated with the treatment of musculoskeletal injuries exceeded $1.3 million ($1.9K per injury).9 Among 417 Marine Corps recruits, over 50% sustained a musculoskeletal injury during the 11 or 12-week training period.13
Physical therapists practicing direct-access care in the military routinely utilize diagnostic imaging within their differential diagnosis and clinical reasoning processes. This model of early access to physical therapy reduces unnecessary imaging and healthcare costs and improves outcomes.14–16 Two recent studies of diagnostic imaging in physical therapy demonstrated that physical therapists order imaging appropriately, with 83-91% of cases judged to be appropriate according to the American College of Radiology (ACR) Criteria.17,18 Physical therapists also utilize imaging safely; no adverse events were reported in over 1,000 imaging studies in a recent study examining the practice of military physical therapists.16 When comparing physical therapists to primary care providers using data from a nationally standardized healthcare performance measure, physical therapists were more likely to adhere to low back pain imaging guidelines in young, athletic patients.19
Physical therapists have demonstrated the ability to identify fractures when operating in a direct-access setting. Numerous case reports from a direct-access sports physical therapy clinic have been published that highlight the ability of physical therapists to appropriately recognize and disposition patients with foot/ankle and wrist/hand fractures.20–30 Among non-military physical therapists who are not currently able to refer patients directly to a radiologist, 55 to 95% reported routinely performing the nine fundamental skills in their clinical practice that are necessary to utilize diagnostic imaging effectively.31 The Ottawa Ankle Rules are a valid screening tool for foot/ankle fractures,32,33 but have not been studied in a physical therapy direct-access setting.
To the authors’ knowledge, no published cohort studies have explored the utilization of diagnostic imaging to detect fractures by physical therapists in a direct-access practice setting. The purpose of this study was to describe the utilization of diagnostic imaging in acute foot/ankle and wrist/hand injuries by physical therapists in a direct-access sports physical therapy clinic. Based on clinical experience and observations, it was hypothesized that: 1. upper extremity imaging would result in a significantly greater proportion of confirmed fracture diagnoses than lower extremity imaging; 2. the average time from initial evaluation to definitive care for patients evaluated by physical therapists and diagnosed with a fracture would be less than five days; 3. the Ottawa Ankle Rules would perform similarly in a direct-access physical therapy setting as in an emergency department; 4. no individual examination item would result in clinically meaningful diagnostic accuracy for the diagnosis of wrist/hand or foot/ankle fractures.
METHODS
This was a retrospective cohort study conducted at Keller Army Community Hospital (KACH) at the United States Military Academy (USMA) at West Point. The Arvin Cadet Physical Therapy Clinic is a direct-access clinic where nearly all USMA Cadets with musculoskeletal injuries and/or pain are evaluated and treated. All physical therapists possess clinical privileges with the ability to order diagnostic imaging and prescribe a limited number of medications, including non-steroidal anti-inflammatory medications (NSAIDs) and non-opioid analgesics. The Naval Medical Center – Portsmouth Institutional Review Board approved the research design and protocol before data collection.
The Agfa Impax Client 6 (Agfa Healthcare) image viewing software program (IMPAX) was searched with a location code for the Arvin Physical Therapy Clinic from June 2014 to June 2018 for patients with diagnostic imaging ordered for foot/ankle and wrist/hand injuries. More recent records were not utilized due to a nomenclature change that prevented an accurate search for the specific body regions of interest. For each patient identified, the Armed Forces Health Longitudinal Technology Application (AHLTA) electronic medical records (EMR) were independently reviewed by the principal and co-investigator physical therapists. All reviewing physical therapists held board certification in orthopaedic or sports physical therapy. Documentation from physical therapy encounters and radiology exams was extracted and de-identified. Demographic data included patient age and sex, duration of symptoms, and location of symptoms. If a provider’s note did not explicitly state the duration of symptoms in days/weeks/months, seven days was input for acute symptoms, 30 days for subacute symptoms, and 90 days for chronic symptoms.34 Table 1 shows specific variables of interest for foot/ankle and wrist/hand injury data extraction, which were identified based on the clinical experience of the authors practicing in this setting. The status on the Ottawa Ankle Rules was recorded for all foot and ankle injuries. When an element of the patient history or physical examination was not reported in the patient note, it was coded as a “negative” finding. Variables of interest for all injuries included: (1) diagnosis of a fracture, (2) number of physical therapy visits before the imaging order, (3) amount of time from initial physical therapy evaluation to the imaging order, and (4) amount of time from initial physical therapy evaluation to definitive care. As treatment of fractures is beyond the scope of physical therapist practice, the time to definitive care was defined as when an orthopaedic surgeon or orthopaedic physician’s assistant was consulted on the patient’s case, either by the physical therapist via telephone or by the patient in person.
Statistical analyses were performed in Microsoft Excel 365 (Microsoft, Inc) and SPSS version 28.0 (IBM Corp) with α = 0.05 set a priori for all analyses. Descriptive statistics were calculated for demographics, the number of imaging orders resulting in fracture, the time between the initial evaluation and the imaging order, and the time from the initial evaluation to definitive care for fractures. Homogeneity of the data was assessed using Levene’s test and all data were assessed for normal distribution using a Shapiro-Wilk test. Skewness and kurtosis were also calculated to assess for normal distribution. The nonparametric Mann-Whitney U test examined differences in time to imaging, visits to imaging, and time from physical therapy evaluation to definitive care between upper and lower extremity injuries, as these data were not normally distributed and had unequal variances. A Chi-square test was used to compare the proportion of fractures identified with upper versus lower extremity imaging orders. The diagnostic accuracy of items from the patient history and physical exam, including the Ottawa Ankle Rules, was examined by calculating sensitivity, specificity, and likelihood ratios with 95% confidence intervals using the PEDro Confidence Interval Calculator (Herbert R. Confidence Interval Calculator (2013). https://pedro.org.au/english/resources/confidence-interval-calculator/).
RESULTS
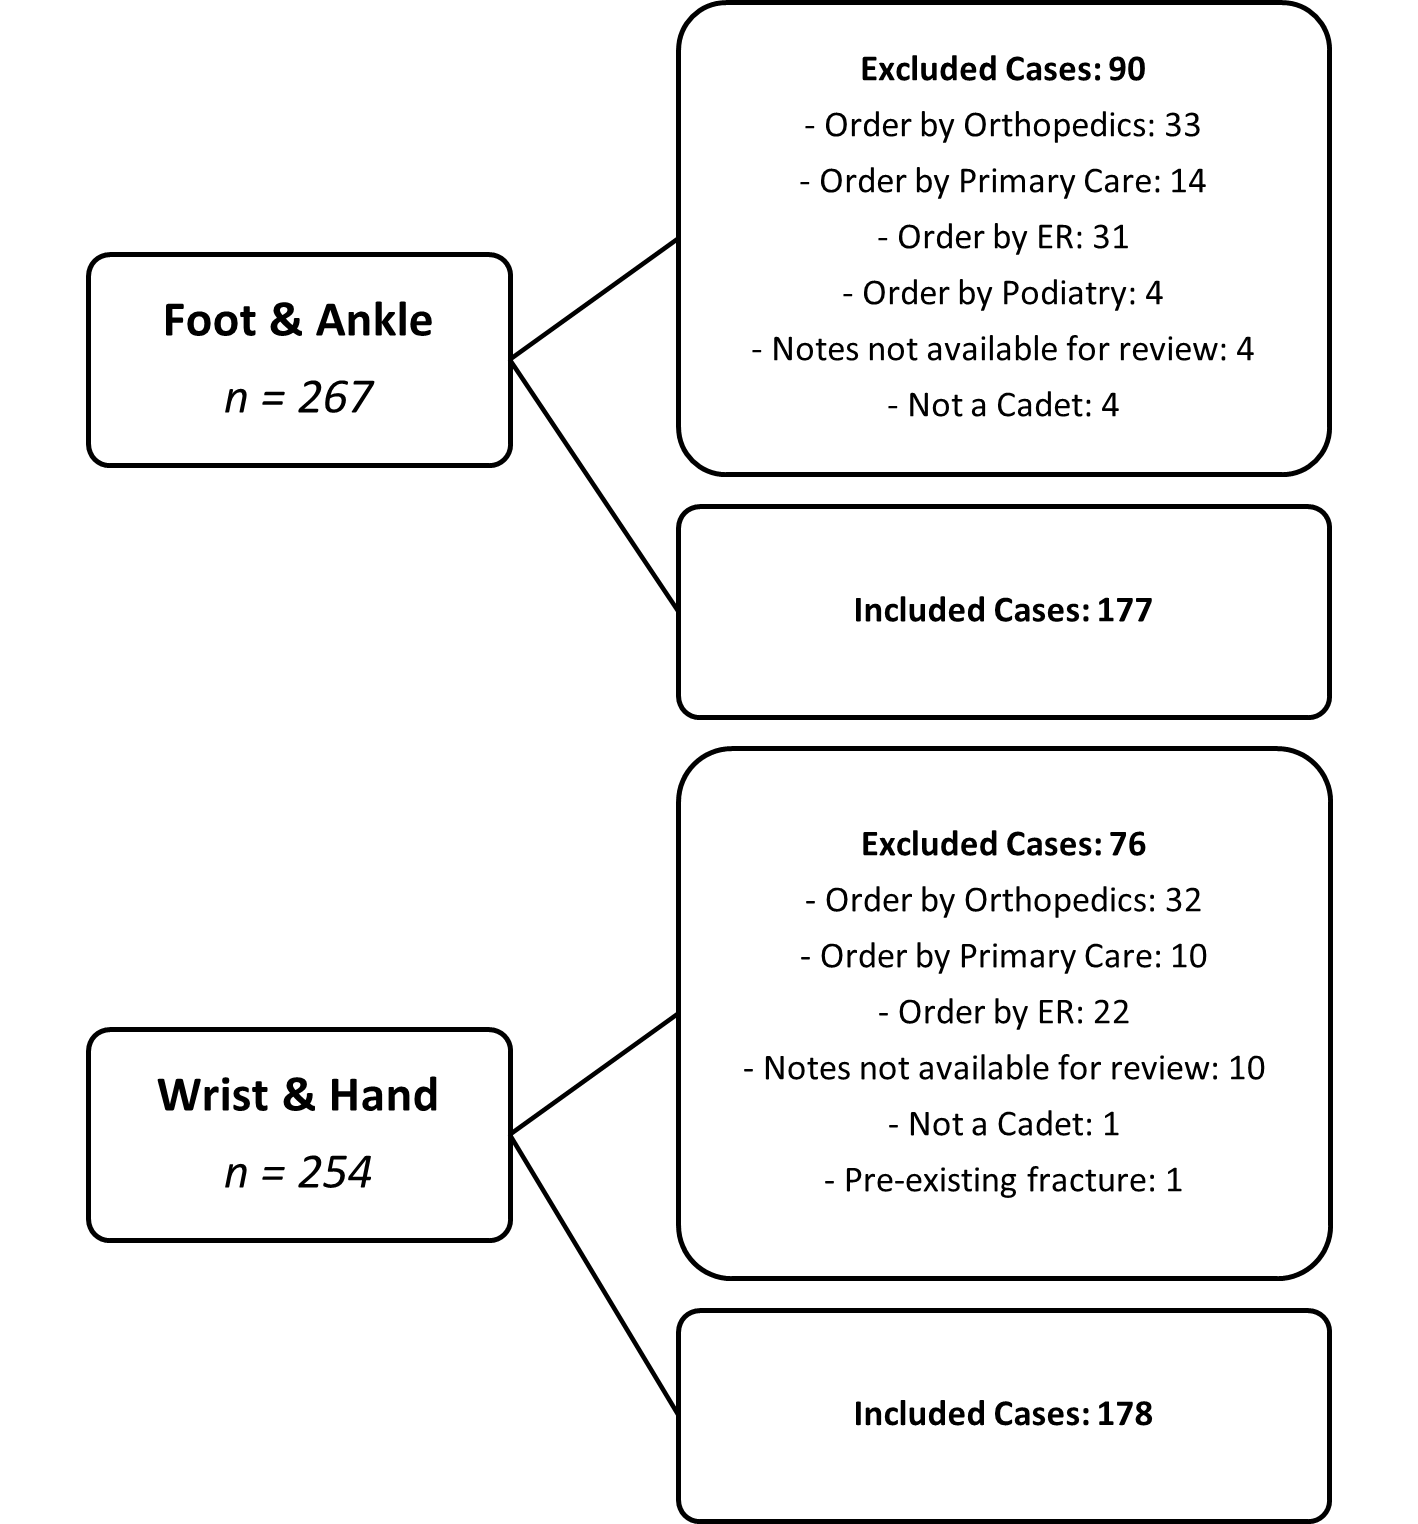
From June 2014 to June 2018 with a location code for the Arvin Physical Therapy Clinic, there were 267 imaging orders for foot/ankle injuries and 254 imaging orders for wrist/hand injuries (Figure 1). Because the search was filtered by location and not ordering provider, records were returned that were not ordered by a physical therapist. The final analysis included 177 cases of foot/ankle injuries and 178 cases of wrist/hand injuries ordered by 15 physical therapists. There were 90 cases of foot/ankle injuries and 76 cases of wrist/hand injuries excluded when the imaging was ordered by other medical providers. Demographics are shown in Table 2.

Table 3 shows the cases diagnosed as fractures, the time/visits to imaging from the initial physical therapy evaluation, and the time to definitive care for diagnosed fractures. Fractures were noted in the radiology report for 16% of the foot/ankle cases and 24% of the wrist/hand cases. There were no significant differences between foot/ankle and wrist/hand injuries for the percentage of imaging orders diagnosed with a fracture or the time in days/visits from initial evaluation to imaging. The physical therapist waited for an average of 3.9 days and 1.3 visits before ordering imaging for foot/ankle injuries and 3.7 days and 1.2 visits for wrist/hand injuries. The time to definitive care from the initial physical therapy evaluation was significantly different (p = 0.04) for foot/ankle fractures (0.6 days) compared to wrist/hand fractures (5.0 days).
The diagnostic accuracy of the Ottawa Ankle Rules in screening for fractures is shown in Figure 2, with a negative likelihood ratio (-LR) of 0.11 (0.02, 0.72) and positive likelihood ratio (+LR) of 1.99 (1.62, 2.44). The diagnostic accuracy of other elements of the patient history and physical examination are shown in Table 4; no individual element of the examination demonstrated acceptable diagnostic accuracy to either rule out or rule in fractures in foot and ankle or wrist and hand injuries.
DISCUSSION
The purpose of this study was to describe the utilization of diagnostic imaging in acute foot/ankle and wrist/hand injuries by physical therapists in a direct-access sports physical therapy clinic. Orders for radiographs resulted in the diagnosis of a fracture in 16% of foot/ankle cases and 24% of wrist/hand cases. The results partially confirmed the hypotheses. For screening for fracture, the diagnostic accuracy of the Ottawa Ankle Rules was similar in this direct-access physical therapy setting as was previously reported in emergency departments. No individual examination item had a clinically meaningful likelihood ratio for the diagnosis of foot/ankle or wrist/hand fractures. The average time from the initial physical therapy evaluation to definitive care was less than five days for foot/ankle fractures, but equal to five days for wrist/hand fractures. There were no significant differences in the rate of imaging that resulted in the diagnosis of foot/ankle or wrist/hand fractures. This is the first study to describe how physical therapists working in a direct-access setting utilize diagnostic imaging to diagnose fractures.
The Ottawa Ankle Rules performed similarly in this sample of young, athletic patients evaluated by physical therapists without physician referral compared to patients evaluated in an emergency department by emergency medicine physicians and a previous study of similar patients evaluated by orthopaedic surgeons and physical therapists. The Ottawa Ankle Rules were designed to be a screening test, where the -LR is the statistic of most interest. In a 2003 systematic review, the -LR was 0.06 (0.02, 0.19) when applied at less than 48 hours from injury and 0.11 (0.07, 0.18) when applied greater than 48 hours from injury.32 In a similar population as this study, the Sn of the Ottawa Ankle Rules when used by both orthopaedic surgeons and physical therapists was 1.0 (0.93, 1.0) (because there were no false negative tests, a -LR was unable to be calculated).35 In this study, the -LR was 0.11 (95% CI 0.02, 0.72), with a very large proportion of acute foot/ankle injuries (82.5%, mean duration of symptoms 10.1 days), equal to the value reported by Bachman et al at greater 48 hours from injury.
Although the time from the initial physical therapy evaluation to definitive treatment was significantly different for foot/ankle and wrist/hand fractures, it was less than one week in both regions. On average, those with foot/ankle fractures were definitively treated within 24 hours, while those with wrist/hand fractures were definitively treated in less than one week. According to the American College of Radiology (ACR) Appropriateness Criteria for acute ankle pain, the current clinical imaging guidelines to determine if radiographs are necessary are the Ottawa Ankle Rules.36 For the initial imaging of suspected acute hand and wrist trauma, the ACR Appropriateness Criteria state that radiography is always indicated.37 It was not feasible to determine the proportion of patients that had imaging ordered and the ACR Appropriateness Criteria recommendations for radiographs are more clear for acute foot/ankle injuries than acute wrist/hand injuries. Differences between the two regions may be due to the absence of clinical decision rules in the upper extremity and/or the need for repeat radiographs to effectively rule out fractures in the early stages (i.e., scaphoid).
Fractures were diagnosed by physical therapists in 1.6 out of every ten foot/ankle radiographs and 2.4 out of every ten wrist/hand radiographs. While radiographs are often ordered to rule out fractures, this means that physical therapists “hit the target” more frequently when ordering wrist/hand radiographs. Keil et al retrospectively analyzed 108 diagnostic imaging referrals by civilian physical therapists practicing in a direct-access setting.17 Among 13 orders for foot/ankle or wrist/hand radiographs, they reported seven fractures, which equates to 54% of all radiographs. The difference in the proportion of radiograph orders that resulted in a fracture diagnosis may have been due to differences in the patient populations, although the demographics of the patients were not reported in the Keil et al study.
There are several limitations to this study. The patients whose cases were reviewed were all young, physically active Cadets at a single military medical facility, which may limit generalizability to other populations and age groups. This was a retrospective study. While the patient notes for each case were thoroughly reviewed, providers may have made verbal recommendations or failed to document information that was not reflected in the electronic medical record. Specifically, when an element of the patient history or physical exam was missing (i.e., ability to continue play, etc.), we coded that element as negative. While many military physical therapists do not document all negative findings, this may have affected the calculation of diagnostic accuracy. Five board-certified physical therapists reviewed imaging orders and extracted results from the official radiologist’s report, which is a potential source of bias for the observational results. The physical therapists reviewing the cases had to make judgments on the presence or absence of elements of the examination when there was missing or incomplete information. The only cases of foot/ankle and wrist/hand injuries studied were those referred for diagnostic imaging and do not represent the entire sample of patients with injuries to those regions, thus creating selection bias in the calculation of diagnostic accuracy.
Conclusion
Physical therapists utilizing diagnostic imaging in a direct-access sports physical therapy clinic diagnosed fractures when ordering radiographs in 16% of foot/ankle cases and 24% of wrist/hand cases. The diagnostic accuracy of the Ottawa Ankle Rules was similar to previously reported values and no individual examination item was able to assist in fracture diagnosis. The average time from the initial physical therapy evaluation to definitive care was short in both foot/ankle and wrist/hand fractures. Future research should utilize larger data sets available in both civilian and military electronic medical record systems to explore the impact of direct-access physical therapy on fracture management and identify clusters of tests that may assist in the diagnosis of various wrist/hand and foot/ankle fractures.
DISCLAIMER
The opinions or assertions contained herein are the private views of the authors and are not to be construed as official or reflecting the views of the United States Army or Department of Defense.
ETHICS APPROVAL
Study was approved by the Naval Medical Center Portsmouth Institutional Review Board (RHC-A-20-051).