
Introduction
CrossFit imposes physical demands on different body segments through multiple exercises.1 For example, during the squat, participants’ lower limb muscles must generate movement primarily in the sagittal plane while stabilizing the motion in the frontal and transverse planes to maintain proper dynamic knee alignment.2 Moreover, exercises involving weightlifting (e.g., Olympic lifts and power lifts) and gymnastic-like movements (e.g., push-ups and ring exercises) require trunk strength to be performed correctly.3,4 The demand for trunk strength may explain the high injury rate in the lumbar spine in CrossFit practitioners.5,6 CrossFit exercises are performed at high velocity, with a high number of repetitions and short or no recovery time between sets,1 thus requiring muscular endurance and power.7 Therefore, CrossFit requires more than only muscle strength to perform workouts.
Several authors have assessed muscular performance in CrossFit participants.8–11 To the authors knowledge, these investigations were limited to measurements of isokinetic peak of torque (PT) and the agonist:antagonist ratios of knee flexors and extensors (known as the hamstring to quadriceps ratio [H:Q] and shoulder internal and external rotators.10 Reference values considering other muscle groups and parameters are needed since CrossFit is characterized by exercises involving multiple body segments and muscle functions (e.g., power, work, and strength endurance). In addition, few studies have investigated inter-limb differences in CrossFit participants.10,12 Considering the symmetric characteristics of the exercises,10,12 it is possible that CrossFit does not impose asymmetrical demand on the dominant (DOM) and non-dominant (NDOM) limbs. If reference values confirm absence of limb-differences, asymmetry findings in clinical assessments may be related to weakness or muscular imbalance in CrossFit participants. Therefore, the comprehensive characterization of multiple muscular performance parameters in CrossFit practitioners will help to understand the muscular profile of CrossFit athletes and the influence of limb dominance. Furthermore, reference values can be used to identify practitioners that lack proper levels of muscular performance and inform preventive programs and rehabilitation of injured athletes.
The purpose of this study was to determine reference values for various aspects of muscular performance of muscles of the trunk, thigh, hip, and mass grasp in CrossFit participants. Also, this investigation aimed to compare the muscular strength measures between male and female CrossFit participants, as well as between dominant and non-dominant limbs. The authors hypothesized that males would present greater muscular strength, work and power, and lower fatigue than females, and there would be no difference between limbs.
Methods
Study Design
This cross-sectional study assessed the isometric strength of the trunk extensors and mass grasp, and isokinetic torque production (as a measure of “strength”), power, work and fatigue of the knee flexors and extensors and hip flexors, extensors, and abductors in CrossFit participants. These muscle groups were chosen to comprehensively assess common muscles used during CrossFit exercises, such as isometric trunk extensors to perform weightlifting, proper mass grasp strength to grasp different equipment, and knee and hip muscles to manage weight-bearing exercises (e.g., squat).
Participants
Participants were recruited from multiple CrossFit gyms. The inclusion criteria were 18 to 45 years of age, a minimum of one year of CrossFit practice, absence of musculoskeletal injury in the prior six months, and no surgery in the prior year. An injury was defined as withdrawing from training for at least seven days or reducing the ability to train for at least 14 days.13 The exclusion criteria were incapacity to perform the investigated tests or experiencing pain during any procedure. None of the participants met the exclusion criteria. The participants provided a written informed consent form, and the University’s Ethics Committee approved this study (Protocol number: CAAE-93670418.9.0000.5149).
Procedures
Initially, the participants performed jumping jacks for one minute to warm up. All tests were performed during the same visit by the same trained examiner (physical therapist with experience with CrossFit athletes and isokinetic evaluations). Before each test, the participant performed three submaximal contractions for familiarization. The participants received standard verbal encouragement to perform maximally during the tests. The DOM limb was defined as the preferred leg to kick a ball as far as possible and the preferred hand to write.
Isometric strength of trunk and mass grasp
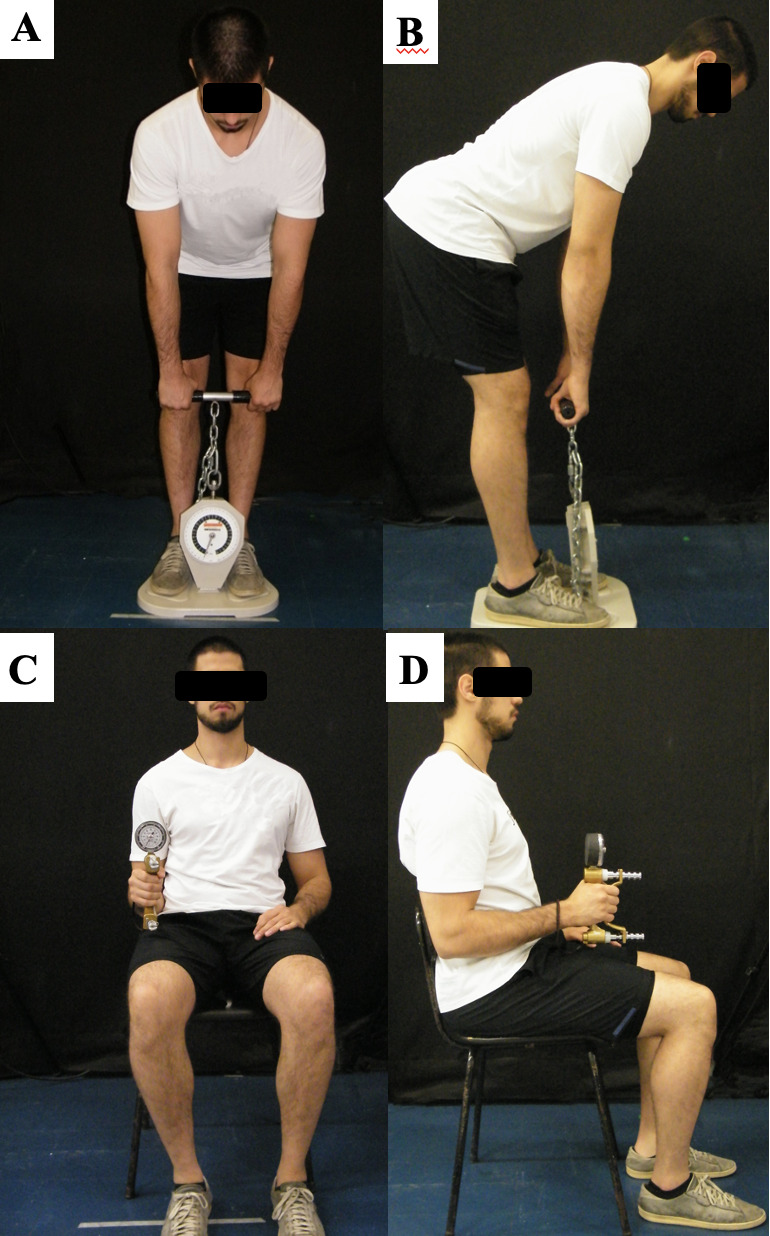
The isometric strength of the trunk extensors was assessed using a Back-Leg Chest Dynamometer (Baseline®, New York, USA).14 The subject was placed in the standing position on the platform, with the knees and elbows extended, and the handle was positioned at the height of the intra-articular space of the knee joint (the trunk was flexed at approximately 60º), and both hands holding the bar of the device (Figure 1). After positioning, the participant was instructed to extend the trunk with maximum muscular contraction and hold for five seconds.
_of_the_trunk_extensors_(frontal_(a)_and_sag.jpg)
Mass grasp was assessed using a Jamar® dynamometer (Warrenville, Illinois, USA). The participant was positioned in a chair without arm support, with the shoulder slightly adducted, the elbow flexed at 90º, and the wrist in a neutral position, following the recommendations of the American Society of Hand Therapy (Figure 1). The isometric contraction was held for five seconds, bilaterally. Isometric strength data were converted into Newtons (N) and normalized by each participant’s body mass to allow comparison between individuals. Three trials were performed for each isometric test, with 30 seconds of rest time between them. The mean was considered for analysis.
The test-retest reliability of the isometric tests was assessed in a prior pilot study performed with 10 participants and an interval of seven days between measurements. All measures had excellent test-retest reliability. The trunk extensor MVIC showed an intraclass correlation coefficient (ICC3,3) of 0.910, confidence interval (95%CI) of 0.680–0.977, and a standard error of measurement (SEM) of 1.49 N/kg. The DOM mass grasp MVIC showed ICC3,3=0.884, 95%CI=0.601–0.970, and SEM=0.92 N/kg. The NDOM mass grasp MVIC showed ICC3,3=0.886, 95%CI=0.541–0.964, and SEM=0.87 N/kg.
Isokinetic performance of the knee and hip muscles
The knee and hip muscles were assessed using an isokinetic dynamometer (Biodex System® 4 Pro, Shirley, NY, USA) in the concentric mode. The isokinetic dynamometer has documented excellent mechanical reliability (ICC=0.99–1.00).15 The knee flexors and extensors were assessed with the participants seated with the trunk inclined at 70º anteriorly, and the trunk and tested thigh stabilized using the chair belts. The rotational axis of the dynamometer was aligned to the lateral epicondyle of the femur, and the distal lever was attached 2 cm above the lateral malleolus (Figure 2). The range of motion was 95º (100º to 5º of flexion; 0° = full knee extension). Concentric strength of the knee flexors and extensors was assessed during five repetitions at 60°/s and 30 at 300°/s.
__hip_flexion_and_extension.jpg)
The hip flexors and extensors were assessed with the participant positioned supine over the dynamometer chair. The rotational axis was aligned anteriorly and superiorly to the greater trochanter of the femur. The distal lever was attached to the distal third of the thigh, and the range of motion was 110º (10º to 120º of flexion) (Figure 2). The hip flexors and extensors were assessed concentrically during five repetitions at 60°/s and 30 repetitions at 240°/s.
The hip abductors were assessed with the participant positioned side-lying, with the assessed limb positioned parallel to the ground in a neutral position. The contralateral hip and knee were flexed and fixed with straps. The trunk was stabilized using a belt proximal to the iliac crest. The axis of rotation of the dynamometer was aligned with the greater trochanter of the femur, and the distal lever was attached to the distal third of the thigh (Figure 2). The range of hip motion was 45º (0º [neutral position] to 45º of hip abduction). The hip abductors were assessed five repetitions at 60°/s and 30 repetitions at 240°/s.
The participants had one minute of rest between assessments at different angular velocities. The variables that were examined included the peak of torque (PT) and maximum repetition of total work (MW) normalized by body mass and multiplied by 100; and power. In addition, we analyzed the flexors:extensors ratio for the knee (H:Q) and hip (HF:HE) joints. The fatigue (ratio of the difference between the work in the first third to the work in the last third of the test, expressed as a percentage) was obtained only at 300º/s and 240º/s for the knee and hip joint respectively.16
Statistical analysis
Descriptive analyses were used to characterize the sample and the study variables. Data normality was verified and confirmed with the Kolmogorov-Smirnov test. Independent t-test was used to compare sexes in the trunk extensor strength, and mixed analysis of variance (ANOVA) was used to compare sexes and limbs in the mass grasp strength. Finally, mixed multivariate analyses of variance (MANOVA) were used to compare the hip and knee isokinetic variables between sexes and lower limbs. ANOVA was performed to locate differences identified by MANOVA. All analyses were performed using SPSS 19 (SPSS Inc, Chicago, USA), considering an alpha level of 0.05.
Results
The study assessed 111 participants (58 males and 53 females). The descriptive characteristics of the participants are presented in Table 1.
The reference values for trunk extensors, mass grasp, knee flexors and extensors, and hip flexors, extensors, and abductors are presented according to the participant’s sex and limb dominance in Tables 2 to 5, respectively.
Participant’s sex and limb differences
Males demonstrated greater isometric strength of the trunk extensors (d = 1.563; p < 0.001) and mass grasp (ηp2 = 0.131; p = 0.001) than females. The DOM hand had greater mass grasp strength than the NDOM hand (ηp2= 0.145; p < 0.002). No sex vs limb dominance interaction effect was observed for the mass grasp (ηp2 = 0.002; p = 0.674) (Table 2).
For the knee flexors and extensors, males presented greater values of torque, work, power than females (p < 0.05), except for fatigue (p > 0.05) (Table 3). The DOM limb had a smaller H:Q ratio at 60º/s (ηp2 = 0.048; p = 0.021) and 300º/s (ηp2 = 0.062; p = 0.008), higher knee extensors power 60º/s (ηp2 = 0.059; p = 0.015) and lower fatigue (ηp2 = 0.094; p = 0.002) than the NDOM limb. No sex vs limb dominance interaction effect was observed for the muscular performance variables of the knee joint (p > 0.05) (Table 3).
For the hip extensors, males showed greater values of torque, work, and power than females (p < 0.001), except for fatigue (p > 0.05) (Table 4). For the hip flexors muscles, males had greater values than females for PT at 60º/s (ηp2 = 0.087; p = 0.040) and 240º/s (ηp2 = 0.214; p = 0.001), MW at 240º/s (ηp2 = 0.130; p = 0.011) and power at 60º/s (ηp2 = 0.421; p < 0.001) and 240º/s (ηp2 = 0.39; p < 0.001). In addition, males had a greater HF:HE ratio at 60º/s (ηp2 = 0.041; p = 0.033) and 240º/s (ηp2 = 0.059; p = 0.010) than females. No main effect of limb dominance or interaction effect between sex and limb dominance was observed for all isokinetic variables related to hip flexors and extensors (p > 0.05) (Table 4). For the hip abductor, males developed greater power at 60º/s (ηp2 = 0.342; p < 0.001) and 240º/s (ηp2 = 0.308; p < 0.001) than females. No other main effect or interaction effect between sexes and limb dominance was observed (p > 0.05) (Table 5).
Discussion
The present study provides reference values for trunk extensors and mass grasp isometric strength and for isokinetic parameters for the knee and hip joints according to the participant’s sex and limb dominance. Males exhibited greater torque, work, and power than females in almost all tested muscles, as hypothesized. Finally, a difference between DOM and NDOM limbs was only observed in a few variables.
The isometric strength of the trunk extensors was assessed in a standing position, with the trunk bending forward, a posture similar to the one adopted during powerlifting exercises performed during CrossFit sessions. This proposed protocol could be used to compare CrossFit practitioners to other athletes aiming to understand the trunk strength profile in CrossFit participants. For example, the CrossFit male practitioners assessed in the current study demonstrated similar performance to the findings reported to judokas submitted to the same protocol (15.69 N/kg).17 Furthermore, the mass grasp was assessed since the CrossFit involves multiple exercises to grasp the equipment, such as the bar during weightlifting. CrossFit practitioners of the present study also showed mass grasp strength similar to what was reported for judokas,18 but lower than climbing athletes, who produced 7.39 N/kg (average of the DOM and NDOM hand).19 It is noteworthy that the trunk extensors and mass grasp were assessed since these muscles are recruited in several CrossFit exercises, such as deadlift20 and gymnastic-like movements.21 To the authors knowledge, this is the first study to investigate reference values for the performance of these muscles.
The present study provides reference values for multiple knee and hip muscular performance parameters. Few studies have assessed the isokinetic muscular performance in CrossFit participants.10,22 Kramer et al.22 reported isokinetic knee PT to determine the effect of chronic dietary nitrate supplementation on muscular strength. However, these authors did not normalize the torque values by body mass, which limits the comparison to the current findings. Furthermore, Motta et al.10 described slightly greater values of concentric PT of knee flexors extensors and H:Q ratio in both sexes compared to reported in the present study. As Motta’s sample presented a sample of CrossFit athletes who had participated for 2.9 years (males) and 2.5 years (females), and the sample of the present study had been trained for approximately 2.4 years (males) and 2.1 years (females), the difference in muscular performance between studies cannot be explained solely by the different experience-level in CrossFit, however the specifics of workouts may, in part, explain this difference. However, the effect of experience-level was not assessed in the present study. Male CrossFit athletes had lower knee muscular performance than those reported in football players23 and long-distance runners24 and higher performance compared to non-athletes.25 Therefore, it appears that the muscle strength profile depends on the specifics of the sport practiced by an individual. The present study expands the muscular performance data for CrossFit participants since previous studies focused only on assessment of the knee or shoulder joints and PT or agonist:antagonist ratio variables. Thus, the current findings provide valuable and comprehensive information about muscular performance in CrossFit participants.
Reference values for maximum work, power, and fatigue were considered important to evaluate since CrossFit workouts involve high-intensity exercises performed quickly with little or no recovery time.1 These variables are essential since they inform about the capability of the muscle to develop torque during the range of motion (work), to sustain torque across the repetitions (fatigue), and about how fast a muscle can produce work (power).16 Therefore, these muscular performance parameters investigated in the current study can contribute to understanding the impact of CrossFit on these physical attributes. Also, the data obtained in the present study may be used as a reference in sports settings (training and rehabilitation) and allow comparisons to future studies.
CrossFit female participants presented a mean knee H:Q ratio varying from 46.25% to 54.46%, whereas male participants presented 46.58% to 54.52% at both isokinetic velocities. These H:Q ratio values below 60% suggest that the CrossFit participants have a strength imbalance between the hamstring and quadriceps (i.e. lower hamstring strength). The ratios seen in this study were similar to those reported among CrossFit athletes by Motta et al (mean, 52.12%).10 In both studies, the observed values of H:Q are lower than 60%, value indicated in the literatures as expected ratio.26 Therefore, the results of the present study reinforce the Motta et al.10 findings and suggest that CrossFit practice may favor a lower H:Q ratio (muscle imbalance). More studies are necessary to investigate which specific exercises during CrossFit may favor this lower H:Q ratio. Nevertheless, muscular imbalances are a risk factor for injury in athletes,26 suggesting that CrossFit strengthening programs should consider minimizing the imbalance between hamstring and quadriceps strength. Furthermore, there are no data in the literature about the hip F:E ratio in CrossFit participants. The current findings of the hip F:E ratio (males, 68%; females, 62%) were similar to those reported in healthy individuals (males, 75%; females, 65%).27
Considering the isokinetic fatigue assessment of 30 repetitions, CrossFit practitioners showed fatigue of approximately 40% for knee extensors, 42% for knee flexors, 37.5% for hip extensors, 24.5% for hip flexors, and 26.5% for hip abductors. CrossFit involves high power throughout the training with little or no recovery time, which can produce muscle fatigue.28 Indeed, Maté-Muñoz et al.28 reported that the exercises performed in one CrossFit training session resulted in muscle fatigue, decreased jump height, and maximum strength and power in athletes. The present study’s findings demonstrated that the knee muscles showed greater fatigue than the hip muscles, for both sexes. This difference may be due the type and characteristics of exercises performed during workout. However, as training aspects were not evaluated, it is not possible to establish the reason for the greater fatigue in the knee muscles. Therefore, more studies are necessary to identify whether greater knee fatigue is a tendency in CrossFit practitioners, specifically, whether training characteristics could be associated with less fatigue resistance in this joint.
The assessment of sex-based differences revealed that males exhibited greater muscular performance parameters than females, even after normalizing the variables by body mass, corroborating a previous study.10 Considering that muscle strength is influenced by body size, normalization of these variables by body mass has traditionally been performed to remove body size dependence and allow comparison between different populations and studies.29 However, strength normalization by body mass minimized, but did not eliminate, sex differences. The fact that males have a higher percentage of lean mass (80.15%) relative to total body mass than females (70.8%),10 lower body fat percentage, and a greater muscle fiber cross-sectional area30 likely explains this finding. Although both males and females adapt similarly to resistance training for lower-body strength,30 the differences between sexes observed in the present study demonstrated the importance of reporting strength outcomes according to participants’ sex.
The bilateral comparisons were performed to investigate the presence of inter-limb asymmetries. The DOM limb demonstrated significantly better performance than the NDOM only for knee extensor power at 60º/s and fatigue and mass grip strength and lower H:Q ratio than the NDOM limb during both angular speeds. The clinical relevance of these differences must be addressed since they represent only small mean differences between limbs. Despite the statistical significance reached due to the large sample size, the magnitude of the differences suggests that these asymmetries are not clinically relevant since the differences were lower than 10% for all variables. Values above 10% or 15% of inter-limb difference have been associated with an increased risk of sports injuries.31 The current results suggest that CrossFit does not impose an asymmetrical demand between lower limbs, which may be consistent with the movement and types of bilateral exercises performed in this training. Evidence that CrossFit participants presented higher symmetry between sides in Functional Movement Screen scores (such as hurdle step, line lunge, rotatory stability, and shoulder mobility)12 reinforces this argument.
A limitation of the present study was the investigation of only one type of contraction in each muscle group (either isometric or concentric isokinetic). Future studies should consider the assessment of eccentric contractions to enhance the knowledge of the muscular profile since this type of contraction is also required during CrossFit exercises. The current study is an initial comprehensive analysis needed to characterize this population using gold-standard instruments. The present study described multiple muscular performance parameters for knee and hip muscles and assessed trunk and mass grasp strength as these segments deal commonly involved in the demands of CrossFit and show a high prevalence of injuries.6,32 These data may help to establish pre-injury values to be considered in rehabilitation or preventive programs for this population. Future studies may focus on a comprehensive evaluation of upper limb muscles in this population.
Conclusion
The results of this study provide reference values for muscular performance in CrossFit participants, including parameters related to work, power, and fatigue. The reference values were reported according to the participant’s sex and limb dominance. Males had greater values of muscular performance parameters than females, even after normalizing the variables by body mass, revealing the importance of reporting muscular performance separately for each sex. As lower H:Q ratio was observed, future studies could assess the agonist:antagonist ratio in other joints and verify the workout specificities that could contribute to possible imbalances. Finally, the results suggest that CrossFit does not impose an asymmetrical demand on the assessed muscles as inter-limb differences were not observed. The muscular performance information provided can be used in future investigations and clinical and sports settings.
Declarations of interest
None.
Acknowledgment
Coordination for the Improvement of Higher Education Personnel (CAPES - Finance Code 001), State of Minas Gerais Funding Agency (FAPEMIG), and National Council for Scientific and Technological Development (CNPq- Process: 305285/2021-1)