INTRODUCTION
Youth and high school sports have become increasingly competitive over recent years. Children are beginning to specialize in a specific sport at a younger age and often play year-round or even on concurrent teams. The repetitive nature of the motion of a baseball pitch in combination with the stress that the pitching motion places on the musculoskeletal system of a developing body put youth and adolescent baseball pitchers at risk for shoulder and elbow injury.1,2 Sports-related injuries in young baseball pitchers is a topic that is currently receiving significant attention in the sports medicine world due to the high prevalence of injuries.
The act of throwing an overhand baseball pitch is one of the fastest known motions a human being can produce.3 This complex movement pattern puts an incredible amount of stress on the human body and often leads to injury. Little League Baseball is the world’s largest organized youth sports program with three million children playing baseball in the USA.4 Due to the growing popularity of youth sports, like baseball, and the opportunity to participate in multiple leagues year-round, throwing related injuries continue to rise. Fleisig et al. identified that up to five percent of youth pitchers suffer a serious non-contact elbow or shoulder injury requiring surgery or retirement from baseball within ten years following the injury.5 Furthermore, up to 74% of youth baseball players between the ages of 8-18 report some degree of arm pain while throwing.4 Evidence has also demonstrated that the volume of pitches and amount of rest taken by athletes elevates the risk of injury. According to a study by Fortenbaugh et al., a pitcher who continues through fatigue was 36 times more likely to undergo surgery.6 To prevent a further increase in injuries to baseball pitchers, it is crucial to identify risk factors for injury.
An abundant amount of literature has examined the risk factors that predispose a high school, college, or professional baseball pitcher to injury. These risk factors include anthropometric measurements, biomechanical flaws seen during the pitching motion, or general overuse. For example, glenohumeral rotational range of motion (ROM) deficits, strength deficits, and height have all been identified as risk factors for injury.2,5,7–10 Biomechanics of pitching such as stride length, pelvic tilt, and arm slot influence the amount of force experienced by the upper extremity and can be predictive risk factors for injury.11,12 With more youth specializing in one sport and participating in multiple leagues year-round, overuse has also become a growing concern for injury risk. Previous authors have found that number of pitches thrown, throwing on consecutive days, playing in multiple leagues, and other positions played can put a youth pitcher at an increased risk for injury.5,10,13–16 For instance, an average of more than 80 pitches per game almost quadrupled the chance of surgery.5 In addition, pitching competitively for more than eight months per year increased the odds of surgery fivefold.5 The lack of recognition of an injury was identified as a risk factor for further injury as the initial injury may not have been managed appropriately.17 While pitching is a heavily researched topic, there is little to no research that has examined the link between each of these risk factors in the youth and adolescent populations.
While pitching mechanics are highly variable between youth and high school pitchers, variability of kinematic parameters decreases with an increase in the level of development.6 Aguinaldo et al. examined the segmental flow of energy during the pitching cycle in collegiate and professional pitchers.18 This study broke down the pitching cycle from initial lead foot contacting the ground (foot contact) to the moment the ball left the subject’s hand (ball release) and examined when peaks in certain kinematic variables occurred. The peak kinematic variables included trunk rotation velocity, trunk rotation ROM, pelvic rotational velocity, shoulder external rotation ROM, and shoulder internal rotation velocity. While studies have examined these values in high school, collegiate, and professional pitchers, no study has looked at these variables in a younger population.18,19 The purpose of the current study was to examine the average timing of peak kinematic variables in youth and adolescent baseball pitchers. The results were compared to previous studies examining the same variables in collegiate and professional pitchers.
It was hypothesized adolescent baseball pitchers would experience peaks in kinematic variables at different times throughout the pitching cycle as compared to professional/collegiate pitchers.
METHODS
This study was reviewed by Saint Francis University’s Institutional Review Board and was approved. Subject recruitment occurred through the researcher’s making appearances at local baseball practices and contacting local little leagues. Players were informed of the details of the study through a PowerPoint designed by the research team. Based on a statistical power analysis (G*Power 3.1), 23 participants were needed as the minimum sample size for detecting a significant relationship between independent and dependent variables at a power of 0.95 and an effect size of 0.80. After the recruitment of each subject, informed consent was obtained by the participant and their parent/guardian. Participants initially completed a questionnaire and if the subject was a minor the questionnaire was completed with a parent/guardian present. The questionnaire consisted of questions aimed to identify previously identified risk factors for injury in overhead athletes including pitching volume, pain or discomfort before or after pitching, playing in multiple leagues, positions played, history of previous injury, and types of pitches thrown. Demographic measurements were collected including height, weight, and hand dominance. Anthropometric measurements were taken before motion analysis testing.
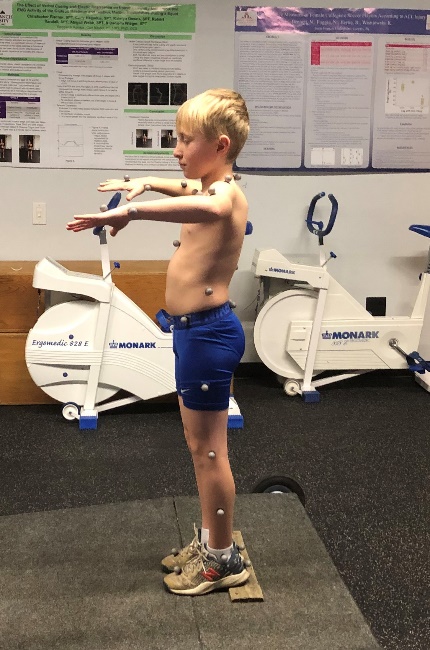
The subjects completed approximately 10 minutes of a stretching routine of their choice to prepare for pitching. Reflective markers were placed on the bony landmarks of the subject for motion analysis (Figure 1) using a full body monitoring marker set. Upper extremity markers were placed on both arms on the acromion process, lateral epicondyle, upper arm between the elbow and shoulder, forearm between the elbow and wrist, radial styloid, ulnar styloid, and third metacarpal. Lower extremity markers included: anterior superior iliac spine (ASIS), posterior superior iliac spine (PSIS), iliac crest, lateral aspect of the thigh between the iliac crest and lateral femoral condyles, lateral femoral condyles, lateral aspect of the tibia between the lateral femoral condyle and lateral malleolus, lateral malleolus, dorsum of foot at second metatarsal, and posterior aspect of the heel. Markers on the torso included C7 and T10 spinous process, sternoclavicular (SC) joint, xiphoid process, and the right scapula.

Once markers were in place, the subject’s anthropometric data was entered into the motion capture system. Next, the subject was allowed 20 pitches from a pitching mound to further their warm-up and allow them to adjust to the mound. Subjects wore their own sneakers and threw to a net with a strike zone target located 40 feet from the pitching rubber. After the player completed 20 pitches, the following five pitches were recorded using a VICON® motion capture system. The VICON® motion capture system used eight high-speed (120 hz) cameras. Motion analysis is the reference standard for assessing joint angles during complex movements such as the baseball pitch and has been proven to be highly reliable and valid.20 The system captured the motion and angular velocities of various joints, including those of the pelvis, trunk, and upper extremity during the pitching motion. The subject’s arm slot position (shoulder abduction angle), shoulder maximal external rotation, and stride length were analyzed.9,21 Data were processed and the average of the five trials for each subject was calculated for each variable independently using VICON Polygon® data analysis software. Previous authors have suggested that ideal stride length is slightly less than body height, and this measurement was recorded as a percentage of the athlete’s body height.22,23
Following data collection, mean values and standard deviations were calculated across all tests and measures of the study to determine the prevalence of the risk factors among the participants.
RESULTS
Twenty-four participants participated in the study, average age being 12.75 years old (SD ± 2.02). Of the 24 total participants, 23 subjects were right-hand dominant, and one subject was left-hand dominant.
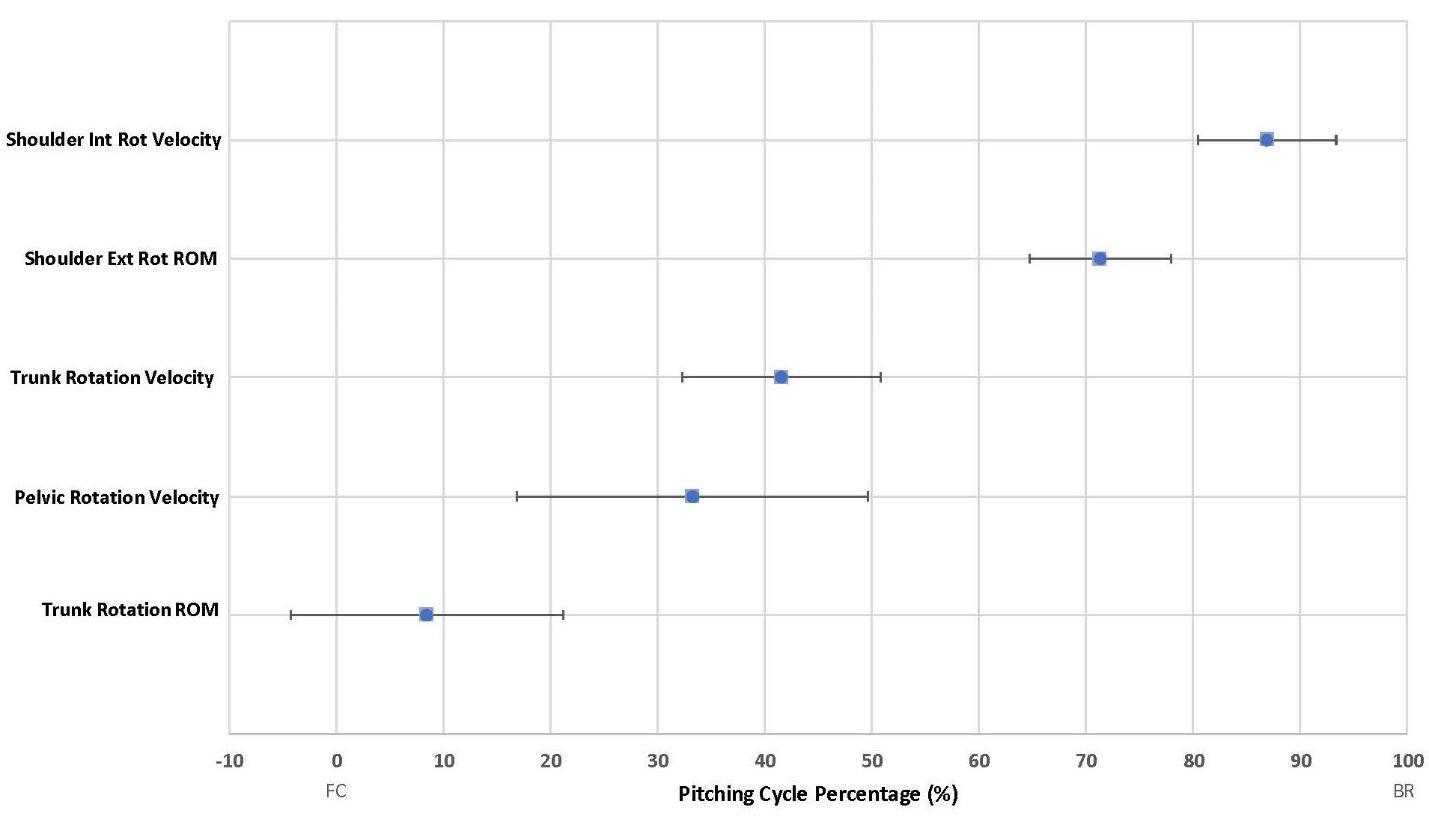
Table 1 displays the average maximum values and standard deviation for kinematic variables of the pitching cycle measured across the 24 subjects. Table 2 displays the mean and standard deviation of the peak kinematic variables related to the pitching cycle. These values are recorded as percentages of the pitching cycle, defined from foot contact (0%) to ball release (100%). The timing of each peak kinematic variable, as outlined in Table 2, were found to occur at distinct points in the pitching cycle. Figure 2 illustrates the timing of the mean of the maximum kinematic values as they occurred throughout the pitching cycle.

DISCUSSION
The proper segmental flow of energy throughout the body is vital during the baseball pitch. When energy is not being transferred through the body appropriately, it decreases the mechanical efficiency of the pitch and increases the risk of injury.19,24 Previous investigators have examined the segmental flow of energy and its relation to elbow torque during the baseball pitch in collegiate and professional baseball pitchers.18 One study to date has analyzed this in high school baseball pitchers.19 There were significant differences between the professional and high school groups in the timing of the following variables in relationship to the pitching cycle: maximum pelvis rotation velocity (42.9% vs. 27.9%, respectively), maximum trunk rotation (33% vs. 2%, respectively), and maximum shoulder internal rotation velocity (102.4% vs. 93.0%, respectively).19
Compared to the data referenced in the previous paragraph, the results of this study indicate that youth pitchers experienced peaks in certain kinematic variables approximately 10% earlier in the pitching cycle compared to collegiate and professional pitchers. While it cannot be confirmed why this difference in peak variables occurred earlier in the subjects in the current study, the findings also demonstrated a shorter stride length as a percentage of height as compared to collegiate/professional pitchers. The decrease in stride length may account for the difference in timing. The shorter stride length would cause the stride foot to contact the mound earlier in the pitching delivery, likely initiating the transfer of energy through the pelvis, trunk, and throwing shoulder earlier in the pitching cycle and potentially influencing the efficiency of energy transfer during pitch delivery.
In the current study the average stride length was 81.9% of the participant’s height. According to previous studies, normative data for stride length in youth pitchers is variable. Fry et al. examined ninety-two 9-14 year-old pitchers and found the average stride length 66% of height.23 However, another study by van Trigt et al. examined 52 pitchers ages 10-18 had an average stride length of 79.8%.25 Although not defined by age, the American Sports Medicine Institute also reported that a pitcher’s stride length should be slightly less than the height of the pitcher.22 Montgomery and Knudson found that the optimal average stride length of six professional pitchers was 85-90% of their height in order to increase pitching speed.26 The norms of stride length in youth baseball pitchers have not been well established, therefore, normative values for professional pitchers, as reported by Montgomery and Knudson, were used for comparison to the current subjects.26
Maximum pelvic rotation velocity occurred slightly before maximal trunk rotation velocity, followed by maximal shoulder internal rotational velocity. The results confirm that energy is being transferred from the ground through the arm through a specific kinematic sequence. These results closely resemble the results found in the collegiate and professional baseball pitchers researched by Aguinaldo and Escamilla.18,19 While these events closely resemble the collegiate and professional pitcher, the timing of these events occurred consistently earlier throughout the pitching cycle in youth and adolescent subjects. Additionally, previous studies have demonstrated that lower body mechanics have an influence on the forces experienced by the upper body.9,21 The notion that professionals can throw harder while minimizing the amount of valgus torque they experienced at the elbow suggests that the younger pitchers have some form of biomechanical flaw in their mechanics. The alteration in biomechanics could potentially be explained by a shortened stride length, decreased strength, skeletal immaturity, or limited pitching experience.
There are some limitations of this study. One limitation is the rural location where data collection occurred leading to a small sample size. The small sample size limits the generalizability of the study as these results may not represent the overall population of youth pitchers. A second limitation is that the study took place in a laboratory environment. Since the VICON® motion analysis system has fixed cameras, the data collection for this study was restricted to the confines of the Human Performance Lab which could not accommodate the standard pitching distance for youth and adolescent pitchers. The final limitation of this study would be the inability of the motion analysis system to assess torque throughout the pitching motion. While this study could measure the average peak timing of kinematic variables, torque was not measured due to the capability of the motion analysis system. There is evidence that the elbow generates more torque when the proper segmental flow of energy is interrupted or due to poor body sequential motion.19 Elbow valgus loading and torque are variables that could be used in future studies to correctly identify risk factors throughout the pitching motion in this population.
One significant strength of the current research was the age range that was targeted; 9-16-year-old baseball pitchers. The mean age of participants in the current study was 12.75 years old (SD ± 2.02) while the mean ages of pitchers previously studied by Aguinaldo and Escamilla were 21.9 years old (SD ± 3.6) for professional pitchers and 15.5 years old (SD ± 1.1) for high school pitchers.19 According to the literature review, this younger age range is a heavily under-investigated group. Yet, this is the age range where most injuries occur.2,20,27,28 There is certainly more opportunity for future research to be conducted on this topic. Future research should attempt to recruit a larger sample size with subjects from a larger geographic region. Also, future research is needed to definitively identify why the timing in peak kinematic variables occurred earlier in youth pitchers. This study obtained when the peaks occurred but could not conclude, with certainty, why the peaks happened earlier in the pitching cycle for youth subjects.
CONCLUSION
The results of this study identified that youth pitchers experienced peaks in certain kinematic variables approximately 10% earlier in the pitching cycle compared to data from prior research on collegiate and professional pitchers. Future studies are needed to identify the link between stride length and its effect on the kinematic sequence of the baseball pitch. Because the baseball pitch is a very complex motion that requires a combination of flexibility, strength, and motor control, future studies are needed to identify variables that may be linked to the observed differences between youth and collegiate/professional pitchers. This could give direction to future training protocol development for youth pitchers to minimize injury risk and maximize performance during key developmental years.
Conflicts of interest
The authors of this study declare no conflicts of interest.