

INTRODUCTION
There is an obesity pandemic in the world, resulting in increased medical costs and decreased public health.1,2 There are multiple reasons for and solutions to this pandemic, with one solution being a healthy lifestyle that includes regular exercise.3,4 One of the most accessible exercise options to the public is running. It is well known that many runners suffer from running related injuries, with 19.4% to 79.3% injured every year.5 However, there are many myths and misunderstandings associated with running injuries. A better understanding of running injury risk is needed to minimize injuries, facilitate participation, and improve health conditions.
The causes of running injuries are multimodal and may include training errors, decreased sleep, poor nutrition, history of injuries, anatomical, physiological, and biomechanical factors. There is conflicting information about the importance and relevance of these variables as a whole.6–10 Nonetheless, a proportion of the risk is biomechanical, including running kinetics.6,11–13
While kinematic studies are much more prevalent in the literature, kinetic studies are beginning to fill in the gaps about running biomechanics. With improving technology, running kinetics are being investigated more often. However, presently many of these kinetic studies have investigated ground reaction forces and moments, not joint power.6,14 Joint power is a kinetic measure of the velocity of the joint moment, or the rate of work by the muscles at a particular joint.15
Currently, few studies have examined joint power kinetics and running, with limited studies investigating running injuries.15–17 Dicharry reported that running power kinetics are similar to walking at each joint, just with an increased amplitude.15 Xu et al. recognized that forefoot strike pattern resulted in smaller knee power absorbed and higher ankle power absorbed compared to rearfoot strikers.16 Riley et al. compared overground running joint power to treadmill running and found a statistical difference in knee power generated and ankle power absorbed between the two modes of running.17 To the authors’ knowledge, there are no reports available that have assessed joint power of injured runners.
Therefore, the purpose of this study was to examine what joint power kinetic variables were different between non-injured and injured runners. The hypothesis was joint power kinetic variables would be different between non-injured and injured runners. This information will help identify what joint power kinetics are clinically relevant.
METHODS
Study Design and Subjects
This was a case-control study of injured and non-injured runners. The subjects were considered eligible if they self-identified as runners or had running as a key component of their activity. The injured runners were current physical therapy patients, from provider referral or direct access, within the health system being treated for a running related injury. The injuries were determined by the referring provider or treating physical therapist. The non-injured runners declared no current running injury and completed analysis for performance goals. The sample size was based on existing data and supported by a sample size calculation using G*Power Version 3.1.9.7 based on .05 alpha, .8 power, and a medium-large effect size of .65 for comparing difference between two independent means with a ratio of four cases to one control resulting in 96 cases and 24 controls.
Setting
All data were collected from the running lab at the health system’s primary sports performance and rehabilitation facility. Kinetic and kinematic data were collected from 122 runners (26 non-injured and 96 injured) over three years with a Bertec force plated treadmill and Qualisys 3D motion capture video analysis. The Qualisys Project Animation Framework running performance marker set, which includes 35 static and 35 dynamic markers, was the marker system used during the 3D motion analysis. Subjects completed an independent, self-selected warmup consisting of dynamic stretching or plyometric drills if desired, then were given three to five minutes on the treadmill to walk and run until they verbalized readiness to begin recordings. The data were de-identified and exported by an honest broker, an impartial biomechanical engineer not involved with any other portion of the study. Both the health system and the local university Human Subject Committees considered the study exempt, as this was secondary research with previously collected and de-identified data.
Variables
The primary independent variables were joint power kinetics from the hip, knee, and ankle. These values were collected bilaterally and averaged. The peak power value, normalized to body weight, was recorded for both the power absorbed and the power generated at the joint when running.18 This resulted in six total kinetic variables to consider: hip power absorbed, hip power generated, knee power absorbed, knee power generated, ankle power absorbed, and ankle power generated.
Further variables included age, sex, height, BMI, foot strike, and speed. Height was self-reported and weight was collected on the force plate. Foot strike was categorized as heel strike or non-heel strike based on the kinematic foot inclination angle with a positive value being heel strike and negative value being non-heel strike. To match what the subjects were doing functionally, they wore their own shoes and ran at a comfortable self-selected pace.
Bias
To avoid selection bias between groups, subjects originated from the same general population. Controlling for demographics such as age, sex, weight, foot strike, and running speed in the adjusted logistic regression analyses further helped minimize selection bias. Performance bias was controlled with a standardized running assessment that was completed for both the injured and non-injured group preserving the fidelity to the protocol. The high validity and reliability of the measurement techniques used with the force plated treadmill and Qualisys 3D running analysis software ensures quality of the data.19–21
An honest broker was used to de-identify and export data resulting in a complete and thorough data set, this minimized information and attrition bias. There were no outliers or missing data in the de-identified data, however, one stride of the second trial for subject 58 ankle value was not calculated into the means due to abnormally low power. This was a reasonable way to manage that outlier as there was sufficient data on that subject to calculate an accurate mean for ankle power absorbed. Two 10-second trials of recordings were used to calculate the means of peak power generated at the hips, knees, and ankles of each gait cycle. In the end, all subjects had at least 15 steps (normally > 20) per trial.17
Statistical Methods
All statistical analysis was completed with SAS. All alphas were set at 0.05. Two sample T-tests were used to compare means of joint power kinetics between non-injured and injured runners. A log transformation was required with all variables in the T-tests except knee power absorbed.
A logistic regression was used to create a model with the binary dependent variable being injury status of the runner. The continuous independent variables considered included hip power absorbed, hip power generated, knee power absorbed, knee power generated, ankle power absorbed, ankle power generated, BMI, age, speed, height, and weight. Categorical variables considered included sex, foot strike, BMI categories, and age categories. The final model included age, sex, and BMI as categorical variables and hip power absorbed, hip power generated, knee power absorbed, knee power generated, ankle power absorbed, and speed as continuous variables.
Normality of the kinetic variables were assessed with Shapiro-Wilk, Kolmogorov-Smirnov, Histograms, and Q-Q Plots.22 Five of the six variables were right skewed, requiring a log transformation, as only knee power absorbed was normally distributed pre-transformation.
The predictive value of the logistic regression was assessed with the likelihood ratio of the global null hypothesis. Hosmer and Lemeshow Goodness-of-Fit test was referenced for fit statistics. Area under the ROC curve was given preference during model building, with R-Square adjusted used to compare models and R-Square values referenced for the final model to report total variation in injury status. Outlying and influential values were assessed by assessing the residual plots of Pearson, Deviance, Leverage, and DFBETAS.22
Interactions were tested with custom model building. Multiple comparisons on the interaction term were compared between groups of interest to determine if there was an interaction. Multicollinearity was tested with the correlation coefficients, removing the highest values that resulted in significant model change.22
RESULTS
The average age of the subjects was 29.23 years-old (95% CI 27.03-31.43). The average height was 1.71 meters (95% CI 1.69-1.72). The average weight was 67.62 Kg (95% CI 65.37-69.88). The average BMI was 23.14 kg/m2 (95% CI 22.56-23.73). All continuous descriptive statistics separated for injured and non-injured subjects can be found in Table 1.
Twenty-six subjects (21.31%) were classified as non-injured and 96 subjects (77.87%) as injured. Seventy-three subjects were female (59.84%) and 49 (40.16%) were male. The majority (111/122) of the subjects were classified as heel strikers (90.98%). When designating age categories, subjects under 40-years-old were classified as younger, with 27 (22.13%) subjects being older and 95 (77.87%) subjects being classified as younger. The 40-years-old threshold was used to match the categorization done by USA Track and Field symbolizing a “Masters” athlete.23 When using the CDC classifications of BMI, 83 (68.03%) were classified as healthy, four (3.28%) as obese, 26 (21.31%) as overweight, and nine (7.38%) as underweight.24 All injury locations are reported in Table 1, with some runners having more than one injury. Pertinent descriptive statistics of the injured and non-injured subjects can be found in Table 1.
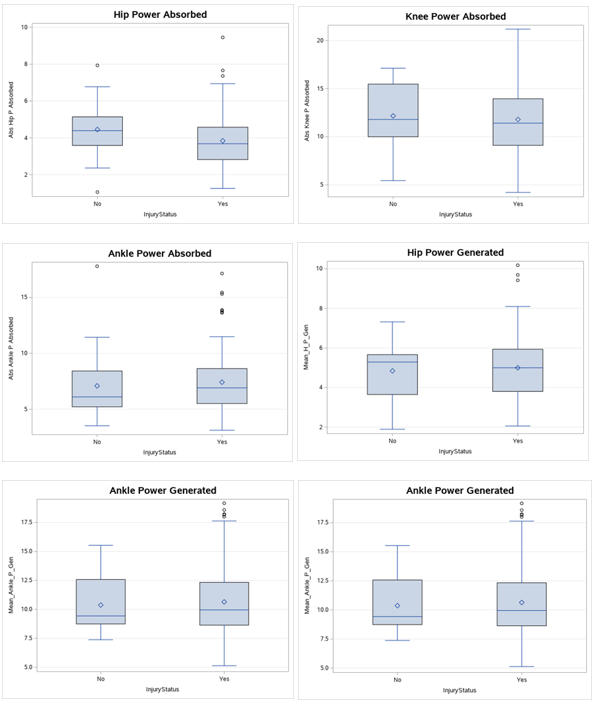
When considering the normality of variables, five of the kinetic variables were right skewed and provided better insight with a log transformation, and only knee power absorbed was normally distributed. Following the transformation, there were no significant differences in the means of the peak kinetic data between the injured and non-injured runners when using a two-sample t-test (p=0.07-0.87). See Table 2 for the means (95% CI) and p-values of the two-sample t-test. Side by side box plots of the joint power variables can be seen in Figure 1.

Although no average peak power variable at the hip, knee, or ankle was significantly different between injured and non-injured runners (p=0.07-0.87); higher hip power absorbed was found to be protective against injuries (odds ratio, .16; 95% CI .025-.88) when considering demographics using a logistic regression model including categorical age, sex, BMI categories, speed, and power absorbed from the hip, knee, and ankle and power generated from the hip and knees. Ankle power generated was omitted secondary to multicollinearity. Analysis of the maximum likelihood estimates of the final logistic regression found the only significant predictor of the variables included was hip power absorbed (p= .041).
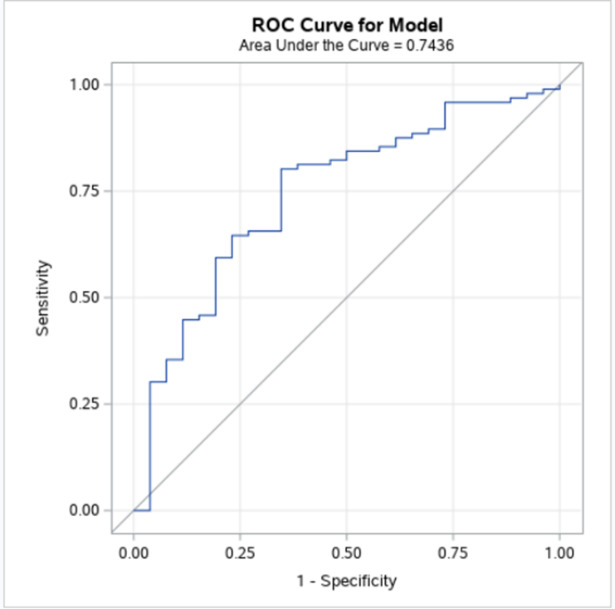
There was a good area under the ROC curve at 74% (Figure 2) suggesting acceptable discrimination. However, the r-squared value was only 9%, suggesting the model is only responsible for 9% of the total variation in the injury status versus a model with no variables. The global null hypothesis did not find any predictive value in the model with a likelihood ratio of only .41. Lastly, throughout the model building, the Hosmer and Lemeshow Goodness-of-Fit test was significant with p-values above .05. However, with the last modification to the model, it’s p-value switched from indicating good fit to a p-value of 0.0499, resulting in a poor fit per the Hosmer and Lemeshow Goodness-of-Fit test.
Hip power absorbed was found to be protective against injury. Table 3 reports the Odds Ratios for injury risk. Figure 3 demonstrates the confidence limits with a forest plot, showing the hip power absorbed was completely under 1.00, indicating that higher hip power absorbed was associated with less injuries in runners. All other variables had confidence limits on either side of the 1.00 threshold, hence insignificant.

Pearson, Deviance, Leverage, and DFBETAS were used to assess residuals for outlying and influential values. Little change was seen in the model with potential outliers included or omitted, so all values were included.
Interactions, like outliers, did not significantly influence the model. Therefore, no effect modifiers or interactions were included. This was tested by including multiple comparisons on the interaction term. After checking the interaction term for significance, differences between the groups of interest were used to determine if the interaction was included.
Multicollinearity was tested by evaluating the correlation coefficients, starting with the highest value within the correlation matrix to lowest. In the end, ankle and knee joint power kinetics had values near 1 or -1. Each had a small effect on R-Square and ROC curve, but the best option was removing ankle power generated.
DISCUSSION
This is the first study that has reported an association between hip power absorbed and running injuries. When simply comparing the mean values of the injured group and the non-injured group of runners included in this study, there was no difference in the joint power. When both considering and controlling for age, sex, BMI, foot strike, and speed with logistic regression analysis; higher hip power absorbed was found to be associated with lesser odds of injury. This could be due to the hip muscles’ unique role in absorbing force during early stance phase and may warrant consideration in the context of running injuries.
Past kinetic studies have primarily been focused on moments and ground reaction forces.6 However, the concept of the hip being involved with and protective against running injuries is not new, with a significant amount of kinematic literature to support these findings. For example, a case-control study that stratified injuries to the patellofemoral joint, iliotibial band, medial tibial, and Achilles tendon found contralateral pelvic drop as the kinematic variable best at predicting injury, regardless of injury type.25 Further highlighting the importance of the hips, increased hip adduction is associated with patellofemoral pain,26,27 iliotibial band syndrome,28,29 and tibial stress fracture.30 Increased hip internal rotation is associated with iliotibial band syndrome.28,29 Additionally, decreased gluteus maximus and gluteus medius muscle activation time is associated with Achilles tendinopathy.31 However, a number of systematic reviews and meta-analysis caution regarding the strength of these findings, noting conflicting evidence found in other studies.6,27,32–34
Clinicians frequently target the hips with strengthening and gait retraining interventions for runners with injuries and biomechanical deficits. However, there needs to be more conclusive literature that running biomechanics can change, as the current literature varies and is sparse.35 In a small three-week cohort study on runners with patellofemoral pain, Ferber et al. did not find a change in functional genu-valgus with targeted hip abductor strengthening; however, subjects did have an improvement in pain and hip abductor strength.36 But, when a hip and core strengthening program was carried out for eight-weeks in women with patellofemoral pain syndrome, there were improved moments at the hip, along with improved pain, hip, and core strength.37 This could suggest that three weeks was not enough time to change hip biomechanics. Additionally, targeted gait training for eight sessions to control hip adduction and contralateral pelvic drop was found to improve those variables, along with pain again in subjects with patellofemoral pain.38 This all supports the conclusion that Willy and Davis had when suggesting that without specifically targeting the movement patterns during running, little improvements in biomechanics would be seen.39 Of clinical importance, successful gait retraining to improve hip biomechanics may be as simple as mirror biofeedback over eight sessions without the need for isolated strengthening interventions.40
Overall, the authors’ expected to find more kinetic variables associated with running injuries. There may have been other causes for the non-associations and possible type-II errors that were not accounted for with the adjusted logistic regression. However, the R-Square value seems reasonable when considering the many variables to injuries, such as sleep, training errors, physiology, anatomy, society pressure, and psychology. Other considerations were that stratification could not be completed by injury or demographic categories because of low subgroup sample sizes, leading to large confidence intervals in the end. There appeared to be a few outliers, but they did not change the model when removed, so they were all included. Interactions did make some changes to the AUC when included, however they were not kept because the significance was not in comparison groups of interest. Subjects did wear their own shoes and ran at a comfortable self-selected pace, which matches what is done functionally; however, it does add possible confounding to the equation. The model controlled for speed, but not for shoe type. While many of the demographic variables were very similar between the injured and non-injured runners, the non-injured group’s mean age was five years older. The age was controlled for in the logistic regression, however this may have introduced bias. Lastly, the population of patients and clients may not be generalizable to runners of different demographics. The subjects included in this study had the resources available to seek out and receive these services.
Joint power kinetics need to be considered in the big picture of running injuries. Recall that running injuries are very multimodal, with only 9% of the total variation in injury status being accounted for in this model. The results of this study by no means suggest that improving runners’ ability to absorb hip power will decrease their injury risk, it simply shows there may be an association. Prospective studies would be needed to confirm that. Future studies could look at strategies to 1) improve hip absorption power in injured runners and 2) assess whether there is a decrease in injury risk in doing so. For clinicians without access to kinetic measurements, it would also be interesting to assess how the hip kinematics were associated with the hip kinetics and injuries.
CONCLUSION
This study confirmed much of the previous understandings of running injuries as being multimodal, with a proportion of the risk associated with biomechanics. This study further identifies hip power absorbed as being associated with injuries, warranting further research such as how to change hip power absorbed in runners and if those changes result in less injuries with a prospective study design.
Conflicts of interest
The authors declare no conflict of interest.