

BACKGROUND
Hamstring strain injury (HSI) occurs in many sports activities.1 For example, HSI reportedly accounted for 12% of all injuries in football,2 with recurrence rates exceeding 50%.3 It is important to prevent the initial occurrence and recurrence of HSI to maintain and improve the performance of athletes.
The risk factors for HSI include eccentric knee flexion strength,4,5 fascicle length of the biceps femoris long head,5 and a history of HSI.6 Isokinetic eccentric knee flexion strength assessment is a popular screening tool for identifying athletes who are at risk of future HSI.4 However, the use of isokinetic equipment is limited by various factors, including time, cost, and poor portability.7 Although eccentric knee flexion strength is a kinetic variable, the Nordic break-point test of the Chinese University of Hong Kong uses a kinematic variable and has recently been reported as a unique method for predicting eccentric knee flexion strength.8 As a feature of the Nordic hamstring exercise (NHE), further forward leaning of the upper trunk is associated with longer moment arm from the knee joint to the center of mass, which increases the knee flexion moment.9 The point at which the hamstring force can no longer tolerate this increased eccentric load and the upper body begins to accelerate toward the ground is known as the break point. A very large correlation has been observed between eccentric knee flexion strength and knee flexion angle at the break point measured by smartphone application (SensorLog) (r = 0.88, p < 0.001).8 Although the break-point angle (BPA) during NHE does not directly measure eccentric knee flexion strength, the regular measurement of the BPA might indicate whether there is increased HSI risk. However, there is a disadvantage in measuring BPA by using smartphone applications, namely, the need to transfer the data to a personal computer for analysis.8 Therefore, providing immediate feedback and measuring a large number of athletes are expectedly difficult.8
A very recent development of a smartphone application (Nordic Angle) allowed automatic calculation of BPA without transferring the collected data to a personal computer. However, the validity of the BPA values obtained by this method has not been examined. Therefore, this study aimed to examine the validity and reliability of the Nordic Angle by comparing the BPA values of the Nordic Angle with those of two-dimensional motion analysis software.
DESCRIPTION
Study Design
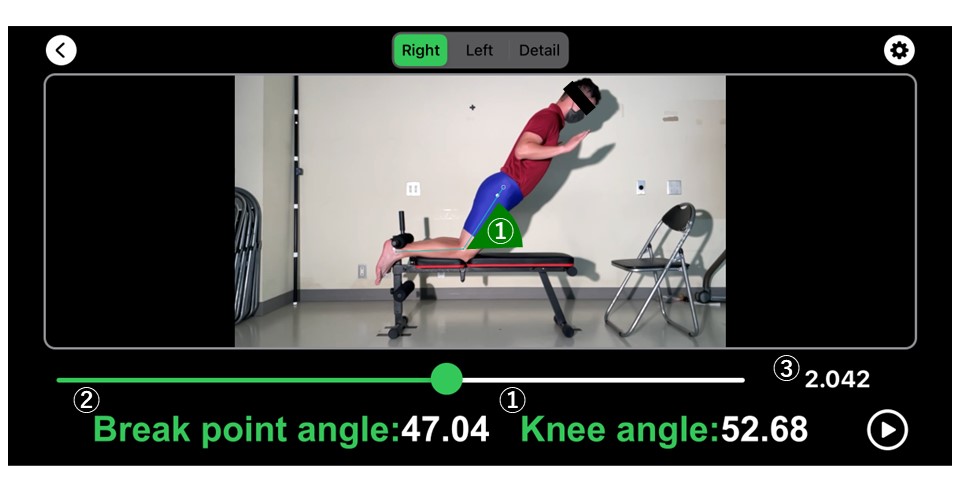
After the warm-up, the participants performed 12 NHE repetitions while being recorded with an iPhone 12 high-speed camera. Based on the same movie data recorded with an iPhone camera, BPA during NHE was calculated using two-dimensional motion analysis software and the Nordic Angle (Figure 1). The validity of the Nordic Angle data was examined using the Spearman’s correlation test for consistency with motion analysis data, and the agreement between these measurements was examined using the Bland-Altman analysis. The reliability of Nordic Angle and motion analysis was examined using the intraclass correlation coefficient (ICC) (1,k) based on data from repeated trials within a day.

Participants
The sample size was calculated a priori based on Pearson correlation coefficient analysis (G*Power version 3.1, Heinrich Heine Universität Düsseldorf, Germany). Its input parameters (correlation ρ H1 = 0.9, alpha = 0.05, power = 0.8) were set with reference to the effect size of a previous study.10 This setting resulted in a sample size of five. Therefore, seven male volunteers (age, 23.9 ± 2.0 years; height, 174.3 ± 5.4 cm; and body mass, 67.3 ± 7.9 kg; all measured in mean ± standard deviation [SD]) participated in this study. The inclusion criterion was healthy males between the ages of 18 and 35 who participates in sports activities and can perform exercises without musculoskeletal pain. The exclusion criterion was participants who could not perform NHE because of a current injury to the lower extremities. The experimental protocol was approved by the institutional review board of Waseda University’s ethical committee (approval number: 2022-345), and all procedures in this study were performed in accordance with the Declaration of Helsinki. All participants were informed of the purpose and procedure of the study, and informed consent was obtained from all participants.
Procedures
Before the experiment, participants initially performed a warm-up consisting of light aerobic activity (2 minutes of alternating stepping on a 15-cm high box), a 15-second static hamstring stretch (standing hamstring stretch on one leg), and one set of 10 repetitions of dynamic hamstring stretching (forward leg swing). Hamstring stretching was performed on both legs. Thereafter, participants were given two repetitions to gain familiarity with the movement being assessed, and then performed 12 repetitions of NHE for data collection. There was at least one minute of rest between each repetition. The experiment was conducted under the supervision of an examiner, who was qualified as a National Strength and Conditioning Association Certified Strength and Conditioning Specialist.
Nordic Hamstring Exercise
Participants were instructed to start in a kneeling position on a bench of application of approximately 50 cm with elbows bent and hands open in front of them (Figure 1). The examiner instructed participants to keep their posture straight from the knee to the head and to lean forward “as slowly as possible”. A certified examiner confirmed that the participant performed the NHE correctly.
Two-Dimensional Motion Analysis
The speed of the camera was set to 240 frames per second (fps), and the height was approximately 0.8 m, while the camera was positioned application approximately 3 m from the right side of the participants. After the recorded movie was transported to a personal computer, two-dimensional motion analysis was performed on the obtained movie data using the Frame-DIAS V software (DKH Inc., Tokyo, Japan). Reflective markers were attached to the greater trochanter and the lateral malleolus. The knee flexion angle was calculated by digitizing the greater trochanter, center of knee joint, and lateral malleolus. The digitization of the center of the knee joint was performed visually by the examiner. The line connecting the greater trochanter with the center of the knee joint and the line connecting the center of the knee joint with the lateral malleolus created an angle that was defined as the knee flexion angle. The knee flexion angle was calculated using the following formula:
θ= a1b1+a2b2√a21+a22√b21+b22,
where is the knee flexion angle, and are the points of the line connecting the greater trochanter with the center of the knee joint, and b₁ and b₂ are the points of the line connecting the center of the knee joint with the lateral malleolus.
The knee extension angular velocity was calculated using the following formula:
deg/s=θt+1−θt−12Δt,
where is the knee flexion angle, and is the time.
BPA was defined as the angle at which the knee extension angular velocity exceeded 30°/s. The kinematic data were smoothed with a Butterworth filter for two-dimensional motion analysis. The order of the Butterworth filter was as follows: (1) the characteristic was low-pass, (2) the cutoff frequency was 6 Hz, and (3) the number of extended data for the correction of both ends was 20.
Statistical Analysis
Values were expressed as mean ± SD. The average BPA values from motion analysis and the Nordic Angle were calculated from the BPA values of the 12 NHE repetitions performed by each participant. The Shapiro–Wilk test was performed for the analysis of the normal distribution of the BPA data of motion analysis and the Nordic Angle. As a result, there was no confirmed normal distribution in the BPA of the Nordic Angle. Because BPA data were not normally distributed, the validity of the Nordic Angle data was examined using the Spearman’s correlation test for consistency with the motion analysis data. Although normality was not confirmed in the BPA data, the agreement between these measurements was examined using the Bland-Altman analysis. The Wilcoxon signed-rank test was performed to confirm the difference in BPA between the Nordic Angle and motion analysis data. The limits of agreement in the Bland-Altman analysis were calculated by multiplying SD by ±1.96.10 The reliability of the Nordic Angle and motion analysis was examined using ICC (1,k). Correlation is indicated as rs for Spearman’s correlation test, and its magnitude of the correlation was established based on the following criteria: rs = 1, perfect correlation; 1 ≥ rs ≥ 0.9, nearly perfect; 0.9 ≥ rs ≥ 0.7, very large; 0.7 ≥ rs ≥ 0.5, large; 0.5 ≥ rs ≥ 0.3, moderate; 0.3 ≥ rs ≥ 0.1, small; and 0.1 ≤ rs, trivial). Statistical analyses were performed using SPSS version 27 (IBM SPSS, Armonk, NY, USA). The significance level was set at p < 0.05.
OUTCOMES
The Validity of the Nordic Angle
Figure 2 showed the correlation between the BPA of Nordic Angle and that of motion analysis. Although the spearman correlation between the Nordic angle and the angle determined using Motion analysis did not reach statistical significance (p = 0.052), it represents a very large correlation (rs = 0.75).

Figure 3 shows the agreement between the BPA of Nordic Angle and that of motion analysis. The BPAs of Nordic Angle and motion analysis were 60.2 ± 10.4° and 59.9 ± 9.9°, respectively, and there was no significant difference between the Nordic Angle and motion analysis data (p = 0.50). The difference between the mean values of the Nordic Angle and motion analysis was 0.4 ± 2.1°, and the limits of agreement ranged from -3.9° to 4.6°.

The Reliability of Nordic Angle and Motion Analysis
In two BPA measurements, the Nordic Angle showed perfect reliability (ICC = 1.00, p < 0.001), while motion analysis showed nearly perfect reliability (ICC = 0.97, p < 0.001).
DISCUSSION
This study aimed to examine the validity and reliability of the Nordic Angle by comparing the BPA values of the Nordic Angle with those of two-dimensional motion analysis software. The main outcomes of this study are as follows: (a) Although the spearman correlation between the Nordic angle and the angle determined using Motion analysis did not reach statistical significance (p = 0.052), it represents a very large correlation (rs = 0.75); (b) the mean difference between BPA data from the Nordic Angle and motion analysis was 0.4 ± 2.1°, with no significant difference; (c) the limits of agreement ranged from -3.9° to 4.6°; and (d) the Nordic Angle showed perfect reliability (ICC = 1.00, p < 0.001).
The results of this study indicated a non-significant, yet very large correlation between Nordic Angle and motion analysis (Figure 1). In addition, no significant difference was observed between the BPA value of the Nordic Angle and that of the motion analysis (Figure 2), suggesting that BPA calculation by the Nordic Angle was valid. As previously reported, HSI risk might be predicted by eccentric knee flexion strength during isokinetic dynamometry.11 A very large correlation was observed between eccentric knee flexion strength during isokinetic dynamometry and BPA during NHE. If there is also a strong association between BPA measured by the Nordic Angle and eccentric knee flexion strength, regular BPA measurements using the Nordic Angle may provide insights into the potential increase or decrease in HSI risk.
This study also assessed the limits of agreement between measures (Figure 3). Delahunt et al. investigated the changes in eccentric knee flexion strength during isokinetic dynamometry and BPA during NHE after a 6-week NHE training in recreationally active men.12 Their results showed that eccentric knee flexion strength increased by 15%, and BPA changed by only -5.6°. In the current study, the limits of agreement of BPA ranged from -3.9° to 4.6°, which may either overestimate or underestimate eccentric knee flexion strength. Therefore, measuring BPA by the Nordic Angle with three to five trials and using average of these trials for BPA calculation might be recommended.
In this study, the Nordic Angle demonstrated perfect reliability (ICC = 1.00, p < 0.001). On the other hand, while the motion analysis also showed nearly perfect reliability (ICC = 0.97, p < 0.001), there was a slight difference between the first and second analysis. Thus, the Nordic Angle, which demonstrates acceptable validity and reliability, may be appropriate for field measurement because it allows immediate feedback of BPA and measurement in many athletes.
It is important to note that this study did not examine the relationship between BPA using the Nordic Angle and eccentric knee flexion strength during isokinetic dynamometry. Therefore, it remains unclear whether BPA calculated using the Nordic Angle reflects eccentric knee flexion strength. Since eccentric knee flexion strength during isokinetic dynamometry at 60°/s is an HSI risk factor, the relationship between BPA calculated by the Nordic Angle and eccentric knee flexion strength at 60°/s should be examined.
Limitations
This study has several limitations. The first is the small sample size. This created two clusters and risked overestimating the validity of BPA by the Nordic Angle. In addition, the sample size was set based on the effect size of a previous study when determining the sample size, but the effect size in this study was not as large as that of that previous study. Future studies are needed to test the validity of the BPA for the Nordic Angle when the sample size is increased. The second was the use of Bland-Altman analysis on non-normally distributed data. The limits of agreement in the Bland-Altman analysis might not be exact values. It is expected that the limits of agreement in the Bland-Altman analysis might be tested in the future when the sample size is increased. The third is that the measurement method was only applied to two-dimensional motion analysis. In the future, the validity of three-dimensional motion analysis needs to be examined. The final limitation is that data from repeated trials within a day make it impossible to draw conclusions about inter-session testing.
Conclusion
In conclusion, this study examined the validity and reliability of the Nordic Angle by comparing the BPA values of the Nordic Angle with those of two-dimensional motion analysis software. The results indicate a very large (non-significant) correlation between the Nordic Angle measurement and the angle determined using Motion analysis, however, the mean difference between the Nordic Angle measurement and motion analysis data was not statistically significantly different ( 0.4 ± 2.1°). The limits of agreement ranged from -3.9° to 4.6° and the Nordic Angle showed perfect reliability (ICC = 1.00, p < 0.001). The Nordic Angle might be appropriate for field measurement because it provides immediate feedback regarding the BPA in many athletes. However, the small sample size suggests that the validity of the BPA may be overestimated.
DISCLOSURES
Nordic Angle is a smartphone application developed in collaboration with S-CADE. Co., Ltd. and Athletic Training Laboratory at Waseda University (instructed by Professor Norikazu Hirose). The first author of the article collected and analyzed the data. However, the authors of the current study assert no conflicts as they do not receive any fees from S-CADE. Co., Ltd. for developing the Nordic Angle, and the installation of the Nordic Angle app is free.
ACKNOWLEDGEMENTS
The authors acknowledge the facilities and assistance of the Graduate School of Sport Sciences, Waseda University. The experiments complied with the current laws of the country in which they were conducted. The datasets generated and/or analyzed during the current study are not publicly available, but are available from the corresponding author, who was an organizer of the study. We would like to thank Professor Susumu S. Sawada for his advice on data analysis and statistical analysis. This work was supported by the JST SPRING (grant number JPMJSP2128).