INTRODUCTION
Muscle strength is one of the most important factors when assessing an individual’s recovery from injury.1 For the intrinsic foot muscles (IFM), there is no cost-effective or reliable way to measure their strength in a clinical setting.2 The IFM dynamically support the medial longitudinal arch,3 aid in performing functional movements,4 and contribute to balance.5,6 Given this, assessment of IFM is particularly important in patients who may suffer from IFM weakness, including older adults at risk for falls,7,8 people with diabetic neuropathy,9 and individuals with plantar fasciopathy,10–12 among other pathological conditions of the lower extremities. For patients with IFM weakness, it is important to have a reliable IFM strength measurement in order to document impairments and track strength progression over the course of a rehabilitation program.
Researchers have approached IFM strength assessment in multiple ways, but these assessment methods are neither cost-friendly nor easily accessible by most clinicians.2 For example, MRI,13–15 ultrasound,16–18 and EMG19 have previously been used to assess IFM volume, cross-sectional area, and muscle activity respectively. These measures are considered a proxy for strength as no actual force output is obtained.2 Furthermore, those methods are time-consuming and expensive for general clinical use. To approach this problem further, researchers have used custom-built toe dynamometers,19–24 pressure mats,25,26 and a variety of handheld dynamometers (HHD).27,28 While these measures do provide a force output, they do not discriminate between intrinsic and extrinsic muscle groups and increase the overall cost of assessment.
The Toe/Hip Strength Dynamometer (Human Locomotion, Newton, MA) is a novel IFM dynamometer that has been recently developed for clinicians. Using this tool, the test is conducted similarly to the paper-grip test, which was initially created as a dichotomous screening tool for patients with leprosy to assess if they were able to grip a business card with their toes or not, due to the neuropathy that is common with the disease.29,30 This dynamometer is similarly made of a plastic card attached to a hanging scale. For the test, individuals press their toes onto the card as hard as possible without toe curl to resist the assessor pulling the card out, and a peak force output is provided once the card slides out. Although it is still difficult to conclusively isolate the IFM, this device has a lower cost ($75) and size compared to other methods and may be useful in clinical settings. Furthermore, the tool is designed for the measurement to occur in a closed-chain position, which is the functional position of the foot.
There are also some individual factors that may affect IFM strength, such as foot morphology and recent activity level. Foot width in sitting and standing positions has been shown to significantly positively correlate with IFM strength when measured using other tools.31 Additionally, a longer foot has a longer lever arm that renders musculature able to generate a higher force.31 Recent activity level could also play a role in force output, given that muscular fatigue is known to decrease contraction intensity.32
The purpose of this study was to investigate the intra-rater and inter-rater reliability of a novel, budget-friendly IFM dynamometer and determine its agreement with a handheld dynamometer (HHD). The researchers also examined correlations of foot morphology and activity level to IFM strength. It was hypothesized that the novel IFM dynamometer would have good reliability (ICC = 0.75-0.9), have good agreement with the HHD, and that foot width and length, and activity level would significantly influence an individual’s force output.
METHODS
In this laboratory-based study, two novice assessors measured participants’ IFM strength on two occasions 6.62±0.78 days apart to assess intra-rater and inter-rater reliability of the novel dynamometer. Other demographics and IFM strength using the HHD were also assessed at the first visit.
Participants
Healthy individuals between the ages of 18-30 were recruited. Individuals were excluded if they had any previous history of foot or ankle surgery, and any foot or ankle neuromusculoskeletal injuries or fractures within the prior three months. G-Power’s two-tailed paired t-test for two dependent means determined that a minimum sample size of 34 participants were needed for adequate power of 80% and α = 0.05. All participants read, signed, and approved of the informed consent form, and the study was approved by the Institutional Review Board.
Instrumentation
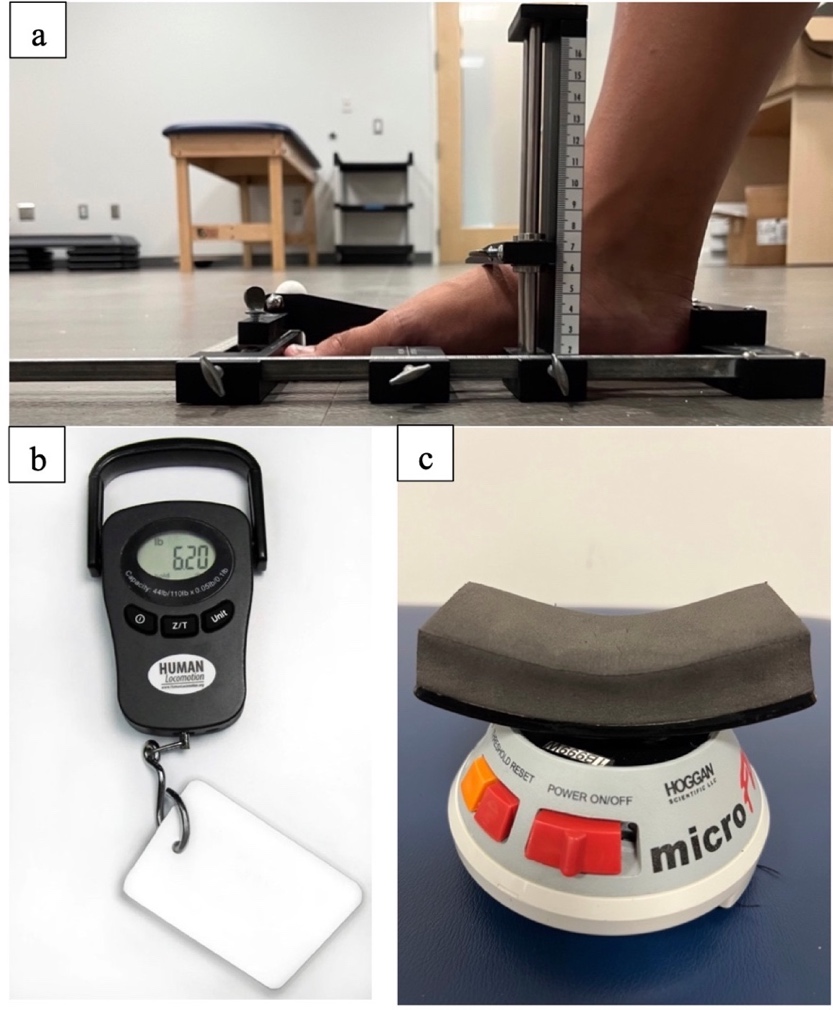
Arch Height Index Measurement tool (AHI): The AHI (Figure 1a) measures foot morphologic characteristics (length, width, height), and has excellent inter-rater and test-retest reliability (ICC = 0.98 – 1.00).27 The AHI can provide measurements to calculate foot volume (foot length, foot width, and dorsal arch height at 50% of the total foot length).33
_measuring_tool._b._novel_ifm_strength_dynamometer_and_c._handhe.jpeg)
Novel IFM dynamometer: The novel IFM dynamometer consists of a plastic card attached to a hanging scale (American Weigh Scales, Georgia, USA), pictured in Figure 1b and Supplementary Video 1. There is no previous reliability or validity data on this device.
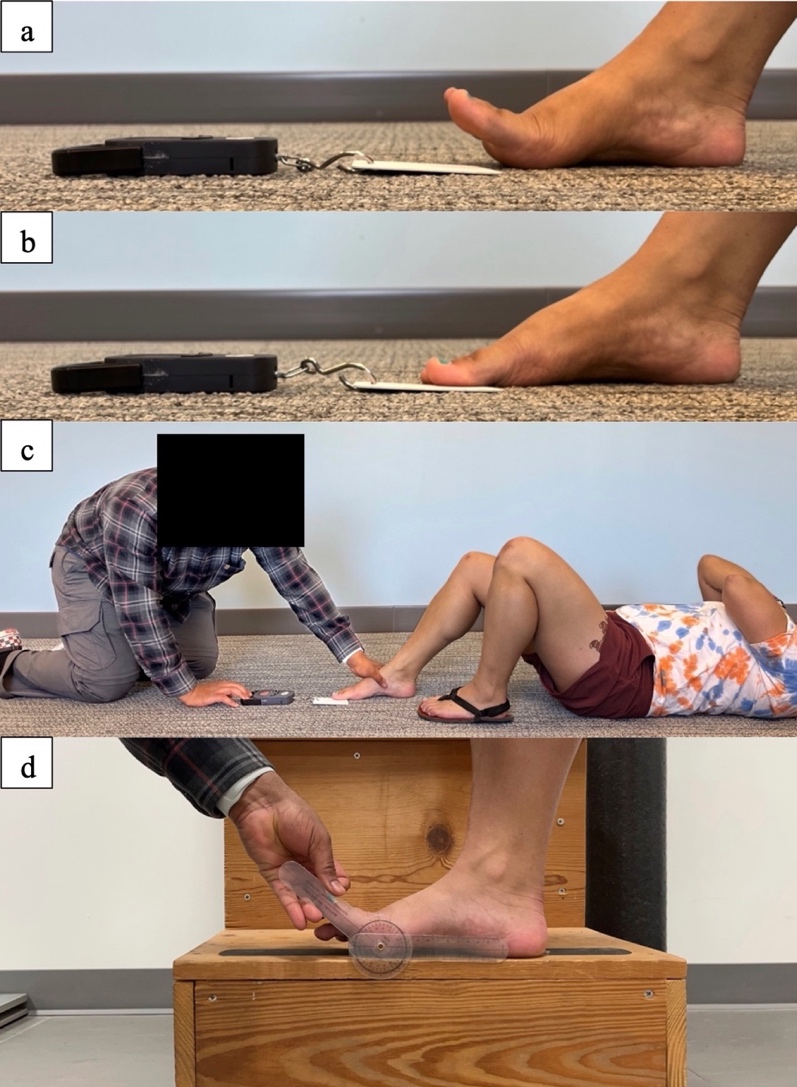
Before using the device, individuals were taught how to perform the motion. In this study, participants performed three isometric toe flexion repetitions while seated in a chair with the feet on the ground for ease of learning. They were shown a video of isometric toe flexion, where the toes were first extended to raise the medial longitudinal arch (MLA) as seen in Figure 2a, placed back onto the floor without losing arch tension, then pushed down onto the floor for three seconds when instructed on a “3, 2, 1, push” countdown (Figure 2b, Supplementary Video 3). Instructions were provided to “keep the heel and ball of the foot on the ground”, “imagine bringing the ball of the foot and heel together”, and to avoid curling their toes. This “short foot” exercise mimics the setup of the IFM test which assesses the ability of the IFM to support the MLA,34 which was asserted to be more important than the ability of IFM to produce toe flexion.

Then, participants were shown a video of the assessment being conducted, with the great toe and lesser toes on each foot tested separately. The assessor instructed the participant to extend their toes and slid the plastic card under the toe(s), ensuring that the card did not touch the underside of the metatarsal head(s), as seen in Supplementary Videos 2 and 4. Participants placed the toes back down on the card, and the assessor placed their hand on top of the participant’s foot to keep it stable. The assessor counted “3, 2, 1, push”, with participants instructed to push “as hard as they could” on that command. Then, assessors counted to three silently while they pulled the handle of the device, increasing the force of the pull slowly so that the card slid out on “3”, keeping the device on the ground with the line of pull in the sagittal plane. Participants were instructed to “press the toes on the card as firmly as possible to keep it in place”, and to press with all toes on the foot regardless of the toe condition being tested. This process is explained in Supplementary Video 3.
All assessments were conducted on the same low-pile carpet, as friction of different materials could affect the force output. Participants lay supine with knees bent at 90 degrees of flexion, with the feet flat on the floor and their arms crossed on their chest, as pictured in Figure 2c and Supplementary Video 2. This position reduced the influence of bodyweight on plantar pressure, as increased postural demand has been shown to increase IFM recruitment,35,36 and the amount of ankle plantarflexion theoretically allowed for extrinsic muscles to be involved to a smaller degree.37 Further, it was easier to maintain a standard testing position between patients compared to a seated or standing position.
Handheld dynamometer (HHD): Fraser et al. (2017) demonstrated good-to-excellent reliability (ICC = 0.66 – 0.92)27 of a HHD in measuring strength of the great toe and lesser toes (Figure 1c). The present study used the same microFET2 HHD (Hoggan Health Industries, West Jordan, UT). For this test, participants lay supine on an examination table with knees bent at 90 degrees of flexion, with their toes hanging off the edge so that the HHD transducer pad could be placed under the toes to assess their pushing force. The assessor counted “3, 2, 1, push”, with participants instructed to push “as hard as they could” on that command.
International Physical Activity Questionnaire-Short (IPAQ-Short): The IPAQ was developed in 1998 as an objective self-reported measure of physical activity across a variety of countries, demonstrating acceptable test-retest reliability, acceptable agreement between the long and short versions, and fair to moderate agreement between the IPAQ and an accelerometer.38 It is sensitive to the specific research population (country, age, region)38 and the intention behind the survey, as the long-form may be more appropriate for domain-specific activity (job-related, transportation, housework, and recreational).39

Testing procedure
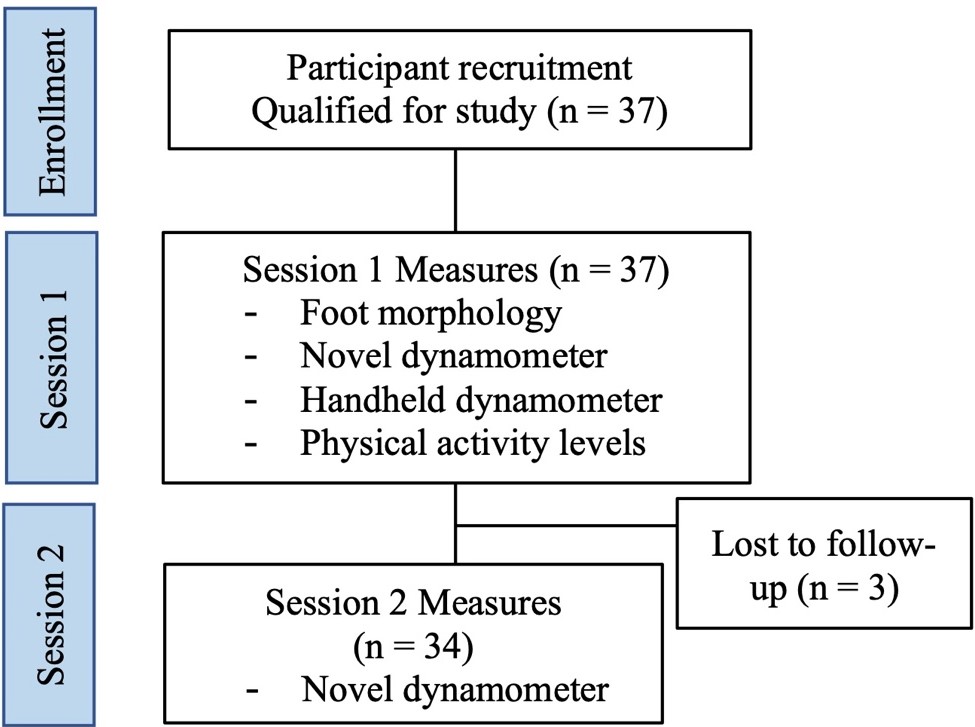
Procedures were as follows (Figure 3).
Foot morphology: The dominant leg of participants was obtained by asking participants which leg they would use to kick a soccer ball. Foot length and width of the dominant leg was measured using the AHI while barefoot; and arch height and foot girth (using a soft measuring tape) were obtained at the midfoot.33 Great toe range of motion was obtained passively (Figure 2d).
Novel dynamometer testing: After learning the isometric toe flexion motion required for the test, participants underwent two familiarization trials per toe condition in the supine hook-lying position. Both the familiarization and assessment trials had four toe conditions, randomized via a Latin square formation: 1, dominant foot great toe (DGT); 2, dominant foot lesser toes (DLT); 3, non-dominant great toe (NGT); 4, non-dominant lesser toes (NLT).
After familiarization, five minutes of rest were provided, where the participant remained seated. Then, each assessor conducted three trials of each toe condition, in the same order as the familiarization trials. There were 30 seconds of rest in-between each toe-pushing repetition within each foot, though there was no rest when transitioning between feet (Supplementary Video 4). Five minutes of rest were provided between each assessor, with each assessor blinded to the others’ results for all sessions. The order of the two assessors was also alternated for each participant to rule out practice or fatigue effects, though assessor 1 instructed all participants in the test and conducted all the familiarization trials.
Handheld dynamometer measurement: After the IFM strength assessment with the novel dynamometer, participants rested five minutes, then underwent the strength assessment with the HHD (Figure 1c) for only the great toe and the lesser toes on the dominant foot.
Activity level: In the five minutes of rest between each assessor, participants filled out the International Physical Activity Questionnaire-Short (IPAQ-Short) to indicate their recent activity levels over the prior seven days. At the end of the first session, a second assessment was scheduled five to seven days later. The same procedure took place, excluding initial demographics, foot morphology, and seated practice repetitions.
Data analysis: For the novel IFM dynamometer, means and standard deviations (SD) per assessor and session were calculated, along with standard error of measurement (SEM) to indicate measurement variation. Intra-class correlation coefficients (ICC) were calculated using SPSS (Version 28, Chicago, IL); ICC(3,1) indicates intra-rater reliability for each assessor and ICC(2,1) indicates inter-rater reliability between assessors, according to previous reporting guidelines by Koo and Li (2016).40 ICC values were interpreted as poor (< 0.5), moderate (0.5-0.75), good (0.75-0.9), and excellent (> 0.9).
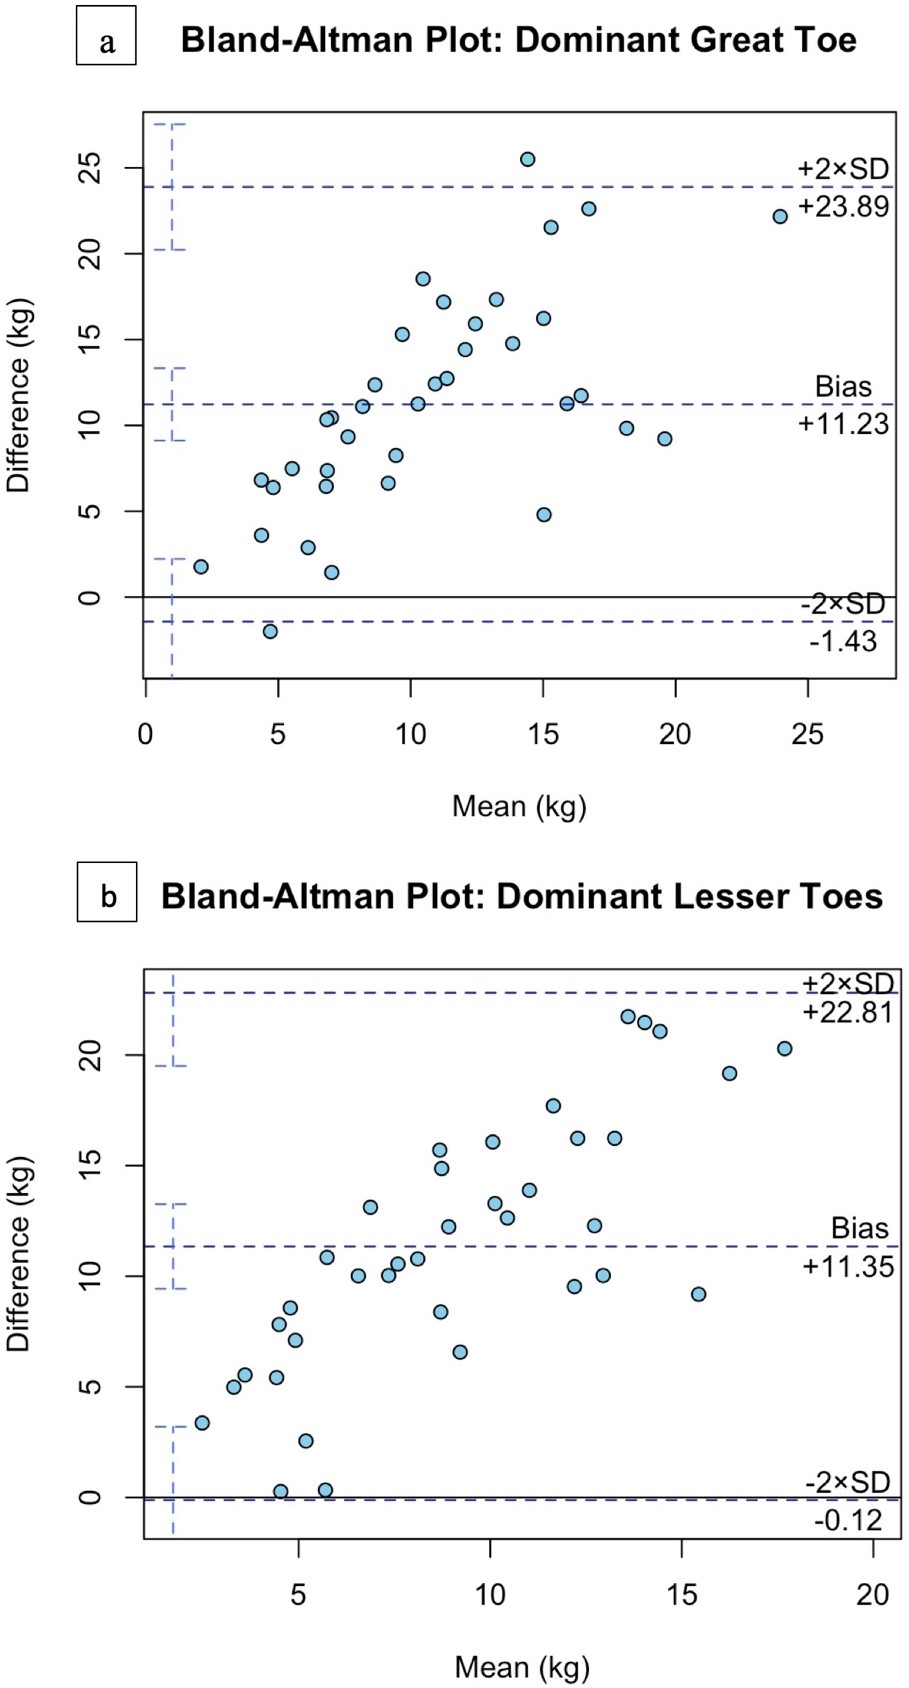
For the HHD, means and SD for each toe condition were calculated. To determine agreement between the novel IFM dynamometer and the HHD, a Bland-Altman plot was created with 95% limits of agreement (R Statistical Software, v4.1.2; R Core Team 2021).
Pearson correlation coefficients were used to determine the correlation between IFM strength values, foot morphological characteristics, BMI, and activity level in the prior seven days (R Statistical Software, v4.1.2; R Core Team 2021). Measurements of great and lesser toes were added together on each foot to perform the correlations. The significance level was set a priori at α = 0.05. Correlation coefficient r: |r| > 0.8 indicates high correlation; 0.5 > |r| < 0.8 denotes moderate correlation; 0.3 > |r| < 0.5 suggests low correlation; and |r| < 0.3 implies weak correlation.31
RESULTS
Initially, 37 healthy individuals volunteered to participate in this study; three participants were lost to follow-up for the second session (Figure 3).
Participant demographics and foot morphology data are presented in Table 1. For the novel IFM dynamometer, intra-rater and inter-rater reliability was moderate-to-excellent across all conditions (Table 2). For agreement with the HHD, the lesser toes of the dominant foot had all data points within the 95% limits of agreement (Figure 4a). For the great toe of the dominant foot, only two data points were outside of the 95% limits of agreement (Figure 4b). Certain variables had small but significant correlations with IFM strength (Table 3), including age, foot width and girth, and number of days walking over the previous seven days.

DISCUSSION
The novel IFM dynamometer demonstrated moderate-to-excellent intra-rater reliability and good-to-excellent inter-rater reliability among all measures between and within investigators. The values obtained from the novel IFM dynamometer data was in agreement with the values obtained from the HHD. Certain variables including a wider foot and higher reported days spent walking in the past week had small but significant correlations to IFM strength values using the novel tool.
A variety of IFM strength measurement methods have been explored, though with certain limitations. Previous methods include MRI, ultrasound, and EMG to obtain muscle volume,13–15 cross-sectional area (CSA),16–18,41 and muscle activity,19 respectively. These characteristics have demonstrated relationships to muscle strength42 and can provide insight about IFM function. However, without a quantitative force output,2 these measures should be considered an indirect strength assessment. Further, these methods have a high cost and are difficult to access for some clinicians. MRI is considered the gold standard and is capable of isolating individual IFM,14 but can be expensive and time-consuming, and does not actually measure functional strength. IFM assessment via ultrasound requires specific clinician experience in diagnostic ultrasound, and should be conducted in a weight-bearing position as their function is to support the arch while weight-bearing,43 but it can be difficult without specially constructed lab equipment.43,44 Ultrasound findings could also be dependent on recent activity and time of day, as IFM may be more engorged at the end of the day because of increased blood flow with more muscle use.45 Lastly, though surface and intramuscular EMG can detect muscle activity,2,34 they do not provide an actual force output.
IFM strength can also be measured directly via custom-built toe dynamometers,20,21 HHDs,27,28 pressure platforms,20,25,26 and force plates.35 The HHD has good-to-excellent reliability (ICC 0.66 – 0.92 and 0.82 – 0.88 in two separate studies27,28), and does not allow for flexion of the interphalangeal joints of all toes compared to some other methods, which is viewed as ideal when assessing IFM. Though these quantitative methods provide a force output, there is no conclusive isolation of individual IFM, which may be necessary as individual IFM have different functions. Further, some of these methods are still not cost-friendly or accessible to most clinicians. Building custom dynamometers can require expertise in biomechanics and materials that clinicians do not generally possess. Pressure mats and force plates can be costly, and it can be difficult to isolate the toe pushing force from the rest of the foot.
Various methods exist to assess IFM strength in laboratory settings, but assessing IFM quantitatively in a clinical setting has proven difficult due to lack of clinic space, cost of, and access to appropriate instruments. However, being able to accurately and efficiently assess IFM strength in standard physician offices, physical therapy clinics, or athletic training facilities is necessary to inform clinical decision-making when treating foot and lower leg pathologies. The novel dynamometer in this study will be applicable in clinical settings, given its low cost and small size.
Though the IFM function mostly in a weight-bearing position and performing the assessments in a standing position could be considered more functional,25 the supine hook-lying position used in this study can ascertain if individuals could produce the toe-pushing testing movement without influence from other larger muscles. The ability to contract IFM in an isolated manner should indicate how much the IFM can contribute to supporting the MLA in functional movements. Conclusively isolating the IFM is still difficult, but the testing position chosen was intended to minimize extrinsic foot muscle involvement as much as possible, and matches the position used previously by Fraser et al.27 for testing with a HHD. Because the novel dynamometer had participants pressing their toes on the ground, a flat, standardized foot position was guaranteed to a greater degree than Fraser et al.‘s procedure, where participants’ toes hung off the edge of a treatment table to be placed on the transducer of the HHD.27 The positioning for the HHD strength test could result in a variety of ankle and metatarsophalangeal joint angles, which could alter force production capability.37 In a previous study where individuals had their toe flexion strength assessed using a grip bar that required toe curl, indicating extrinsic toe muscle involvement, placing the ankle in 120 degrees of plantarflexion had the lowest strength, while a neutral position at 90 degrees had the highest.19 This could indicate that the extrinsic toe flexor muscles are affected by the ankle joint angle, which is why a plantarflexed ankle position was chosen for this study.
While standing, an individual’s bodyweight or forward lean during the test could increase loading onto the toes and increase their force output, given that increased postural demand leads to increased IFM activation.35,36 Further, forward leaning ability correlates highly with ankle dorsiflexor and plantarflexor strength,46 which means that those who can lean forward more during this type of test could falsely inflate their output. In a sitting position, which has previously been used for IFM strength tests, joint angles can vary based on anthropometric measurements, and individuals are still able to lean forward to affect force production. Therefore, the force reading supplied by the device might be considered more of a “force output” than absolute “strength”, given that fatigue, body positioning, and effort provided may affect the output.
In terms of agreement between the two dynamometers, the majority of comparisons were within the 95% limits of agreement, or two standard deviations of the mean, which is ideal. It also appears that as the individual’s average strength value increases, the difference between the two methods tends to get larger. Thus, although the methods would not be interchangeable, they do appear to agree.
There were some individual factors that could have affected IFM strength, such as foot morphology. Foot width in both sitting and standing positions has been shown to significantly positively correlate with IFM strength.31 Additionally, a longer foot has a longer lever arm that could theoretically generate a higher force.31 Further, habitual use of minimalist shoes is associated with increased foot width47 and increased IFM strength48 compared to those in conventional footwear, which could indicate an association between foot width and IFM strength. In this study, foot width had a small but significant correlation with IFM strength of both dominant and non-dominant feet, which is in agreement with previous findings.
Activity level could play a role in IFM force output capability on a given day, as muscular fatigue is associated with a decrease in contraction intensity.32 IFM fatigue specifically has been shown to increase navicular drop,49 which could indicate a loss of stability, due to decreased strength from the fatigue. In this case, the number of days of walking was correlated with IFM strength, which could indicate that walking more fatigues the IFM more. This may be an indication for clinicians to keep testing time consistent for individuals, when possible, given they may be more fatigued in the evening after a day of activity, compared to the morning. It may also be prudent to ask patients about any changes in their activity levels when performing the testing. However, given that 29 out of 37 individuals in this study had moderate levels of activity, this consideration may not be as applicable for individuals with different activity levels.
There was an increase in IFM strength over time between these two sessions, even though no strengthening was conducted, likely due to a learning effect. To combat this, a familiarization session was used for both sessions prior to the testing. Some individuals had no prior experience with the testing movement in the first session, but all participants indicated that they had previous experience at the second session. It is possible that having previous experience with the toe pushing movement could make it easier to perform the test, thus leading to higher force output. This may be an inherent problem to strength testing, especially of the IFM. There is a high perceived mental and physical workload associated with initially learning IFM exercises that decreases after two weeks,50 which should be considered for patients learning IFM exercises for the first time versus those who have previous experience. Clinicians should be wary that testing during the initial phase of learning the test may be slightly disrupted by this learning effect.
Limitations: Though multiple decisions were made in determining the testing procedure to limit a learning effect and isolate the IFM as much as possible, it still must be acknowledged that a learning effect likely exists and some of the extrinsic foot muscles could have played a role in IFM strength during the test. Further, this device has not yet been validated in injured individuals who could stand to benefit the most from a device to track IFM strength in injury recovery.
CONCLUSION
The results of the current study indicate that a novel, budget-friendly ($75), IFM dynamometer demonstrates acceptable intra- and inter-rater reliability when examining a healthy population. The device also demonstrates validity when referenced to a previously used IFM strength testing method with a separate handheld dynamometer. Further, the weak-to-small correlations between IFM strength, foot morphology, and activity level suggest that other factors may explain some of the variance in IFM strength, e.g., IFM activation, motor control, or activity level over a greater period of time. Future research should assess the validity of this device compared to other previously used IFM assessments to determine its feasibility in tracking strength changes in rehabilitation processes in pathological populations, or potentially identifying individuals at risk for injuries. Injured individuals could have different results as pain may inhibit force generation.
Disclosures
The investigators received the novel IFM dynamometer from the company Human Locomotion (Newton, MA, USA) that is commercially available for $75.