Introduction
Compliance and adherence to injury prevention programs (IPP) during the coaching implementation phase has been a significant obstacle, from a public health perspective.1,2 Universally, implementation rates for scientifically vetted IPPs have been historically low, and even if a successful implementation occurs, the compliance to such programs tends to decrease over time.3–5 Low compliance to an IPP has been linked to increased injury rates over the course of a competitive season.6–8 Establishing a dose-response relationship between neuromuscular training programs and injury incidence rates would, ostensibly, serve as a positive incentive for coaches and athletes to regularly utilize these prevention programs during training.2 Compliance to training programs has been historically low and inconsistent.1,9,10 Despite efforts to increase coaching awareness and exposure to existing neuromuscular training program efficacy, high levels of program implementation are not achieved, despite effectively impacting coaching attitudes and intent to implement.11 Demonstrating improvements in overall team performance (i.e. improved win-loss records) may help convince the coaching and athletic community to include IPPs into their training regimens.
Injury to an athlete has obvious negative consequences to both the individual athlete, and their team, respectively.12 Coaches are often pressured to make strategic decisions when their preferred starting athlete(s) is unavailable for selection due to injury. Efforts to educate coaches to injury risk and restrictions for athletes returning to play after sustaining an injury have been shown to be successful.13 The percentages of coaches that adopt these procedural methodologies consistently are limited, even at the professional levels of competition.1,14 Coaches’ perceptions of IPPs often are subject to negative associations; such as excessive time consumption, lack of sport specificity, and lack of player commitment.10,15 Despite overwhelming research that suggests that the benefits of utilizing IPP methodology may far outweigh any cost, real or perceived, that might be associated with the internal and external factors that disrupt compliance.16,17
The purpose of this study was to determine if level of compliance while implementing the 11+ would impact team performance outcomes (wins, losses and ties). Furthermore, this study sought to determine if high adherence and compliance to the 11+ IPP would improve overall team performance for male collegiate Division I and II soccer players. The authors hypothesized that higher team compliance to the IPP would be consistent with improved overall team performance (more wins and fewer losses).
Methods
The parent study was a prospective cluster randomized controlled trial, which was conducted in Men’s Division I and II soccer teams competing in the National Collegiate Athletic Association (NCAA).18 Every Division I and II Men’s soccer program was contacted via email, mail, and telephone for participation in the study. Human ethics internal review board approval and informed consent was obtained through Quorum Internal Review Board (IRB # 26182/1) (Seattle, Washington, USA).
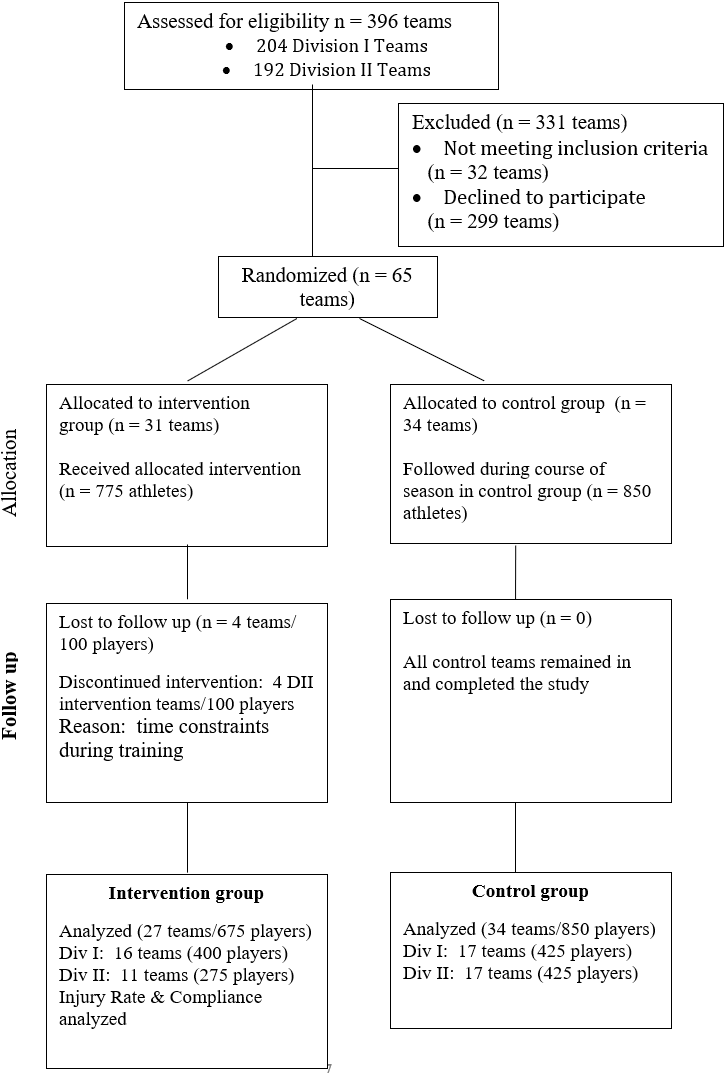
Individual player consent was obtained, and a documentation of coaching understanding was signed by each institution to ensure that there was a thorough understanding of the expectations of study participation. Sixty-five institutions were randomly assigned using a computerized random number generator and completed the intervention study during one full competitive collegiate soccer season (August – December): 34 control institutions (N=850 athletes) and 31 intervention institutions (N=775 athletes) with athletes between the ages of 18-25 participated. Four Division II intervention teams discontinued the intervention (N=100 athletes) due to “time and personnel constraints”, while all Division I intervention teams completed the study. For the current study, only the intervention teams that completed the study were used for analysis (27 teams, N = 675 athletes). The competitive season lasted from August through early December. (Figure 1) All sixty-one teams were monitored for team performance (i.e., wins, losses, ties). The 27 intervention teams were also monitored daily for 11+ program compliance by the certified Athletic Trainer (ATC) at each respective institution.

Intervention
The 11+ is an injury prevention program designed as a dynamic warm-up program to address lower extremity injury incurred in the sport of soccer for athletes over the age of 14. It is a twenty-minute field-based program that consists of 15 exercises divided into three separate components: running exercises (8 minutes) that encompass cutting, change of direction, decelerating and proper landing techniques, strength, plyometric and balance exercises (10 minutes) that focus on core strength, eccentric control and proprioception, and running exercises (2 minutes) to conclude the warm-up and prepare the athlete for athletic participation. There are three progressions (level 1, level 2, level 3) that increase the difficulty for each respective exercise. This allows for both individual and team progression throughout the course of the competitive season. In this specific study, the 11+ program served as the intervention program over the course of one competitive collegiate soccer season.18 The warm-up was implemented under the guidance of the ATC at each institution.
Data Collection
Compliance Data
An internet-based injury surveillance data collection system was used (HealtheAthleteTM, Overland Park, Kansas, USA) by every enrolled institution in the study. Utilization of the 11+ program and compliance data were entered weekly by the team’s ATC and verified by the research staff. Upon completion of the competitive soccer season, compliance data entry was confirmed by each ATC and verified with their individual institutions’ data collection system for accuracy and thoroughness. Compliance levels were defined prior to the commencement of the study (low <1 dose per week, moderate 1 to < 2 dose per week and high = 2 or more doses per week). At the completion of the season, compliance was analyzed by implementation consistency. At the culmination of the NCAA season, the performance record for each individual intervention and control team was ascertained by the head researcher (HSG), using an online query.
Statistical Analysis
This manuscript is based on an exploratory post hoc analysis of the data collected from the 11+ Intervention group that was engaged in a larger randomized controlled trial.18 All statistical analyses were conducted utilizing IBM SPSS for Windows version 24 (Armonk, NY). Descriptive data for compliance, exposures and performance are presented as means (M) with standard errors (SE) and 95% confidence intervals (CI). P values of 0.05 or less were considered significant. The outcome variables examined were utilization of the intervention (yes or no), levels of compliance (high, moderate, low), and team performance record (wins, losses and ties). Compliance was defined prospectively as follows: low (LC) ranged between 1-19 doses/season (<1 dose per week), moderate compliance (MC) ranged between 20-39 doses/season (1 to < 2 doses per week), and high (HC) was defined as utilization >40 doses per season (2 or more doses per week). Descriptive and inferential tests were used to compare the Control and Intervention groups, the tertiles of compliance (high, medium, low), to team performance. Three independent t-tests were used to analyze outcome (wins, losses and ties) to group (IG vs. CG). A one way-MANOVA test was used to analyze tertiles of compliance to win/loss/tie record. This was followed up by one-way ANOVA tests to analyze how compliance impacted wins, losses and ties, independently. Partial η2 measures were calculated to determine the effect size of level of compliance on the outcome measures. A Tukey post-hoc analysis was used to analyze specific differences between levels of compliance and specific outcome measures.
Results
Wins, losses and ties were compared between Intervention and the Control groups. For the Intervention group, there were significantly more wins (Intervention: 10.7±3 versus Control: 8.2±4, CI, 8.0 – 9.7, p = 0.005) and fewer losses (Intervention: 5.6± 2 versus Control: 8.1±3.6, CI, 5.7 to 7.4, p = 0.002) over the course of the competitive season. There was no significant difference in ties (Intervention: 2.4 ±1.6 versus Control: 2.3 ±1.6, CI, 1.5 to 2.3, p=0.856). (Table 1)
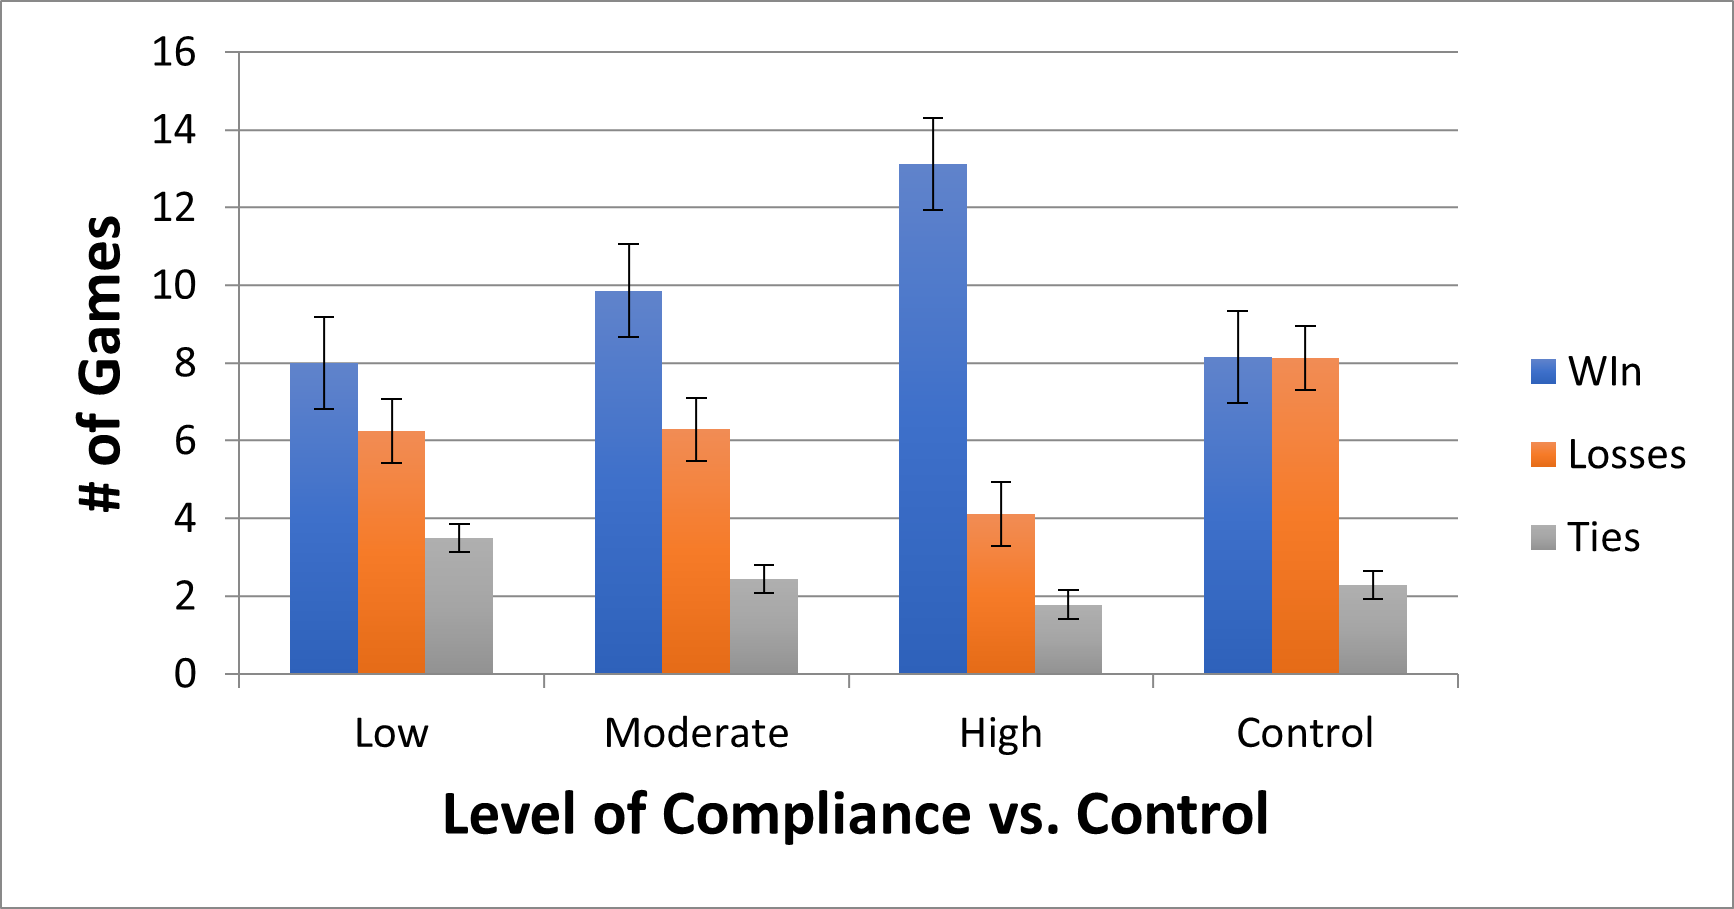
There was a statistically significant difference between among levels of compliance on the outcomes, Wilks’ Λ = .435; F(3,22)=3.78;p =0.004; partial η2 = .340. There was a statistically significant main effect for wins and losses among compliance groups (F(2, 24) = 12.38, p < .001; partial η2 = .508; and F(2, 24) = 4.663, p=0.019; partial η2 = .280, respectively. There was no significant effect of compliance on the number of ties (F(2, 24) = 1.609, p=0.221; partial η2 = .118. Tukey post-hoc tests showed that, highly compliant teams had more wins than moderate (p=0.002) or low compliance teams (p=0.001). Highly compliant teams had significantly fewer losses than moderately compliant teams (p=0.019), but not low compliance teams (p=0.122). No significance differences were found between groups for ties. (Table 3)
Overall, level of compliance was statistically different than the control group with respect to performance. Each compliance group (low, moderate and high) had more wins (p=0.005) and fewer losses (p=0.002). There was no statistical difference for ties (p=0.856). (Figure 2)
_comp.png)
Discussion
This study analyzed how the implementation of the 11+ IPP impacted overall team performance during a competitive season. In addition, this study analyzed how differences in compliance within the intervention group impacted the win/loss record of the Intervention teams. The results from this study support each of the hypotheses. Implementation of the 11+ demonstrated a positive relationship with overall team performance. The teams that implemented the program recorded more wins and fewer losses throughout the competitive season compared to the Control teams that were using their own warm-up protocols. Furthermore, the teams that were highly compliant utilizers of the 11+ recorded more wins and fewer losses compared to the teams with moderate and low compliance.
This study is the first of its’ kind to analyze how team win/loss record may be positively impacted by virtue of using the 11+ warm-up program. Prior studies have analyzed how the individual user might be impacted by virtue of using the program.19,20 Implementation of the 11+ IPP has led to significant changes in vertical jump height, improvements in knee biomechanics, increased lower extremity strength, improvement in sprint speed, improvement in proprioceptive balance testing and total body stability.21–27 Positron emission tomography musculature activation analysis of athletes using the 11+ demonstrated increased uptake in the cells of the gluteus minimus, gluteus medius, and rectus abdominus muscles compared to controls.28 These specific muscles have been hypothesized to have a protective benefit with respect to knee and hip injuries incurred in the sport of soccer.29,30 Youth and collegiate soccer players using the 11+ program demonstrated decreases in peak knee abduction during a drop jump, improved peak ankle eversion moment during both preplanned and unanticipated cutting and double leg jump, and increased knee flexion during a drop jump, respectively.25,26 These biomechanical changes have demonstrated a protective benefit in reducing lower extremity injury in the soccer athlete, particularly with respect to ACL injury risk.31–37 In addition, the 11+ has been shown to be as effective as other traditional warm-up programs in increasing individual oxygen uptake, core temperature and systemic lactate levels.21 This is an important aspect of the program when medical personnel delineate the value of using the 11+ to directly replace a team’s traditional warm-up program.
There have been numerous studies that have demonstrated the merits of the 11+ program with respect to implementation in youth, upper and lower injury rates reduction, decreases in time loss and improved biomechanics.18,19,25,38–45 However, the implementation of this program, and others like it, continues to suffer with respect to widespread adoption and implementation in the soccer community at large.1,6,46 The reasons that coaches provide for refusing to implement IPPs include; time constraints, economic cost, complexity, lacking the personnel to conduct the program, boredom with using a consistent warm-up, lack of sport specificity and lack of player commitment or belief in the program.47–49 In the German amateur level soccer clubs, more than half of the surveyed participants were not aware of the 11+ IPP. Among the coaches who were familiar with the IPP, however, 75% reported utilizing it regularly (at least once per week). Variables that were associated with increased utilization of the 11+ IPP included holding a coaching license, high competitive level, and coaching a youth team.50 A study compared the implementation of the 11+ IPP among Australian and Saudi Arabian soccer coaches. In Australia 73% implemented the 11+ IPP, but only 51% implemented the program as it is recommended. In Saudi Arabia, only 40% used the 11+, but 70% of those coaches reported using all the 11+ exercises as recommended.51 In the United States, the 11+ was used an an IPP in high school aged athletes with no reduction in lower extremity injury rate. However, only 32% of coaches reported that the 11+ was implemented at least twice a week.52 Without proper implementation fidelity and compliance, the researchers cannot expect these programs to demonstrate the intended benefit of injury mitigation.
The results of the current study suggest that in addition to improving overall compliance, program fidelity must also be considered.48,53–56 To improve the rate of IPP implementation fidelity, education should directly address relative advantage, compatibility, and complexity.55 In order to facilitate optimal implementation of an IPP, it is important to emphasize our results which demonstrated improved winning percentage. Relaying the relative advantage and performance benefit of IPPs may increase the likelihood of coaches, managers and players to adopt programs with more consistency, and with adequate adherence and program fidelity.57–59 This is a critically important message that may optimally impact adoption rates and overall injury mitigation.
Prior research has demonstrated that team performance (games won) is often negatively correlated to injury rate.9,60 In addition, increased injury rates that impact the highest ranked players are detrimental to team success.61,62 Player availability, particularly in late season and post-season play, is very important to a coaching staff. The premise that an IPP may improve player availability should also be emphasized when attempting to facilitate consistent program implementation. The researchers have previously shown in this cohort that in the Intervention teams, the 11+ significantly decreased time loss to injury by 28.6%. Player availability may partially explain why the Intervention teams in our study won more games than the control team.18 While using a neuromuscular training program, such as the 11+, the programs were not designed to improve overall athleticism or increase a player’s level of skill. However, the notion of improved overall player durability and mitigation of injury risk gives a player an advantage and an opportunity to be available to play more consistently throughout the season. This improvement in overall player availability may assist a coaching and managerial staff in strategizing for in-season and post-season play more consistently.
Limitations
The limitations of this study include the fact that this study was only included male Division I and Division II collegiate soccer players and did not include women or lower Divisions within the NCAA collegiate system. The study was only conducted for one competitive season, and performance was only tracked for that season. Also, individual compliance was not tracked for each player. Compliance was tracked as a team, thus individual variances in compliance were not captured in this study.
Conclusions
The findings of this current study indicate that implementing the 11+ has the capacity to improve overall team performance in comparison to an age and skill matched control group. The higher the compliance to the 11+ program, the more favorable the team performance was, with respect to more wins and fewer losses. This research may be persuasive in encouraging coaching staffs to implement an injury prevention intervention in training. This data may assist in shifting the paradigm to enhance overall IPP program adoption, improve team performance and decrease overall injury rates.
Conflicts of interest
The authors declare no conflicts of interest.