INTRODUCTION
Breaking or breakdancing is a subgenre of hip-hop dancing originating from New York in the 1970s.1 It incorporates elements of music, dance, and acrobatics, with athletes (breakers) performing complex footwork, flips, and power moves, including weight bearing through their hands and head (Table 1). Breakers are unique in that they can be categorized as both overhead athletes and reverse chain athletes.2 Following a rise in global popularity, breaking made its Youth Olympic Games debut in 2018 and will make its full Olympic debut in Paris 2024.1 Breaking battles involve two breakers competing against each other for three rounds. Each round involves one breaker performing for around 30-45 seconds before the opponent responds. A panel of judges determines the battles’ winner based on the breakers’ style, moves, athleticism, artistry, and the fluidity in which moves connect. Despite breaking’s growing popularity and Olympic status, there is a paucity of knowledge about the performance, competition demands and medical aspects of the sport.
Breaking carries a high-risk of musculoskeletal injury,3,4 but only four published epidemiological studies exist. In 2009, Cho et al.5 reported the results of a survey and medical examination in 42 Korean Bboys. Over 95% of the participants reported past or present musculoskeletal injury, with the wrist, finger, knee, and shoulder being the most commonly injured areas. A subgroup of 23 professional breakers reported significantly more injuries than their 19 amateur counterparts. Kauther et al.4 surveyed 144 breakers (40 professionals and 104 amateurs) at the “Battle of the Year World Final” in Germany. The wrist, spine, shoulder, and ankle were the most commonly injured areas. Their study also reported a higher number of injuries among professional breakers. A further survey including 138 breakers reported a higher injury rate among breakers than in other forms of hip-hop.3 The annual injury incidence of hip-hop dancers has been reported to be over three times the rate of modern dancers and eight times that of ballet dancers.3 Most recently, Tsiouti et al.6 surveyed 320 breakers (16% professional and 65% student-recreational) from multiple countries. Over 40% of the participants reported current injuries and over 70% reported an injury within the previous year. The most frequently injured areas were the arm-hand, shoulder, knee, and neck. Taken together, these preliminary research findings indicate that injuries are common in breaking, with a higher injury risk than other dance forms, particularly for injuries of the upper-extremity and spine.3,7
Beyond epidemiological analyses, published information on medical or performance aspects of breakers is sparse. One study reported medical imaging in breakers8 and small, preliminary studies on the physiology,9 biomechanics,10 well-being11,12 and gene profiles13 of hip-hop dancers have been published. In a cross-sectional observational study, Wyon et al.9 investigated the cardiorespiratory profiles and performance demands of nine male breakers and nine female new style dancers (a different style of hip-hop). During a performance simulation, breakers’ maximal oxygen consumption (VO2peak) was significantly greater than published findings from contemporary dance,9 and mean heart rate (HR) was higher than previous reports from ballet, contemporary dance and dancesport.9
In view of the high injury risk and growing popularity of breaking, further research on medical and performance aspects of this sport is crucial. While there is a general paucity of research on this topic, the lack of published information on specific performance testing (e.g., endurance, strength and jump testing) is particularly apparent. It is also notable that elite level breakers are under-represented in published studies to date.4,6 Gaining a better understanding of the injury and performance profiles of breakers is essential to support injury prevention, rehabilitation, and performance training efforts. For example, establishing specific strength profiles in the shoulder and hip can inform injury monitoring and management, as evident in other sports.14,15
The use of isometric strength as well as vertical jump profiles for screening and monitoring athletes is common.16,17 For example, measurement of isometric shoulder strength is widely employed in upper limb dominant or overhead sports,17–19 and isometric hip adduction strength has been identified as a risk factor for subsequent injury across a variety of sports.20,21 Normative data in vertical jump testing has been reported in numerous sports, including gymnastics and parkour22–25 which are similar to breaking with regards to physical demands. Profiling breakers using clinically accessible tools such isometric strength and vertical jump testing will allow clinicians to compare data and researchers to begin to establish areas of further research.
The purpose of this study was to describe injury and training profiles, along with the results of a short performance test battery, in a group of elite breakers. The findings can inform the development of future test batteries and support the efforts of medical and performance staff working with breakers.
MATERIALS AND METHODS
Athletes
This study retrospectively examined the clinical and performance data that was collected on fourteen professional breakers who were invited to attend a 10 day breakdance performance summit. Breakers were invited based on their previous breakdancing performance at international battles and having been identified as potential participants in the 2024 Olympic games. The breakers were categorized into elite and developing, based on successful qualification for a world finals competition.
Tests were chosen from a range of standard test procedures used frequently at a performance center. Clinicians and practitioners at the performance center selected tests to build a clinical perspective of the athletes in a limited amount of time. The testing that was conducted was not designed for research purposes, but as standard procedure at the performance center. All breakers gave verbal and written consent to participate in all tests. All breakers also gave written consent for their anonymized data to be published. This study was IRB exempt as it was a retrospective analysis.
Injury and Training History
Injury and training history was collected via a detailed interview with an experienced Sports Physiotherapist (AA or RM) in conjunction with a physical musculoskeletal assessment (associated with another study). The interpretation and definition of ‘injury’ was left open to the athlete so as not to exclude any relevant information. If clarification was required, it was explained broadly as any musculoskeletal issue that resulted in pain, the breaker having to modify their training / performance, or being unable to train / perform. Injuries were categorized according to Fuller et al.26 with regards to body area and injury type. Athletes were asked to detail their weekly training routines regarding hours per day, days per week, training modalities, and breaking surface. When training modalities other than breaking were discussed, the Sports Physiotherapists followed up with the amount of time per day and week these modalities were used, and the number of years the breaker had been performing that modality. In addition, each breaker was asked the number of years they had been breaking.
Endurance Testing
To make sure testing was similar across all breakers and since not all were familiar with running, particularly at high speed, biking was selected to determine endurance performance. Endurance testing was performed by an exercise physiologist (RH). The endurance test was performed on a cycle ergometer (Cyclus 2, Leipzig, Germany) to determine maximal oxygen uptake (VO2max) (Cortex Metalyzer 3B, Leipzig, Germany), peak power output (PPO), maximal heart rate (HRmax) and lactate threshold (LT). Breakers were instructed to refrain from strenuous exercise and alcohol for 24 hours prior. Caffeine, food, and drinks containing sugar were to be avoided for three hours prior to the endurance tests. The testing protocol used was a two-phase test consisting of an incremental, sub-maximal exercise test (Phase 1) (50 W; increment: 25 W every 3 min, cadence > 80 rpm) until blood lactate increased by ≥ 1 mmol/L compared to the previous stage,27 followed by a ramp test (Phase 2) interspersed with an 8 min break (4-min low intensity cycling at 40 W followed by 4 min passive rest). The ramp test started with the power output of the stage during the incremental test before the lactate increase of ≥ 1 mmol/L and increased in 25 W steps per minute until voluntary exhaustion. During the last 30-s of each increment capillary blood from the earlobe was collected to determine blood lactate and blood glucose (Biosen S-line Clinic, EKF diagnostic GmbH, Magdeburg, Germany). A modified version of the concept of Thoden et al27 was introduced to determine LT.28
Jump Testing
Following a general warm-up, reflective markers were placed on bony landmarks of the pelvis of each subject (left and right/anterior and posterior iliac spines) to record jump height. Jump testing was performed by a biomechanist (CS) with 10 years’ experience. All trials were recorded by a 12-camera motion capture system (Bonita 10, Vicon Oxford, UK) at 200 Hz synchronized with 2 AMTI force plates (OR6, AMTI Watertown, MA, USA) sampling at 2000 Hz. Prior to testing a static trial was performed to record upright standing height. All participants performed three vertical jumps, squat jumps (SJ), counter movement jumps (CMJ), and drop jumps (DJ). Participants performed as many familiarization trials as necessary prior to recording until they were comfortable with the movements. Participants held their hands on their hips during the entire jump to reduce the influence of arm-swing on jumping performance. The participants then performed up to five trials, with the mean of the best three – determined by jump height – being retained for further analysis. Jump test order was performed in block order for all participants (SJ, CMJ, DJ).
Squat Jump
Participants were instructed to squat down to a “comfortably deep” knee angle (approximately 80-90°) and hold that position for three seconds before performing a maximal vertical jump. If the squat position was not held long enough, or a counter-movement was observed, the trial was repeated.
Counter Movement Jump
Participants were instructed to stand erect on the force plates, rapidly flexing the hips, knees, and ankles before performing a maximal vertical jump. Counter-movement depth was not controlled.
Drop Jump
Participants started standing on a 34 cm box placed just behind the force plates. Participants were instructed to lean forward and fall vertically onto the force plates. Participants were given the instruction to perform a maximal vertical jump immediately upon landing while minimizing ground contact time (“Try not to even let your heels touch the ground”), landing again on the force plates.
Parameter Extraction
Jump height for each jump was calculated using the difference between the height of the mean of the four pelvis markers in each trial and the standing height. Limb symmetry index (LSI) was calculated as the difference between the net impulse of the right and left leg expressed relative to the greater side (negative values indicate left > right, positive values indicate right > left). For the DJ, reactive strength index (RSI) was also calculated as the ratio between jump height (m) and ground contact time (ms) during the initial landing/jump phase.
Hip and Shoulder Screening
Previous interaction with the group revealed prevalence of shoulder, hip/groin, and knee injuries. Therefore, reproducible isometric muscle tests for shoulder external/internal rotation and hip abduction/adduction were selected to profile these muscle groups and to allow comparison to other sports and dance genres. Fixed frame dynamometry is a valid and reliable tool in assessing hip adductor and abductor strength.29,30
All maximal isometric strength tests were performed on a fixed-frame portable dynamometer (KangaTech, Melbourne, Australia) by an experienced sports physiotherapist (RM) immediately following jump testing. After three to five familiarization trials, three 5-second maximal trails were performed. Test order was fixed (shoulder internal rotation, shoulder external rotation, hip adduction, hip abduction). For shoulder tests, the right limb was always tested first, followed by the left. For hip tests, both legs were tested simultaneously. Peak force was averaged across trials for analysis.
Shoulder Strength
Maximal isometric shoulder internal and external rotation were both performed in a supine position with the shoulder in 90° of abduction, 0° of shoulder external rotation, and the elbow flexed to 90°, resulting in a vertical forearm with the hand pronated. A towel was placed underneath the elbow to ensure that the humeral axis remained in the plane of the scapula (without horizontal add-/abduction). For external rotation test, participants pushed against a pad set at the height of the dorsal aspect of the wrist at a right angle to the forearm. For the internal rotation test, participants pushed against a circular pad set at the height of the palmar aspect of the wrist at a right angle to the forearm.
Hip Strength
Hip maximal isometric strength tests were performed in a supine position, with the knees supported by a foam roller resulting in approximately 30° of hip flexion. For hip abduction, participants pushed outward against circular pads fixed at the height of the lateral femoral condyles. For hip adduction participants pressed inward against circular pads fixed at the height of the medial femoral condyles. During both abduction and adduction tests participants were instructed to keep their feet on the floor, and approximately in line with their patella/hip joints. Both add-/abduction tests were performed bilaterally.
Parameter Extraction
The peak force averaged across trials was recorded for each movement and expressed relative to body weight (BW). The LSI was calculated similarly to the jump tests. Additionally, joint ratios were calculated for both the shoulder and the hip with the left and right sides calculated separately. Shoulder rotation ratio was expressed as the percentage ratio between the external to internal rotation Fmax. Hip ratio was expressed in percentage as the ratio between the adduction to abduction Fmax.
Statistics
All data are reported as median and interquartile range. Endurance testing and jump variables were compared between elite and developing breakers using Wilcoxon rank sum. Wilcoxon rank sums were used to compare shoulder internal and external Fmax, LSI, and shoulder ratio in athletes with and without a history of shoulder injury. Wilcoxon rank sums were also used to compare hip adduction and adduction Fmax, LSI, and hip ratio in athletes with and without a history of hip/groin injury. Level of significance was set to alpha ≤ 0.05.
RESULTS
Fourteen breakers participated in the study (4 Bgirls, 10 Bboys) ranging in age from 14 - 31 (median 23 [25-75% inter-quartile range 20.5 - 28.2] years). The breakers height was median 166.6 [153.8 - 170.4] cm and weight was a median of 63.5 [range 153.8 - 170.4] kg. There were four breakers (all Bboys) classified as developing (age 18.7 [15.5 - 21.8] years) and 10 breakers (4 Bgirls, 10 Bboys) classified as elite (age 27.4 [23.0 - 29.5] years). The breakers came from five continents; North America (N=2), South America (N=2), Asia (including Russia, N=4), Europe (N=4), and Africa (N=2).
Training
The group had a median of 11.0 [10.0 - 14.0] years breaking experience. The developing group had between 8 -12 years (median 10.0 [8.25 - 11.25]) experience. The elite group had 9 – 21 years (median 12.5 [10.0 - 15.5]) experience.
The group trained for median 24.4 [20.5 - 30.0] hours per week, including all training modalities. The majority of their training time was breaking, with 5.6 [2.8 - 9.1] hours per week dedicated to non-breaking training modalities. The developing group spent 29.0 [22.8 - 33.0] total hours per week training, with only 0.5 [0 - 1.25] hours per week of that training time dedicated to non-breaking training. In contrast, the elite group spent 23.5 [19.3 - 30] total training hours per week, with 8 [5.3 - 11.3] hours per week of that time dedicated to non-breaking training.
The most common non-breaking training modality was strength training. Twelve of the 14 breakers performed strength training. Interestingly, the only two who did not perform strength training were under 18 years old/developing breakers. Only one breaker had more than two years’ experience with strength training. Other non-breaking training modalities included cardiovascular training (n=7, running, biking, boxing, skipping rope), stretching/mobility (n=3), yoga/meditation (n=1), and acrobatics (n=1).
The most common surface for the breakers to train on was linoleum or laminate (n=5), followed by wood floors (n=4), or a hard matt (n=3). Other floor surfaces included cement/concrete for one breaker or marble for another (note: some breakers trained on multiple surfaces).
Injury History
The 14 breakers recalled 45 injuries, leading to an injury burden (average) of 3.2 injuries per breaker (median 3.5 [2 - 4]) The elite breakers had an average of 3.1 injuries per breaker, and the developing breakers had an average of 3.5 injuries per breaker.
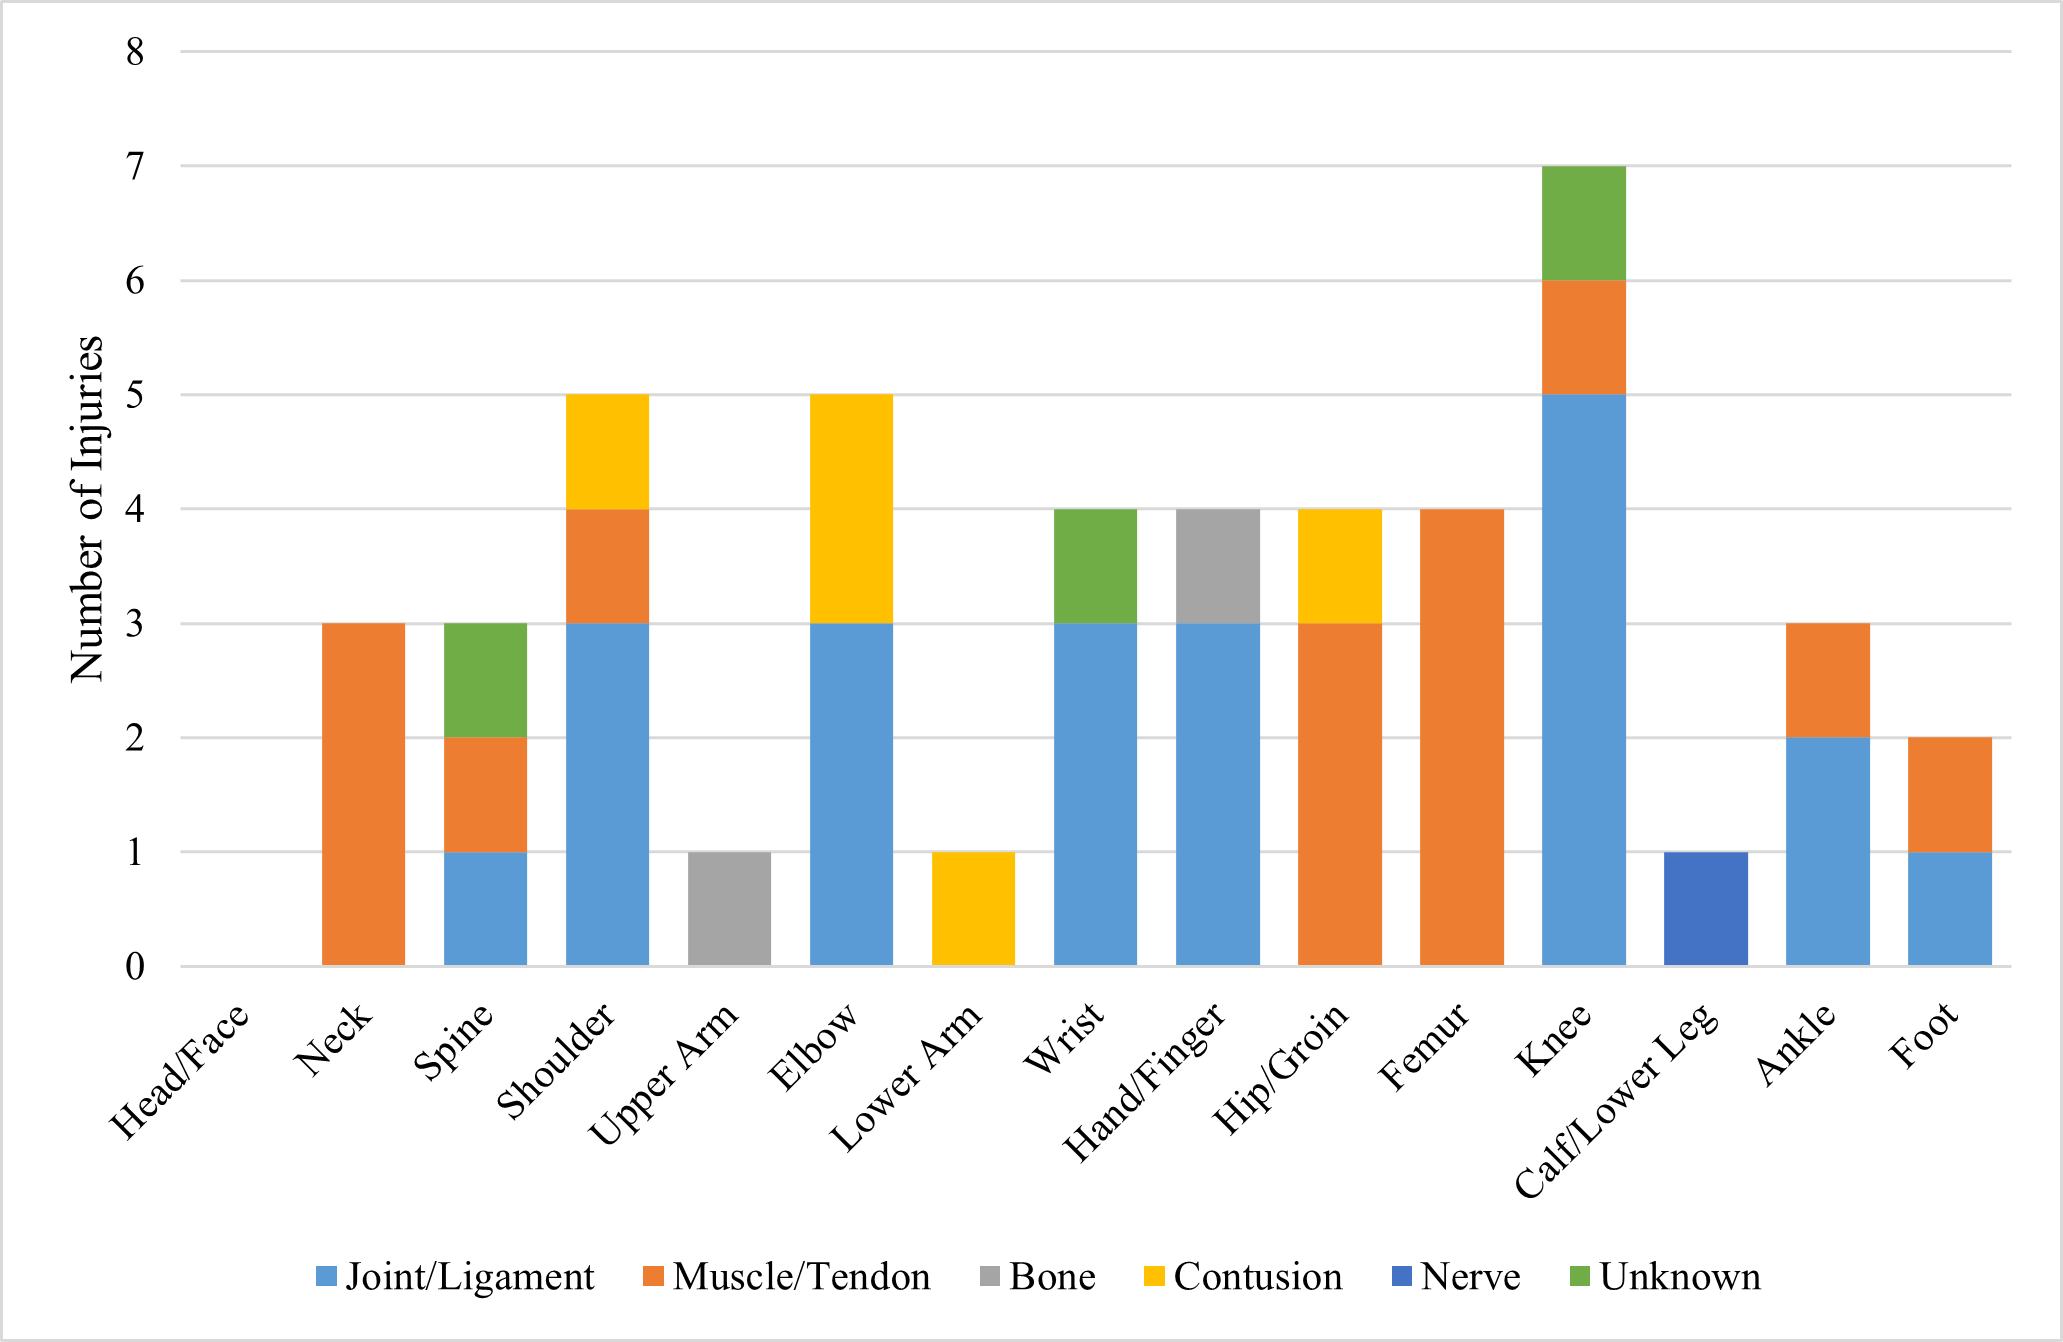
The most common body part injured was the knee, followed by the elbow and shoulder (Table 2). The most frequently injured joint was the knee. The thigh was the most frequent site of muscle injuries (Figure 1).

Endurance Testing
The endurance testing results are found in Table 3. Predicted power at 2 mmol/L was also the only parameter to differ between the elite and developing breaker groups, where elite breakers had higher power output predicted at 2 mmol/L than the developing group (p < 0.01).
Jump Testing
Jump performance results are listed in Table 3. There were no significant differences between groups observed for any jumping parameters.
Hip and Shoulder Screening
Hip strength outcomes for all breakers are presented in Table 4. There were no differences in hip abduction or adduction strength between breakers with and without history of hip injury (Table 4). Shoulder strength measures are presented in Table 5. There were no differences in shoulder external or internal rotation strength in breakers with and without a history of shoulder injury (Table 5).
DISCUSSION
Although a small cohort, the results of this study are the first to describe functional data from breakers. The group had a median 11 years breaking experience and trained between 20 and 30 hours per week. The majority of that training was breaking. Although elite breakers dedicated more time to non-breaking training modalities, all had < 2 years’ experience. Breakers had approximately three injuries each with the knee, followed by the elbow being the most common locations. There were minimal differences between the elite and developing groups with regard to functional tests, and no significant differences between athletes with and without a history of shoulder or hip injury. The results of this study provide pilot data for future studies, a starting point for creating functional screens, and comparison data for clinicians treating breakers.
Injury and Training History
Consistent with the previous epidemiological literature on breakers,6 knee and upper limb injuries (shoulder / elbow/ arm / hand) were the most commonly injured areas in this cohort. The number of injuries reported appears low in comparison with previous studies.4,5 With some breakers in this cohort competing for 20 years, it is likely that the results were affected by significant recall bias. Additionally, interpretation of what constitutes an injury was variable across the group. There appears to be a culture of “pushing through pain” amongst breakers, and therefore any interpretation around epidemiology of this group should be taken with caution. Future qualitative studies could explore the culture around injuries in breaking, with quantitative studies using valid/reliable scales, such as the Oslo Sports Trauma Research Center (OSTRC) Questionnaire.31
There was a noticeable difference between the elite and developing groups in training. Elite breakers spent more time per week training, but with a greater amount of non-breaking training modalities. In contrast, it was rare for the developing breakers to perform any training outside of breaking. Strength training, followed by cardiovascular training, were the most common non-breaking training modalities used amongst the group. Of significant note, all breakers had a short training history (< 2 years) in non-breaking modalities. The data could indicate that elite breakers may have more understanding as to the importance/benefits of strength training and diversity in training modalities; knowledge that less experienced breakers could benefit from. In congruence with previous data indicating that breakers often train unsupervised and receive less medical support than other dance forms,7,8 this data seems to indicate that all breakers, regardless of experience level, may benefit from education regarding injury prevention, load management, as well as guidance and coaching with regards to training planning, strength training, cardiovascular training and recovery.
Endurance
Endurance testing is a common assessment tool used in the authors’ center, giving clinicians and practitioners insight into the cardiovascular fitness of each athlete and areas where training might be supported. Given the lack of literature on breaking and in collaboration with the breakers’ coaches, the authors’ decided that endurance testing as a baseline could be valuable. Further, endurance capacity can be seen as an important general fundament for each type of sport (e.g. greater amount of high quality training, faster recovery from strenuous tasks, higher resilience and injury prevention).32,33 The majority of the aerobic and anaerobic training that the breakers in this cohort performed each week was through their breaking training.
To the authors’ knowledge there are no studies examining the energy demands of breaking. Individual battles often involve three rounds. Breakers decide who will perform first, and then each round they each have a maximum time (often 30-45 s but as long as 3 min) to perform as much or as little as they choose, and watch as the other breaker does the same. This individual battle format means that a breaker performs at high intensity for up to 3 min, followed by up to 3 min recovery, before performing again. Doubles or team battles are organized differently often allowing an athlete more recovery between rounds of breaking. The analysis of selected breaking training sessions (Supplemental Material), revealed the intermittent nature and high intensity content of these sessions (E.g., almost 45% of the total training duration within Zone 2 and 3). Some breakers even reached higher HRmax values compared with the endurance test to exhaustion on the bicycle (Supplemental Material Figure 1). Therefore, most of the breaking training can be classified as a specific High Intensity Training.
Putting the endurance performance of the breakers in the current study into perspective, their capacity is comparable to female rhythmic gymnasts and ballet (VO2max slightly above 50 ml/kg/min).34 Based on the reported training volume (mostly specific breaking training, and very little general endurance training), and high intensity nature of breaking, there is a clear potential to progressively improve the general endurance capacity of breakers by adding classical endurance and strength training, or by more systematically implementing the high intensity breaking content.
Jump Testing
Vertical jump measurements are very common in sports performance assessments.35 Vertical jumping while not necessarily sport-specific for breakers, was chosen as an initial testing method given the ease of use and comparison to normative data from other sports. There were no significant differences observed across the elite and developing groups. There were >10% LSI in SJ and DJ across the whole cohort. Such asymmetries could be normal for breakers (e.g., based on dominant side, preferred rotation direction, etc.), or as a result of an unfamiliar jumping pattern, however clinicians treating breakers in a rehabilitation setting may want to investigate any asymmetries they observe to explore potential injury implications.
Parkour and artistic gymnastics are likely the two closest sports for comparisons to breaking. This cohort of breakers had CMJ heights around 32cm. Cohorts of young male and female artistic gymnasts had average vertical jump heights > 40 cm.22–24 Stafford et al.25 investigated a small group of male parkour athletes, finding a CMJ height of 39.2 ± 5.9 cm. Direct comparison of results is difficult due to differences in demographics as well as jump assessment methodology, but it is also possible differences could be due to sporting demands. Breakers rarely produce or absorb purely vertical force. Although flips and jumps are common in power moves, they are usually the entrance to or exit from another move. In comparison, parkour athletes require vertical force to climb walls and artistic gymnasts to mount apparatus or land routines. It is possible that a different jump assessment in breakers could be more appropriate to assess the sport-specific demands.
Shoulder Strength
Little evidence exists regarding appropriate shoulder strength measures in reverse chain athletes. The limited published normative data on overhead athletes demonstrates differences across tennis, handball and volleyball.17 Reference values for isometric shoulder ER and IR strength in a large group of overhead athletes provide some comparison for this group of breakers.17 A 2016 study of competitive volleyball, tennis and handball players demonstrated values of 1.6 - 2.0 N/kgBW for ER and 1.6 - 2.2 N/kgBW for IR. In comparison the breakers demonstrated higher values of between 2.0 - 2.9 N/kgBW for ER and 2.5 - 3.9 N/kgBW for IR. There are a number of possible reasons for these differences including: the reverse chain nature of breaking involving higher loads through the shoulder than overhead sports; the training volume of the subjects being considerably higher in the breakers group (18.8 hours per week breaking training vs 5.4 - 5.8 hours per week overhead sports participation); the difference in testing positions: supine for the breakers which stabilizes the scapula vs seated for the overhead athletes; and differences in testing equipment – fixed frame vs hand held dynamometry.
While not reaching significant differences, breakers with a history of shoulder injury in this group demonstrated lower ER:IR strength ratios on the previously affected side compared to breakers who had no previous injury. It is not possible to deduce if this was a pre-existing risk factor for injury, or indicative of insufficient restoration of strength post injury.
Taking the suggested ER:IR ratio cut-off of 1.0 for overhead athletes,17 all of the breakers, regardless of shoulder injury history, demonstrated ratios below this value. Breakers may demonstrate lower ratio values as a result of differences in shoulder loading in comparison to overhead athletes. Overhead and throwing athletes have high eccentric external rotation loading, as demonstrated by strength data on dominant vs non-dominant arm.17 In contrast, depending on the breaking style used, a large amount of time can be spent loading the anterior shoulder and chest while on the floor, potentially creating an imbalance of loading on internal vs external rotators.
The use of the ER:IR ratio may have a place in the screening process of specific sports but should not be used in isolation. The absolute strength of external and internal rotators must be considered. Such measures can be useful when gathered preinjury to help refine RTS decisions as well as identify changes in strength over a season.2 Future considerations for strength testing in this group could consider reviewing the external and internal rotation strength in different ranges, in particular 0° shoulder abduction/0° external rotation position with the elbow by the side which mimics the ‘freeze’ move in breaking. There are a wide number of shoulder performance tests that could also be considered relevant for this group (Closed Kinetic Upper Extremity Stability Test [CKUEST],36 ASH,37 Plyometric Push up,38 isokinetic dynamometry,39 Upper Quarter Y-Balance Test40).
Hip Strength
Reference values for hip strength exist across various sports including football (soccer),41 Australian football,42 Rugby League,43 ice-hockey,44 and gymnastics,45 indicate that ‘normal’ strength and hip adduction : abduction ratio are sport dependent. A recent study of elite female gymnasts reported lower scores than the current cohort (0.15 BW adduction, 0.17 BW abduction).45 While gymnastics could be considered one of the closer sports to breakdancing, the participants were considerably younger than the current cohort (age 10 - 13) and of much lower body mass (37 ± 10kg) therefore making comparison difficult.
Adductor injuries accounted for all previous muscle injuries in the hip/groin injury category. While not reaching significant differences, there were observed lower absolute strength in both adduction and abduction as well as a lower adduction : abduction ratio in the previously injured group vs non-injured. These scores could suggest pre-existing risk factors for injury or insufficient recovery of strength post injury. As a screening tool moving forward, variability should be observed within individuals until normative values and ratios are clear for breakers. Similar to differences observed in different playing positions within the same sport,43 the variety of breaking styles (power movers vs breakers whose style involves more top rock / footwork) may influence hip strength profiles.
Limitations
A primary limitation of this study is its sample size. With minimal literature available on breakers, following the breaking summit both the breakers and authors felt that sharing the data collected at the performance summit was an opportunity expand knowledge beyond the elite level. However, given that data was collected at a professional camp with only 14 breakers, it is a very small cohort. Dividing the group further into developing and elite was a clinical decision to explore if differences might exist. Given the small sample size, all comparisons should be viewed with significant caution.
The breakers in this cohort all compete on an international level and are considered likely contenders for the 2024 Olympics. Therefore, the data from these breakers may not be generalizable to amateur breakers or breakers with less than eight years’ experience. That said, the breakers ranged in age from 14-31 years old, and most had minimal training history outside of breaking, thus the data presented are still clinically meaningful.
Tests were chosen based on the injury epidemiology available in the breaking literature and attempting to profile the breakers in a limited amount of time. Given the dynamic nature and variable styles involved in breaking, it was difficult to select tests that capture all breaking demands. For example, vertical jump tests may be more relevant for breakers who use a lot of power moves, as assessing explosive power production is applicable to their style. However, shoulder strength assessments, core strength or upper body plyometric assessments may be more relevant for breakers that use more footwork/floorwork.
The authors recognize that the technology used in this study could be considered cost prohibitive for some clinical settings. Table 6 offers less expensive alternatives to the testing methods used in this study.
CONCLUSIONS
The results of this study serve as the first published functional data on breakers. Although a small sample of professional breakers, the results indicate that the knee was the most common body part injured. Muscle injuries were most common at the femur/thigh, and joint injuries were most common at the knee. Breakers trained almost 30 hours per week with experienced breakers including more non-breaking training modalities into their weekly routines than developing breakers. The results indicate that breakers may benefit from education regarding non-breaking training modalities as well as injury prevention and recovery techniques. This study demonstrates the difficulty of standardizing tests for breaking, given the wide range of demands involved. Based on the results of this study, the authors recommend that future test batteries consider: 1) shoulder rotation strength testing at both 90° and 0° shoulder abduction, 2) strength endurance testing of the shoulders, 3) an upper body plyometric assessment, 4) lower body plyometric testing involving horizontal or rotational components, 5) heart rate monitoring during training in addition to endurance testing. Given the wide range of demands and paucity of literature the authors hope that the observations published here will help clinicians and researchers working with breakers in the future.
ACKNOWLEDGMENTS
The authors would like to thank all of the breakers who participated in this study. They would also like to that staff at Red Bull and the Red Bull Athlete Performance Center who participated and supported the breaker’s performance summit. Thanks especially to Roland Helmberger who performed all of the endurance testing.
COI
The authors have no conflicts of interest.