
INTRODUCTION
Monitoring the progress of patients who are rehabilitating after an anterior cruciate ligament reconstruction (ACLR) is important to ensure appropriately targeted care is provided for the individual.1 Many patients undertaking this care ultimately aim to return to sporting activity where the ability to hop and jump are important determinants of safe and effective performance.2 Accordingly, once clinically indicated, it is important to monitor hop and jump performance during rehabilitation to provide feedback regarding clinical progression and thereby inform treatment choices.1 A variety of jump tasks are commonly employed, each assessing different components of the musculoskeletal system. A squat jump, for example, is thought to primarily be a measure of concentric force production, whereas countermovement and box (drop) jumps represent increased utilization of the stretch-shortening cycle.3,4 Achieving competence in one but not the other can inform clinical decision making in terms of the contents of rehabilitation and strength training. Patients may show competence in one type of jump but not another which would direct rehabilitation towards the incompetent jump type. To incorporate this clinical reasoning into rehabilitation, the practitioner must be able to ascertain whether the patient has achieved competence (or not) in this jump type. This requires assessment of jump performance, and ultimately determining if the jump has passed or failed some type of criteria. Typically, this assessment is scored as pass/fail using a 90% limb symmetry index, found by dividing the performance on the uninvolved limb by the involved limb.5–7 For example, a jump height of 20cm on the involved limb and 16cm on the uninvolved limb would equate to a LSI of 80% (16/20).
Jump height can be used as a performance measure which can be compared to an individual’s previous measures and normative population data as an indicator of rehabilitation progression.2 In addition to the height achieved during a jump or hop, the reactive strength index (RSI, defined as the flight time divided by the contact time) is considered an important metric assessing an athlete’s ability to cope with stretch-shortening demands and infer a range of other performance-related qualities.8,9 Importantly, in anterior cruciate ligament reconstruction (ACLR) patients, RSI has been shown to be significantly impaired in those who suffered a contralateral injury in the absence of differences in hop performance.10 Including this metric in clinical assessment of patients recovering from ACLR provides important additional information which can then inform rehabilitation choices. Deeper examination of the components of this metric – i.e. the contact and flight times, has been advocated to better inform athlete-specific aims of rehabilitation: rapid force generation and maximum force generation respectively. While RSI provides an overall summary of an athlete’s plyometric or reactive strength capacity it is important to analyse and understand the components of that performance (contact time and jump height) so that the athlete’s specific deficits can be targeted more precisely in rehabilitation (for example: employing lower intensity efforts focusing on shorter ground contact times vs higher intensity efforts focusing on maintaining short ground contact time with maximal efforts). Hence the ability to accurately assess and interpret these components of RSI is key to successful restoration of function after ACLR.
Between-limb movement differences during landing in those who injured their anterior cruciate ligament (ACL)11 and those with a past history of ACL injury suggest that there are differences in kinematics during jumping and landing many years after their injury and surgery.12 Measuring jump performance using only flight time cannot infer kinematics or kinetics of an individual, and flight time is dependent in part on kinematics. Accordingly, validation is required not only in healthy participants using a video-based measure of jump performance13 but additionally in those with ACL injury for whom it is reasonably suspected that their biomechanics could vary.14–16 Jump performance is seen to vary according to athletic ability independent of knee function.17 As such, estimation of knee function through jump testing needs to be validated across a range of participants representative of those presenting for rehabilitation after ACL injury: athletic to non-athletic, those skilled in and naïve to jump technique, and with varying knee strengths.
Recently, video-based applications have been promoted as an alternative to force plates for measuring jump performance18 and could feasibly be a cost-effective alternative, however their validity (compared to force plates) has not been documented in recovering ACLR patients who likely demonstrate differences in kinematics and kinetics compared to healthy participants during their rehabilitation.11,14–16,19 Despite the continuous nature of jump metrics (e.g. cm, msec), clinicians and patients will often seek a dichotomized “pass/fail” result from a test, and frequently a diagnostic threshold of less than 10% limb asymmetry is used.19 For clinicians to implement this relatively inexpensive solution in practice, data describing the diagnostic accuracy compared to a reference standard are required. Additionally, information regarding the minimum clinically important differences for the continuous measures (i.e. jump height, contact and flight time, RSI) in a population of ACL injured participants encountered in regular clinical practice will be important to interpret between-session changes in performance in these patients.
Therefore, this investigation sought to describe the diagnostic accuracy (pass/fail using 90% LSI) and clinimetrics of an iPad-based app (“MyJump”) compared to reference force plate analyses for limb symmetry, jump/hop height, contact time, flight time, and reactive strength index. There was no a priori hypothesis regarding the veracity of the application.
METHODS
Fifty-one consecutive patients presenting for routine independent clinical assessment after ACL reconstruction from January to May 2022 were recruited for participation. There were no exclusions for any surgical comorbidities. These patients were a combination of professional and recreationally active patients presenting sequentially for care at the facility. As part of the usual rehabilitation of these patients, they agree to undertake periodic stage-appropriate subjective, clinical, and physical performance examination to inform their rehabilitation content and progression. The study was approved by the local Institutional Review Board (Ethics approval no E202009010) and was conducted in accordance with the recommendations of the STARD initiative.20
Test procedure
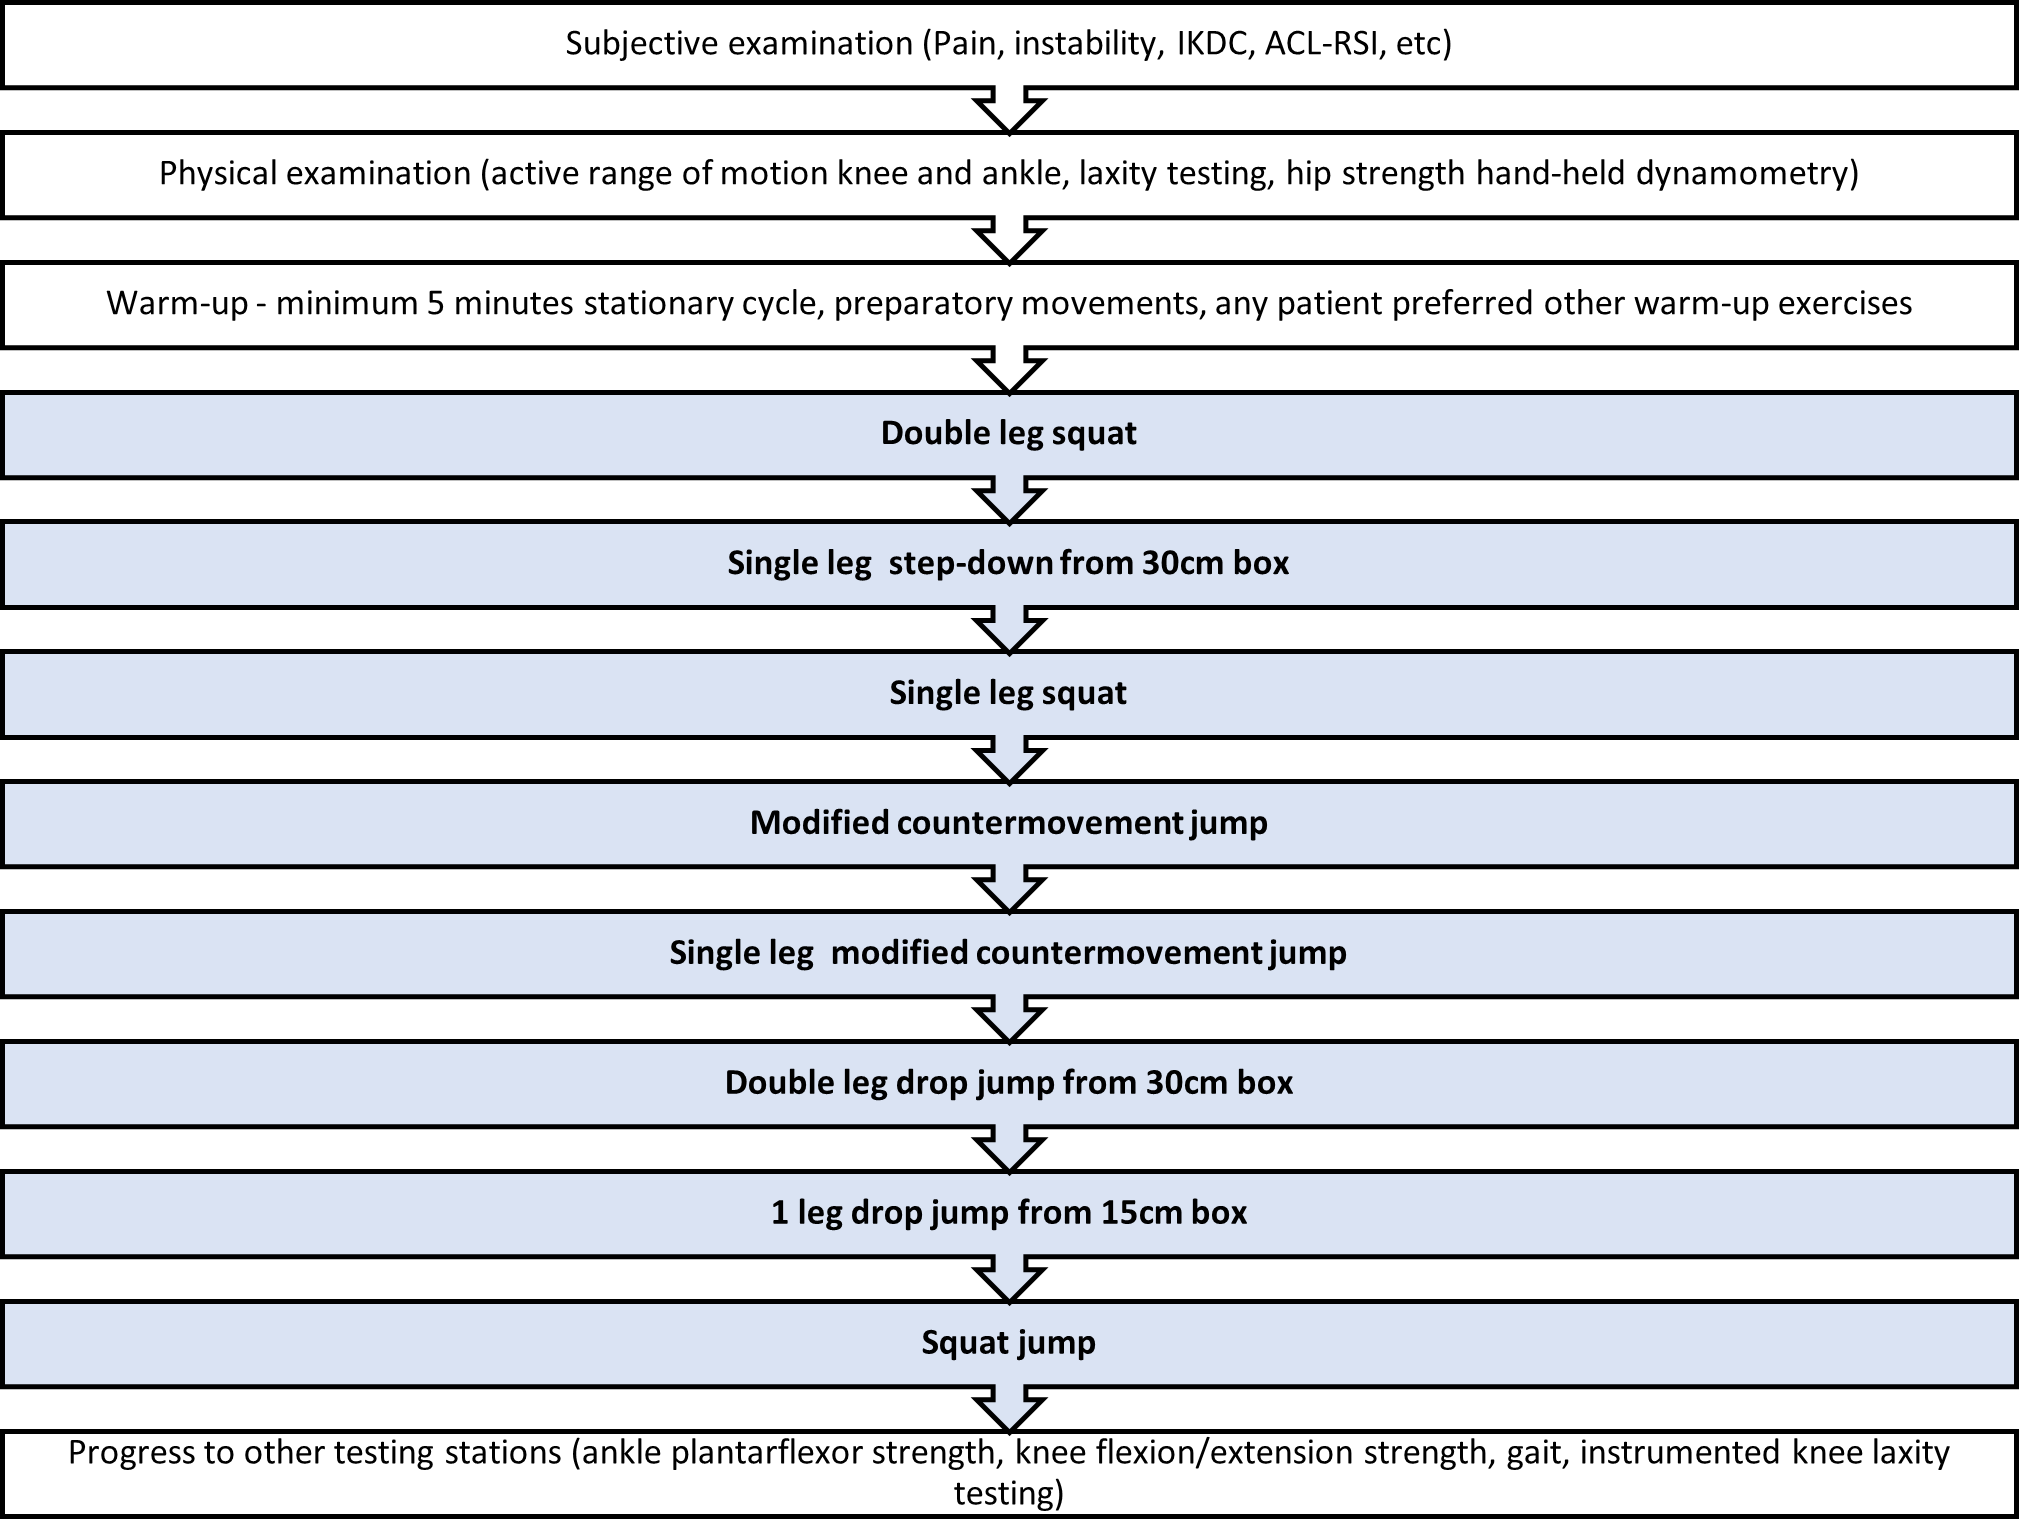
Once the patient had commenced two and one leg jumps/hops as part of their rehabilitation, these tests are respectively included in the routine independent clinical examination process. Briefly, patients are assessed pre-operatively, and then from six weeks post-operative every six weeks until discharge. During each assessment (six-week interval), the patient first completed a range of subjective questionnaires, and then was physically examined (patient-reported outcomes, clinical exam including range of motion, instrumented ligamentous laxity, isokinetic knee strength, hip and ankle dynamometry, gait, etc) before performing a warm-up of at least six minutes stationary cycling along with any exercises the patient prefers so that they were ready to undertake the movement testing (Figure 2). The movement tests are performed in a standardized manner on a non-treatment day in a designated analysis area with the sequence stopping if either the patient did not feel confident to continue, or the supervising physiotherapist was not confident of a safe execution of the test after having observed the preceding tests and the sub-maximal practice trials for the current test. The complete battery of movement tests would include, in order, the following: two leg squat, unilateral step down from a 30cm box, single leg squat, two leg modified counter-movement jump, one leg modified countermovement jump, two leg drop-jump from 30cm box, one leg drop jump from a 15cm box, and finally a squat jump. Note that all the jump tests are performed in a “modified” manner compared to some definitions as arm swing was not allowed – the athlete was instructed to keep their hands on their “hips” during the test. After reviewing the results of these tests, the patient would then continue to the remaining stations.
Quantification of the jumps
The jumps are examined for performance using two laboratory force plates (BMS600900-4K, AMTI, Watertown, MA, USA). Data were recorded with ForceDecks software (Version 2.0.8, Vald Performance, Newstead, Australia) at a frequency of 1000 Hz with concomitant kinematic examination using Inertial measurement units (Ultium Motion Sensors, Noraxon, USA) placed on the feet, shanks, thighs, and sacrum. After zeroing the plates, and weighing the athlete, each test or jump is first demonstrated, and then practiced by the participant. Note that the participant will have also been familiarized with the task as part of their normal rehabilitation prior to this testing. Once the participant has performed at least one practice jump to the satisfaction of the examiner and indicates they are ready for testing, the recording is commenced. The ForceDecks software automatically identifies jump types, along with a range of metrics. The jump-type identification is verified by the operator, along with the jump’s quality, with manual removal of any mis-identified, or poorly performed jumps (e.g. landing outside the force plates, arm swing, etc). Importantly, the athletes were instructed to jump and then keep their legs straight until landing to ensure the flight-time calculations weren’t manipulated by tucking their knees up – upon visual identification of this strategy the athlete was reminded of the jump instructions, and that jump was discarded.
Concomitant video analysis of jumps
Additional to the usual practice, video recording of the feet from the front of the patient performing these tasks was performed simultaneously (Figure 1) using an iPad Pro (at 240 frames per second, high-definition video resolution) for subsequent analyses using the “MyJump Lab Pro” application (Carlos Balsalobre-Fernández, version 2.1.1)
Briefly, a recording of a jump is loaded into the app then the take-off and landing frames are manually selected. Prior to the commencement of the research, standardized definitions of the start and end of the jumps were made. For take-off, the first frame where it was certain both feet were off the ground was selected – this required visual identification of a gap between the feet and the ground, accounting for any motion blur, with no deformation of the shoe. For landing, the first frame when it was certain one foot had landed was selected; this was described as the frame where there was no visible gap between the shoe and the ground, a lack of motion blur and deformation of the shoe. With these events defined, the application then calculates jump height through flight time as well as the RSI for drop-jumps. Typically, this offline analysis took approximately 12 minutes per participant depending on the number of jumps which needed to be assessed.
Statistical analysis was conducted in Excel (Office 365, Microsoft, USA), SPSS (version 24, IBM Corporation, USA), and JMP (v 16, SAS Institute Inc, USA). After initial exploratory data analysis including visualization, descriptive, veracity, and normality checks, an ICC (absolute agreement) was conducted from which the standard error of the measure and from which the minimum detectable change was calculated. Bland-Altman plots were generated to describe agreement and bias, and using a threshold of 90% for limb symmetry, confusion matrices and then test clinimetrics were then generated.
The experimental set-up is shown in Figure 1, and the entire ACL testing sequence is outlined in Figure 2.


RESULTS
Participant demographics are presented in Table 1.
All jump types demonstrated excellent reliability between repetitions (ICC>0.95) with minimum detectable change of approximately 1cm for jump height and approximately 0.1 for reactive strength index (Table 2). There was a systematic small bias across all measures suggesting that the MyJump app slightly underestimated both the jump height and reactive strength index compared to the reference force plate analysis (Table 2). Diagnostic accuracy was very good (>90%) when using a limb symmetry cut-off value of 90% for the involved (ACLR) leg compared to that individual’s uninvolved leg for both jump height, reactive strength index, flight, and contact times (Tables 3, 4, and 5).
DISCUSSION
The MyJump app performs well in correctly classifying patients using a limb symmetry index of 90% when measuring both jump height and reactive strength index. A clinician using this app will be correct approximately 90% of the time in classifying the patient as passing or failing this return to sport criterion when using the MyJump app (compared to the reference force plate analyses) using an LSI threshold of 90%. Of the 131 classifications made using the MyJump app, there were eight misclassifications - five false positives and three false negatives – all of these were in classification of jump height and there were no misclassifications of RSI.
The MyJump app is a valid method of measuring jump height and reactive strength index. Here we have consistently shown ICC values greater than 0.95 irrespective of jump type or metric. The minimum detectable differences were typically in the order of approximately 1cm for jump height, less than 0.1 for RSI, 0.07s for contact time, and 0.01s for flight time. Clinically, it can be inferred that changes in jump height, RSI, contact or flight time which exceed these values are attributable to changes in physical performance beyond measurement error.
There is greater knee work contribution during the propulsion phase (which determines performance) of vertical jumps compared to horizontal jumps.19 Therefore jump height better estimates knee work contribution than the easier to clinically measure jump distance.19 The ease of clinical use and low cost are likely primary reasons for the more widespread clinical adoption of jump distance despite it being a poor metric of knee function after ACLR.19,21 The significant price advantage of this app compared to the reference force plates and their software should increase clinical integration of this measurement and improve monitoring and may therefore improve outcomes for patients recovering from ACLR.
Complimentary to the performance metrics of jump height, RSI is seen to provide additional clinically relevant information regarding the performance ability of those recovering from ACLR surgery. RSI performance has been shown to be one of the last performance qualities to recover post ACLR compared to strength, jump height, jump distance and change of direction performance.10,14,22 In addition ongoing deficits have been demonstrated post ACLR despite the recovery of other jump performance metrics.14,16,22 Reactive strength has also been demonstrated to be lower in those that went on to rupture their healthy contralateral knee post ACLR despite no differences in other jump performance measures.22 Consequently the ongoing monitoring of RSI during drop jump testing is integral to assessing the athlete’s rehabilitation progress, return-to-play readiness, and re-injury risk post ACLR. Therefore, the excellent performance of the MyJump app in correctly classifying limb symmetry for RSI suggests that this may afford an important improvement in care for the great majority of practitioners who do not have access to force plates.
The current work extends previous research conducted in healthy cohorts.13,23–31 The small systematic bias across all metrics reported here has not been previously documented, although the reliability data are essentially the same as previously reported.13,23–31 Differences in hardware, software versions as well as the reference population and the user technique are possible sources of the bias first reported here. For example, using an earlier version of the MyJump app with an iPhone capturing at 120Hz (half the capture rate of the current research) the MyJump app was reported to slightly overestimate flight time compared to force plates capturing at 2000Hz13 (bias in the opposite direction to the present data). Care was taken in the current research to standardize the definition of the frames defining the start and end of the jump. Previous research had not specifically defined these events with objective criteria. Where comparisons against reference populations are being conducted (e.g. return to sport testing, pre-competition health evaluations) these differences should be considered however they should not be an important factor for within participant testing where limb symmetry is the primary outcome.
Force plates, with appropriate software, provide essentially instant results for the practitioner which is a consideration in the time-constrained world of standard clinical practice. The MyJump app, in practice, took approximately 12 minutes to analyze an entire set of six jumps for a typical participant. This may be a consideration in clinical practice where appointment time can be limited. The (financial) cost of the MyJump app, however, is vastly less expensive (currently USD $25) than force plates and their associated software licenses. It should be noted that with practice of approximately the first 100 trials the time taken for analyses on the MyJump app improved to less than 10 minutes per patient set of jumps.
In a total of 823 jumps, there were 26 errors (3%) using the MyJump app resulting in lost trials. For the same jumps there were no errors using the ForceDecks software. The systematic bias showing a slight underestimation of all parameters by the MyJump app in comparison to the force plate output suggests the accuracy may be further enhanced by either future software algorithm updates or simple end-user subtraction of these values.
LIMITATIONS
The current study was conducted on a consecutive clinical cohort in a laboratory environment on a cohort which was almost entirely male, and the footwear was self-selected. This may influence the generalizability of these data to other ACL cohorts, and indeed other injury cohorts seen in clinical practice where jump monitoring is of interest.
While the accuracy described (90%, or approximately one incorrect classification per 10 tests) appears superficially good, it remains to be seen if this is clinically acceptable. The consequences of incorrect classification – perhaps earlier resumption of ‘at risk’ activities for a rehabilitating athlete and potential reinjury need to be weighed and considered by the practitioner, and more generally with future research examining the predictive ability of these tests.
Three methods are described for measuring jump height – flight time, impulse momentum, and work-energy.32 Each approach has its strengths and weaknesses end users should be aware of when interpreting and comparing findings.32 Flight time is a proxy for jump height which requires a specific jump technique to be an accurate reflection of jump height. Specifically, the athlete must not pull their legs into flexion during the landing phase (which would artificially extend the flight time) and this must be monitored during testing, as was the case in the current research. It should be noted however that this monitoring was done visually discarding any such identified trials, however it is possible that some misidentified trials may have escaped this scrutiny.
CONCLUSION
The MyJump app is a valid method to estimate and classify vertical jump height and reactive strength index in clinical practice for participants recovering from ACLR. The minimum detectable change data (approximately 1cm for jump height and 0.1 for reactive strength index, irrespective of jump/hop type) presented here suggest that clinical progression can be determined with high sensitivity. The overall diagnostic classification accuracy (using a limb symmetry threshold of 90%) was over 90% for both jump height and reactive strength index.
Conflicts of interest
All the authors declare no conflict of interest perceived or otherwise in the production of this paper.