INTRODUCTION
Hamstring injuries are prevalent in football (soccer), a sport characterized by high-speed running.1 Previous study have shown that the incidence of hamstring injuries has doubled from 12% to 24% between 2001 and 2022.1 Additionally, more than 50% of athletes with prior hamstring injury experience a recurrence of hamstring injury within 25 days of returning to play.2 Considering that players typically resume full team training in approximately 20 days,3 it is imperative to not only prevent initial hamstring injury but also reduce the risk of recurrence for improved athletic performance in football.
The biceps femoris (BF) muscle is primarily affected during high-speed running, making it susceptible to hamstring injuries.4,5 Individuals with a history of hamstring injury often exhibit inhibited BF electromyography (EMG) activity during isokinetic knee flexion exercises.6–8 Notably, the reduction in BF EMG activity is particularly prominent at knee flexion angles of 15-35° (0° indicates a fully extended knee),6–8 which align with the angles at which hamstring injuries commonly occur.9,10 It has also been reported that isokinetic knee flexion training incorporating eccentric loading up to 20° knee flexion can effectively prevent recurrent hamstring injuries.11 Therefore, the implementation of knee flexion exercises that enhance BF EMG activity at angles of 15-35° might play a crucial role in preventing the recurrence of hamstring injuries.
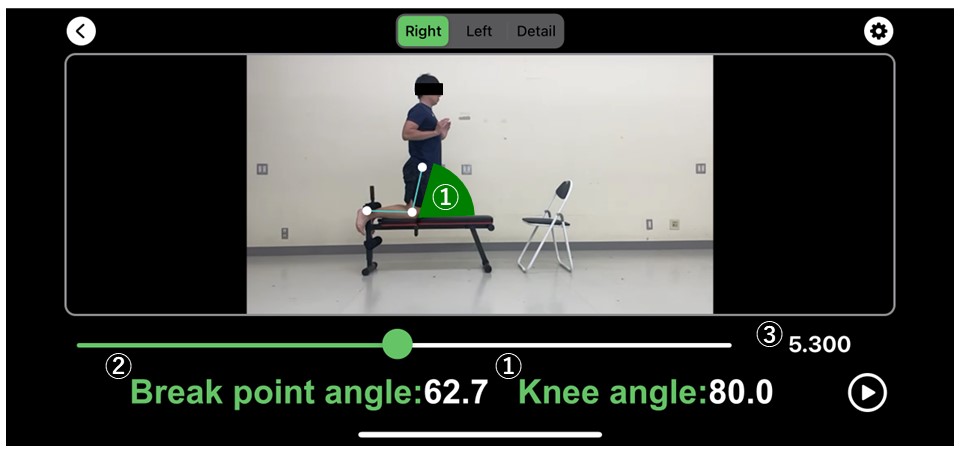
The Nordic hamstring exercise (NHE) is one such exercise used to improve eccentric knee flexion strength.12 It involves maintaining a straight posture from the knees to the head while leaning the upper body forward to a level that the hamstring muscles can tolerate. The knee flexion angle at which the knee flexor strength cannot resist the external knee flexion moment accompanying the forward leaning of the trunk is referred to as the break-point angle (BPA). Given that the BPA is approximately 50° even in trained soccer players,13 BF EMG activity at 15-35° knee flexion angle is likely diminished with standard NHE in many athletes.14–16
The recent development of a smartphone application (Nordic Angle) has introduced the automatic calculation of BPA, eliminating the need to import data to a personal computer. Although it has been reported that BF EMG activity peaks near the BPA and gradually diminishes afterward,16 the investigation of BF EMG activity before and after BPA, as calculated by the Nordic Angle, remains unexplored. If the BPA value obtained using the Nordic Angle determines whether BF EMG activity is enhanced at knee flexion angles of 15-35°, it could significantly benefit the field of sports medicine. Additionally, if the angle of the lower leg slope for NHE can be adjusted based on the BPA value calculated by the Nordic Angle, it may further optimize BF EMG activity at knee flexion angles of 15-35°.16,17
Therefore, the aim of this study was to investigate the BF EMG activity before and after BPA, as calculated using the Nordic Angle app. A secondary purpose was reassess the validity of the Nordic Angle app18 by comparing its BPA values with those obtained through motion analysis. The hypotheses were that BF EMG activity would peak near the BPA and gradually diminish afterward, and that the BPA calculated using the Nordic Angle would demonstrate high validity.
METHODS
Study Design
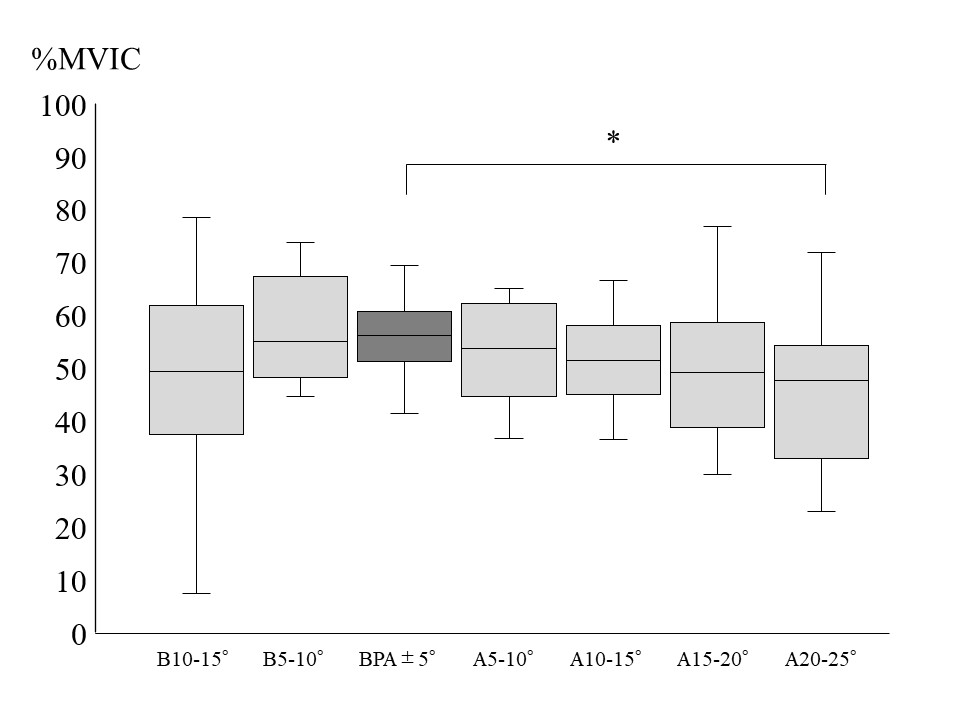
After a warm-up, the participants underwent three repetitions of the prone leg curl with maximum voluntary isometric contraction (MVIC). The peak value of BF EMG activity during the prone leg curl was used to convert the BF EMG activity during NHE to %MVIC. The participants then performed three NHE repetitions, which were recorded using an iPhone 12 high-speed camera. The BPA during NHE was calculated using two-dimensional motion analysis software and the Nordic Angle application (Figure 1). To quantify BF EMG activity before and after BPA, EMG and kinematic data from the motion analysis were synchronized. To compare BF EMG activity before and after BPA calculated by Nordic Angle, the knee flexion angle was divided into seven phases (10-15° before BPA, 5-10° before BPA, BPA ± 5°, 5-10° after BPA, 10-15° after BPA, 15-20° after BPA, and 20-25° after BPA), where 0° represented the fully extended position of the knee. The Friedman test was employed to compare the BF EMG activity in these seven phases. The validity of the Nordic Angle data was examined using the Pearson correlation coefficient test for consistency with the motion analysis data, and the agreement between these measurements was examined using the Bland-Altman analysis.

Participants
The sample size was calculated a priori based on Pearson’s correlation coefficient analysis (G*Power version 3.1, Heinrich Heine Universität, Düsseldorf, Germany). The input parameters (correlation ρ H1 = 0.75, alpha = 0.05, and power = 0.8) were set with reference to the effect size of a previous study.18 This setting resulted in a sample size of 11 participants. Therefore, 13 male volunteers majoring in sports science (age, 25.2 ± 2.6 years; height, 174.3 ± 5.1 cm; and body mass, 70.5 ± 8.2 kg; all measured in mean ± standard deviation [SD]) participated in this study. Inclusion criteria included healthy males aged of 18-35 years engaged in sports activities without musculoskeletal pain, while the exclusion criterion was the inability to perform NHE due to lower extremity injury. The experimental protocol was approved by the institutional review board of Waseda University’s ethical committee (approval number: 2022-531), and all procedures adhered to the principles of the Declaration of Helsinki. Informed consent was obtained from all participants after providing them with detailed information about the study.
Procedures
Participants performed a warm-up comprising light aerobic activity (2 min of alternating stepping on a 15-cm high box), a 15-second static hamstring stretch (standing hamstring stretch on one leg), and 1 set of 10 repetitions of dynamic hamstring stretching (forward leg swing). Hamstring stretching was performed on both legs. After the warm-up, surface EMG electrodes were attached to the BF of the right leg, and participants completed three repetitions of the prone leg curl with MVIC. The knee flexion angle during the prone leg curl was 30° and was performed against manual resistance.19 EMG measurements were performed with reference to “Standards for Reporting EMG Data”.20 The examiner instructed the participants to reach maximal effort for 2 s and then maintain it for 2 s in each MVIC.21 There was at least 1 min of rest between each MVIC trial. The participants then performed three NHE trials with two additional familiarized repetitions before the trials. There was at least 2 min of rest between each NHE trial. The experiment was conducted under the supervision of a National Strength and Conditioning Association Certified Strength and Conditioning Specialist.
Nordic Hamstring Exercise
Participants assumed a kneeling position on a bench of approximately 50 cm, with their elbows bent and hands open in front of them (Figure 1). They were instructed to lean forward slowly while maintaining a straight posture from the knee to the head. A certified examiner ensured correct execution of the NHE.
Electromyography
The EMG signal was sampled at 1000 Hz and bandpass-filtered (10-450 Hz) using a wireless telemetry and surface EMG silver electrodes (DL-5000 with m-Biolog2; S&ME Inc., Tokyo, Japan). The electrode had a bar length of 1 cm, bar width of 0.1 cm, and distance of 1 cm between the recording sites. The participants’ skin was shaved the hair around the target site and cleaned using cotton dampened with alcohol to reduce noise. BF electrode placement was midpoint between the ischial tuberosity and the lateral condyle of the tibia.22 Participants were verbally encouraged to ensure maximal effort. Peak EMG activity during the prone leg curl and NHE was calculated based on the peak root mean square (RMS) value. The RMS value was computed for a 100 ms window.
Two-dimensional Motion Analysis
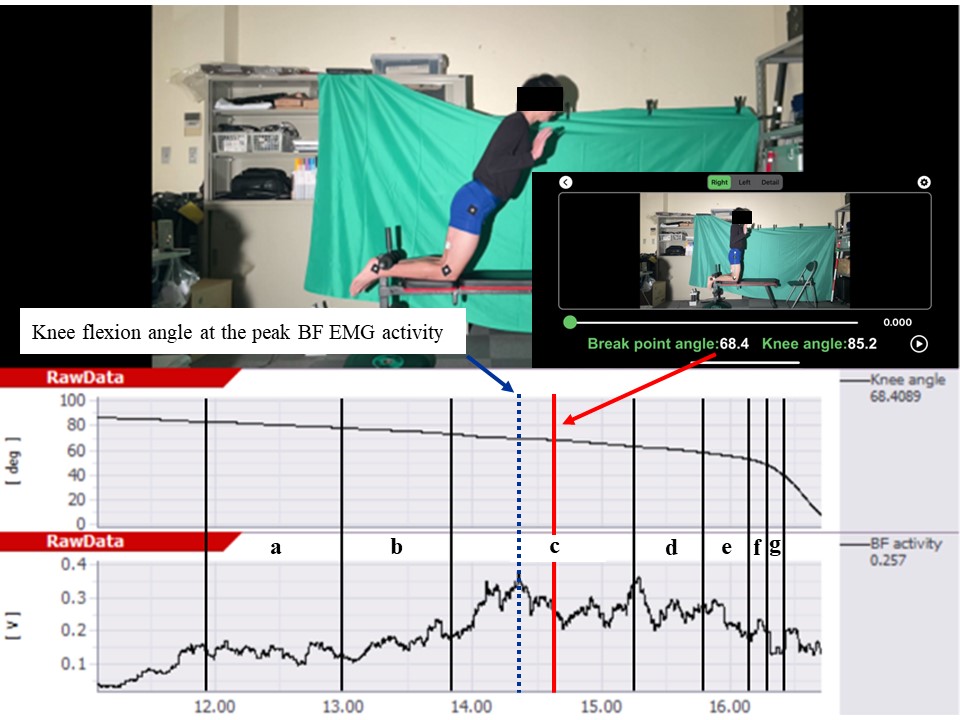
The iPhone 12 camera was set to 240 fps, and the camera was positioned approximately 3 m from the right side of the participants at a height of approximately 0.9 m. After transferring the recorded movie to a personal computer, two-dimensional motion analysis was performed using motion analysis software (Frame-DIAS V; DKH Inc., Tokyo, Japan). Reflective markers were attached to the greater trochanter, lateral epicondyle of the femur, and the lateral malleolus to calculate the knee flexion angle through digitization. The knee flexion angle was defined as an anatomical angle with a value of 0°, indicating full knee extension. In addition, the knee extension angular velocity was calculated based on the knee flexion angle and time.18
Data Analysis
Kinematic data obtained through motion analysis were smoothed using a Butterworth low-pass filter with a cut-off frequency of 6 Hz. BPA for two-dimensional motion analysis was defined as the knee flexion angle at which the knee extension angular velocity exceeded 30°/s.18 The average BPA values from the motion analysis and the Nordic Angle were calculated from the BPA values of the three NHE trials.
To calculate the knee flexion angle at the peak BF EMG activity, BF EMG activity and knee flexion were synchronized using a trigger mechanism with a synchronization lamp (TRIAS; DKH Inc., Tokyo, Japan) (Figure 2). To assess the BF EMG activity before and after BPA calculated using the Nordic Angle, the knee flexion angle was divided into seven phases (Figure 2). The average BF EMG activity in the seven phases before and after the BPA was calculated from the BF EMG activity values of the three NHE trials.

Statistical Analysis
Values are expressed as mean ± SD. The Shapiro–Wilk test was used to assess normality. Normality was confirmed for BPA calculated by both Nordic Angle and motion analyses, whereas normality was not confirmed for one of the BF EMG activities in the seven knee flexion angle ranges. Differences in BF EMG activity in seven phases (10-15° before BPA, 15-10° before BPA, BPA ± 5°, 5-10° after BPA, 10-15° after BPA, 15-20° after BPA, 20-25° after BPA) before and after BPA were compared using Friedman test. The paired t-test was performed to confirm the difference in BPA calculated by the Nordic Angle and the knee flexion angle at peak BF EMG activity. Cohen’s d was classified based on the following effect size criteria: trivial, <0.2; small, 0.2 to 0.49; medium, 0.5 to 0.79; and large, >0.8. The validity of the Nordic Angle data was examined using the Pearson correlation test for consistency with the motion analysis data. The magnitude of the correlation was established based on the following criteria: rs = 1, perfect correlation; 1 ≥ r ≥ 0.9, nearly perfect; 0.9 ≥ r ≥ 0.7, very large; 0.7 ≥ r ≥ 0.5, large; 0.5 ≥ r ≥ 0.3, moderate; 0.3 ≥ r ≥ 0.1, small; and 0.1 ≤ r, trivial. The agreement between the Nordic Angle and motion analysis was examined using the Bland-Altman analysis. The paired t-test was performed to confirm the difference in BPA between the Nordic Angle and motion analysis data. The limits of agreement in the Bland-Altman analysis were calculated by multiplying SD by ±1.96.23 Statistical analyses were performed using SPSS version 29 (IBM SPSS, Armonk, NY, USA). The significance level was set at p < 0.05.
RESULTS
The BF EMG activity in seven phases before and after break-point angle
The BPA values of the Nordic Angle and knee flexion angle at the peak BF EMG activity were 61.6 ± 10.7° and 62.9 ± 9.9°, respectively, with no significant difference observed between the two (d = 0.13, p = 0.678).
Figure 3 shows the BF EMG activity magnitude before and after BPA, as calculated using the Nordic Angle. The BF EMG activity at 20-25° after BPA was significantly lower than at BPA ± 5° (d = 0.87, p = 0.011).

The Validity of the Nordic Angle
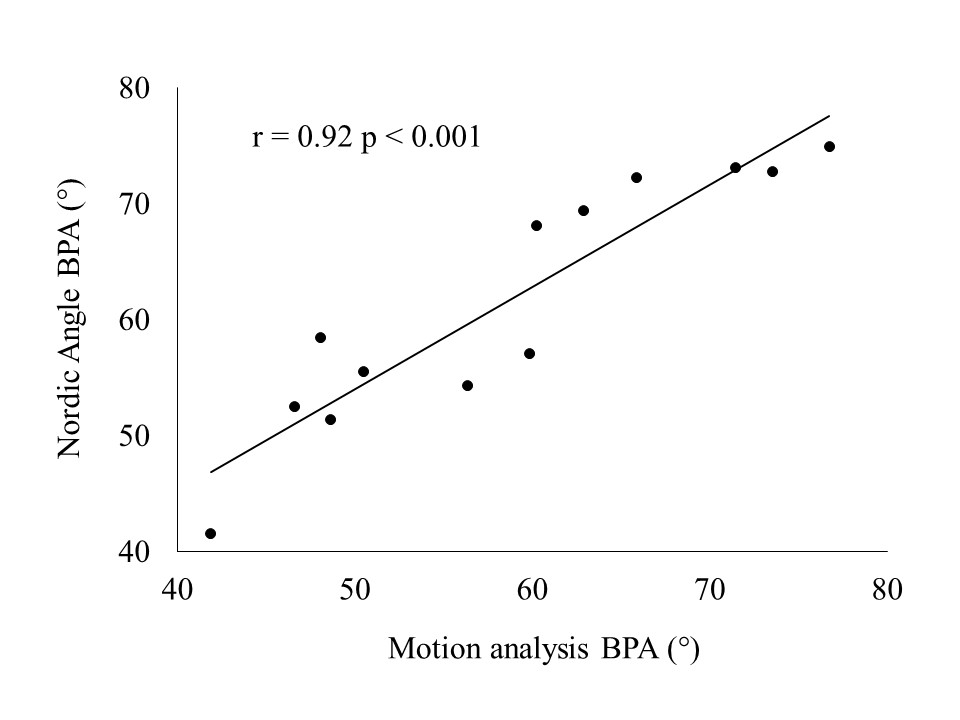
Figure 4 shows the correlation between the BPA of the Nordic Angle and the motion analysis. The Pearson correlation between the Nordic angle and the angle determined using motion analysis was nearly perfect (r = 0.92, p < 0.001).

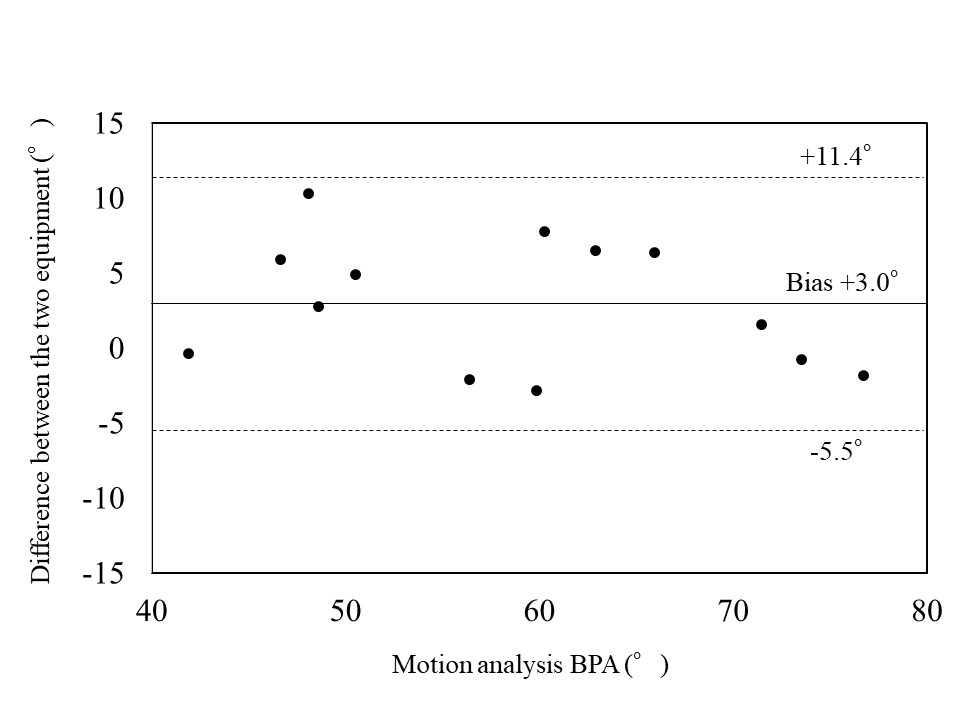
Figure 5 shows the agreement between the BPA of the Nordic Angle and motion analysis. The BPAs obtained from the Nordic Angle and motion analysis were 61.6 ± 10.7° and 58.7 ± 11.2°, respectively, indicating a significant difference between the two datasets (d = 0.27, p = 0.029). The mean difference between the Nordic Angle and motion analysis values was 3.0 ± 4.3°, with the limits of agreement ranging from -5.5° to 11.4°.

DISCUSSION
The investigation of BF EMG activity before and after BPA, as calculated by the Nordic Angle, remains unexplored. In addition, there is no verification of the validity of Nordic Angle. Therefore, this study aimed to investigate the BF EMG activity before and after BPA, calculated using the Nordic Angle. In addition, it sought to re-examine the validity of the Nordic Angle by comparing the BPA values with motion analysis. The main outcomes are as follows: (a) No significant difference between the BPA of Nordic Angle and knee flexion angle at the peak BF EMG activity (d = 0.13, p = 0.678); (b) TheBF EMG activity at 20-25° after BPA was significantly lower than the BF EMG activity at BPA ± 5° (d = 0.87, p = 0.011); (c) The Pearson correlation between the Nordic angle and the angle determined using motion analysis was perfect (r = 0.92, p < 0.001); (d) A significant difference between mean BPA values of the Nordic Angle and motion analysis was 3.0 ± 4.3° (d = 0.27, p = 0.029), and the limits of agreement ranged from -5.5 to 11.4 showing there was no statistical difference and good agreement between the two methods of measurement. These results supported the hypothesis.
Specifically, there was no significant difference between the BPA calculated using the Nordic Angle and the knee flexion angle at peak BF EMG activity (d = 0.13, p = 0.678), indicating that BF EMG activity peaked near the BPA. In addition, the BF EMG activity at 20-25° after BPA was significantly lower than that at BPA ± 5° (d = 0.87, p = 0.011) (Figure 3). This suggests that high BF EMG activity is maintained up to 20° after BPA, but it significantly decreases beyond 20° of BPA as calculated by the Nordic Angle. Soga et al. investigated the magnitude of BF EMG activity before and after BPA calculated by motion analysis during NHE variations with different lower leg slope angles.16 They reported that BF EMG activity peaks near the BPA during NHE variations with 20° or 40° lower leg slope, and decreases toward the shallow knee flexion position during NHE variations with 0° lower leg slope (similar to standard NHE). The results of this study support these findings, emphasizing the importance of knee flexion exercises that enhance BF EMG activity at 15-35° knee flexion to effectively prevent recurrent hamstring injuries, the BPA of the Nordic Angle should be kept within 35° to be effective in preventing recurrent hamstring injuries with standard NHE. Since the BPA is approximately 50° even for trained soccer players,13 incorporating lower leg slope assistance during NHE might be necessary to enhance its efficacy in preventing hamstring injuries in many athletes. The BPA changes proportionally with the angle of the lower leg slope,16,17 so if the Nordic Angle calculates a BPA of 75°, setting the lower leg slope angle to 40° would theoretically result in a BPA of 35°.
This study also assessed the validity of the Nordic Angle’s BPA determination. The findings confirmed a nearly perfect correlation between the BPA of the Nordic Angle and the BPA determined by motion analysis (r = 0.92, p < 0.001) (Figure 4). Comparatively, a previous study by Soga et al. using similar methodology did not achieve statistical significance in Spearman correlation (p = 0.052),18 but reported a very large correlation (rs = 0.75). They attributed the lack of significant differences to a small sample size (n = 7). In contrast, the current study with a larger sample size (n = 13) revealed a nearly perfect correlation, demonstrating that the Nordic Angle not only exhibits perfect reliability18 but also has high validity.
The results of this study revealed a significant difference between the mean BPA values of the Nordic Angle and motion analysis, amounting to 3.0 ± 4.3° (d = 0.27, p = 0.029), with the limits of agreement ranging from -5.5° to 11.4° (Figure 5). These findings slightly differ from those of a previous study conducted by Soga et al., who compared the mean BPA of the Nordic Angle with the BPA of motion analysis using a methodology similar to that applied in this study. Their reported difference between the BPA of the Nordic Angle and motion analysis was 0.4 ± 2.1°, which was not significantly significant. This discrepancy in results might be partly attributed to the different digitization locations used in the two studies. In the previous study, the knee flexion angle was calculated by digitizing the greater trochanter, center of the knee joint, and lateral malleolus, whereas in this study, it was calculated by digitizing greater trochanter, lateral epicondyle of the femur, and lateral malleolus. Although this variation might be responsible for the observed significant difference in BPA values, the small discrepancy of approximately 3° (d = 0.27, p = 0.029) is not a major concern. Furthermore, Soga et al. reported that the limits of agreement ranged from -3.9° to 4.6°18 in their previous study,18 whereas in the present study, the limits of agreement were wider. This disparity in results could be attributed to the number of NHE trials conducted, with the previous study utilizing 12 trials, while the current study employed only three trials. It is likely that the variation in the number of trials affected the measurement precision. Therefore, it is recommended to perform BPA measurements using the Nordic Angle with at least 5 trials and calculate the average for improved accuracy.
This study has four limitations. First, the measurement method was limited to a two-dimensional motion analysis. It is crucial for future research to examine the validity of three-dimensional motion analysis to enhance the comprehensiveness of findings. Second, the data collected from repeated trials within a single day hindered the ability to draw conclusions about inter-session testing. Third, because the EMG electrodes were placed without the use of ultrasound etc., there may have been some crosstalk with other hamstring muscles. Finally, the age of the participants was 25.2 ± 2.6 years. This limits the generalizability of the findings of this study.
CONCLUSIONS
The results of this study indicate that BF EMG activity at 20-25° after BPA was significantly lower than at BPA ± 5° (d = 0.87, p = 0.011) and that there were no significant differences between BPA angles measured by the Nordic app and knee flexion angle at the peak BF EMG activity, and the correlations between these measures were nearly perfect. However, the mean difference between the Nordic Angle and motion analysis values was 3.0 ± 4.3°, with the limits of agreement ranging from -5.5° to 11.4°.
ACKNOWLEDGMENTS
The authors would like to acknowledge the Graduate School of Sport Sciences, Waseda University for the valuable support and assistance provided throughout this study. The datasets generated during and/or analyzed during the current study are not publicly available but are available from the corresponding author, who was involved in organizing the study. This work was supported by both JST SPRING (Grant Number: JPMJSP2128) and JSPS KAKENHI (Grant Number: JP23KJ1988).
Conflict of interest declaration
Nordic Angle is a smartphone application developed in collaboration with S-CADE. Co., Ltd. and Athletic Training Laboratory at Waseda University (instructed by Professor Norikazu Hirose). The first author of the article collected and analyzed the data. However, the authors of the current study assert no conflicts as they do not receive any fees from S-CADE. Co., Ltd. for developing the Nordic Angle, and the installation of the Nordic Angle app is free.