INTRODUCTION
Soccer activity leads to significant amounts of lower extremity injury,1 pain, and delayed onset muscle soreness (DOMS).2 Despite these negative aspects of training, consistent and appropriately prescribed training will also create positive adaptations to enhance sport performance.3 To minimize the negative aspects of training, clinicians have begun relying on wearable devices to capture internal and external training loads.4–7 These measures aid in predicting injury1,6–8 and performance capabilities,5 in addition to having impacts on athlete wellness measures.9–11 Tracking training loads is now extremely clinically feasible,4,12,13 however, there are numerous methods of tracking training loads, such as global positioning systems,10,12,14 heart rate monitors,6,15,16 and accelerometers.12 Additionally, these devices create many different training load outcome measures,8 such as heart rate, distances, velocities, accelerations, and all the banded derivatives of these measures, such as heart rate zones, speed zones, or acceleration intensities.17,18 These different combinations may cause confusion among sport stakeholders on which measures may be most beneficial to ensure their athletes are training and competing without excessively overloading tissue(s).14
By tracking training loads, sport stakeholders aim to identify the early development of injury and create data informed rest and recovery decisions. After training and competition, athletes experience decreased lower extremity force production,19,20 altered mental state,9,10 and increased reports of pain and DOMS.21 With appropriate rest and recovery, the body returns to homeostasis,2,19,21 eventually making positive adaptations that contribute to an athletes injury resilience.3 However, in competitive sport with high competition demand, such as American collegiate athletics, athletes often partake in high intensity activities before the body has completely recovered. Participating in competition or training with negative changes present may create additional muscular stress and trauma,22–24 culminating in an athlete who must remove themselves from play due to inability to compete without pain and/or dysfunction. Additionally, significant muscular stress and trauma could lead to lower force and power output and altered movement biomechanics,25 thus placing collegiate athletes at further risk for lower extremity injury.26 Therefore, it would be imperative to measure the dose of activity, via training load outcomes,27 and pair it with the response to activity, such as strength,21 wellness variables,9,10 or musculoskeletal DOMS.2,28,29 Delayed onset muscle soreness and force production demonstrate similar negative changes after activity2,30,31 for up to 72 hours after strenuous exercise,2,30,32 so DOMS could be used as an indicator of muscle stress, trauma, and fatigue. Since DOMS can reflect the fatigue and underlying structural changes, then it may also provide insight into alterations in strength output and movement biomechanics,25 which place collegiate athletes at risk for lower extremity injury.26
Sport stakeholders are looking for training load collection methods and measurements that will accurately reflect the response to activity. However, there is no consensus on which training load measure best predicts the positive and negative aspects of training. Research points to high-speed distance as one of the best predictors of acute and residual fatigue17 after soccer matches, and other research indicates that subjective measures, such as rating of perceived exertion, may be most beneficial for injury development.8 Training load measures should be able to predict day-to-day changes of musculoskeletal health regardless of whether they are based around a match. If training loads alter musculoskeletal health and subsequently lead to injury, then they should also predict day-to-day changes in musculoskeletal stress and trauma measures. With this information and the appropriate training load measure, stakeholders will create optimal training programs to optimize athlete health, wellness, and performance. Therefore, the purpose of this study was to determine the predictive capabilities of training load variables on the development of lower extremity DOMS in female collegiate soccer athletes throughout an entire season. It is hypothesized that the number of decelerations and high-speed distance will best predict future lower extremity DOMS after accounting for the current day’s DOMS and intraindividual effects.
MATERIALS AND METHODS
To answer the research question, a prospective research design was created to track an athlete’s daily lower extremity DOMS and training load throughout an entire competitive collegiate soccer season. Participants were sent a custom smartphone enabled survey to log DOMS location and intensity throughout the season. In the current study, DOMS was operationally defined as the self-reported soreness or pain experienced by the participants. Participants were asked to log their DOMS on all days during the competitive season. The raw DOMS data was collected and reported to the soccer coaches, athletic trainer, and strength coach daily for use within the team. Training load was tracked with a wearable sensor which incorporated global positioning systems (GPS), accelerometers, and a heart rate monitor to derive many different training load measures.
After institutional approval, participants were recruited from the active members of the university’s female soccer team. To be included, participants had to participate in team functions, have access to a smartphone, and be able to wear a training load tracking device during all on-field team activities. Participants were excluded if they did not participate in team on-field training. Twenty-seven collegiate female soccer athletes (age: 20.6 ± 1.4 years, height: 168.2 ± 5.2, mass: 67.8 ± 7.2) participated in the current study. After signing consent forms from the university IRB, participants were sent a DOMS tracking survey and assigned a wearable load tracking sensor.
Soreness Collection
A custom smartphone enabled survey was created and distributed to each team member. At preseason testing times, participants were instructed to upload the survey as an application on their smartphone, so they were able to complete the survey each day. The survey collected measures of readiness, fatigue, stress, sleep quality and DOMS. For DOMS, participants were first asked “Are you experiencing any soreness or pain today?”. If the participant selected “No”, then the survey was completed. If the participant selected “Yes”, the participant was shown a body map with outlined areas corresponding to specific body regions.33 Participants would place a marker at a specific body location, indicating that they were actively experiencing DOMS at this location. Participants could place up to 10 different markers. After placing a marker in a specific region, participants would then rate their overall DOMS in that region from 1 to 10, with 1 representing mild DOMS, and 10 representing severe DOMS/pain. If the participants responded to the initial DOMS question with “No”, or if the participant did not place a marker in a specific body region, the DOMS intensity rating was set as 0.
To attain lower extremity specific DOMS level, all lower extremity body regions’ DOMS intensity was summed. The specific body regions included the posterior glutes, posterior thigh/hamstrings, anterior thigh/quadriceps, anterior and posterior knee, posterior lower leg/calf, anterior and posterior ankle, anterior and posterior foot, anterior and posterior hip, and anterior lower leg/shin, and the athletes could select a region on either or both sides of the body. These regions were selected as body regions of interest based on the expertise of the authors and based on feedback from the team of sports medicine professionals. The body map which was used was validated and demonstrates high levels of reliability for reporting pain (ICC = 0.93).33 Since the participants could place up to 10 different locations of pain, and at each location the participant could indicate up to 10/10 soreness intensity, the overall scale of the DOMS outcome measure could be between 0-100.
Training load Collection
Each day during on-field soccer activities, participants wore a chest-mounted training load monitor via a elastic strap (Team Polar Pro, Polar Electro Oy, Kempele, Finland). The training load monitor incorporates a heart rate monitor, accelerometer, and GPS that is attached to a monitoring strap placed immediately beneath the xiphoid process of the sternum. To begin the training, participants were told to clip the training load monitor into their strap. The team’s athletic trainer would monitor the on-field activity and set the start and stop time. The entire session was collected, and all training load measures were captured and reported between the start and stop time. The training load data was viewable on a team issued tablet and, on a cloud-based service. The data were extracted from the cloud-based service at the end of the year and used for the current project. Specific training load data that was used is listed in Table 1.
Data Reduction and Statistical Analyses
Data were reduced into daily values. Lower extremity DOMS information was taken from the daily surveys and synchronized with training load data. In instances where athletes reported the daily wellness survey twice, the average of lower extremity DOMS was used. It was expected that the training load variables would impact the future DOMS, so the next day’s lower extremity DOMS score was synchronized with the current day’s training load variables and the current day’s DOMS. With this data in place, a raw change score was calculated between the current day’s DOMS and the following day’s DOMS (Post – Pre). On days where the participants did not have training or they did not wear their training load monitor, the data row was removed due to the absence of data. Overall survey compliance was calculated as the total number of responses divided by the total number of player days from the start of the year to the end of the year. Outliers were assessed and removed if they were deemed extreme (> 3 standard deviations from the mean). To assess the correlation between team DOMS and the team’s daily training load, data were reduced into average daily values for all training load and lower extremity DOMS scores. Separate Pearson correlation coefficients were performed to assess the relationship between each training load measure and the raw change in DOMS between today and tomorrow’s DOMS. To assess the predictive capabilities of training load measures on individual level DOMS, separate linear mixed models were used with the following day’s lower extremity DOMS score as the outcome measure, the current day’s lower extremity DOMS score and each training load variable as a fixed factor along with an interaction term between the current day’s DOMS score and the training load variable. To account for the individual level variance that often comes with subjective repeated measures data, participant was used as a random intercept to allow for the differences in DOMS interpretation. To ensure that the training load measures significantly contributed to the overall model, a model with only the current day’s DOMS and the random intercept was created to compare to the training load model. Comparisons were performed with a chi-square test. If significant (p<0.05), the chi-square test would indicate that the training load model contributed to the overall amount of variance better than the raw DOMS only model. To attain the level of variance predicted by the models, both the conditional and marginal R2 values were calculated. The conditional R2 represents the amount of variance predicted by both the fixed and the random factors, while the marginal R2 represents the amount of variance predicted by the fixed factors alone. All analyses were performed in the R coding language and analyses were deemed significant at p<0.05.
RESULTS
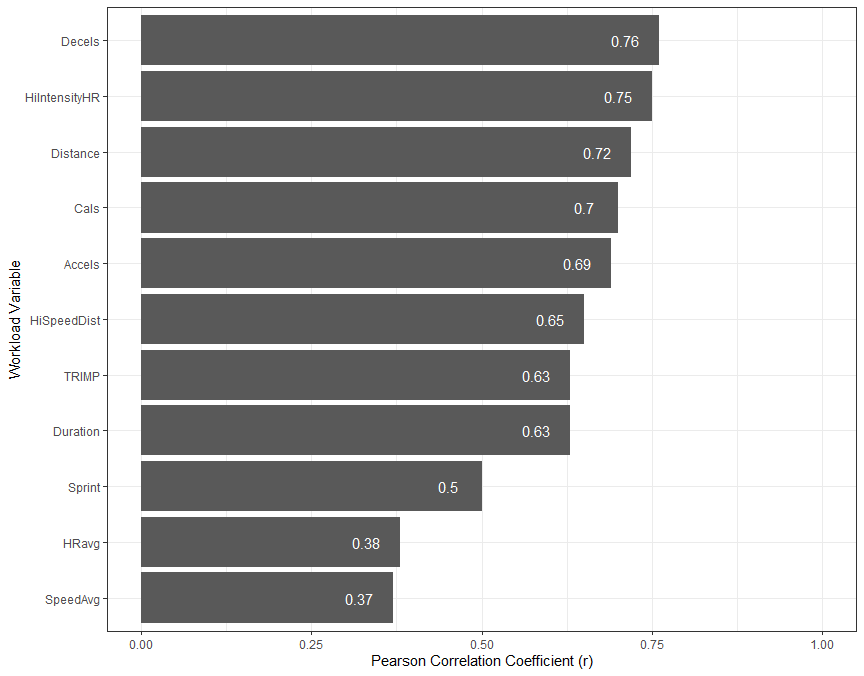
The average daily athlete wellness survey compliance was 84.2%, ranging from 47.5% to 98.8%. During data analysis, it was evidence that participants’ compliance was lower than normal on off days, so when removing off days from the dataset, the daily athlete wellness survey compliance was 91%. Descriptive statistics for the training load measures are presented in Table 2. Pearson correlation coefficients indicated that all training load variables were significantly associated with the raw change in DOMS (p<0.05). The training load variables that best predicted the DOMS change were number of decelerations (R2 = 0.58), high intensity heart rate minutes (R2 = 0.56), total distance (R2 =0.51), and calories expended during training (R2 = 0.49). Figure 1 shows the Pearson correlation coefficients of all training load variables.

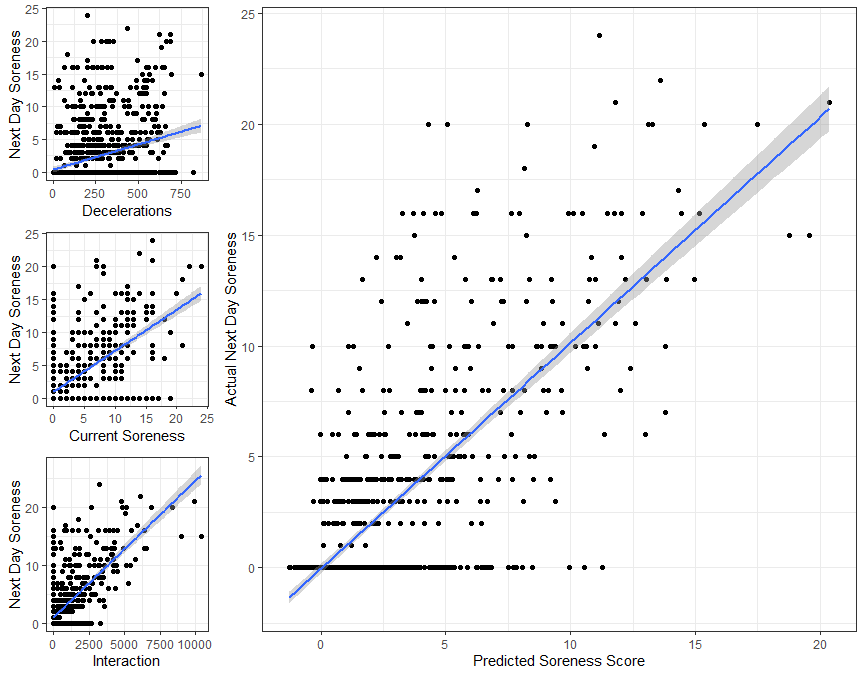
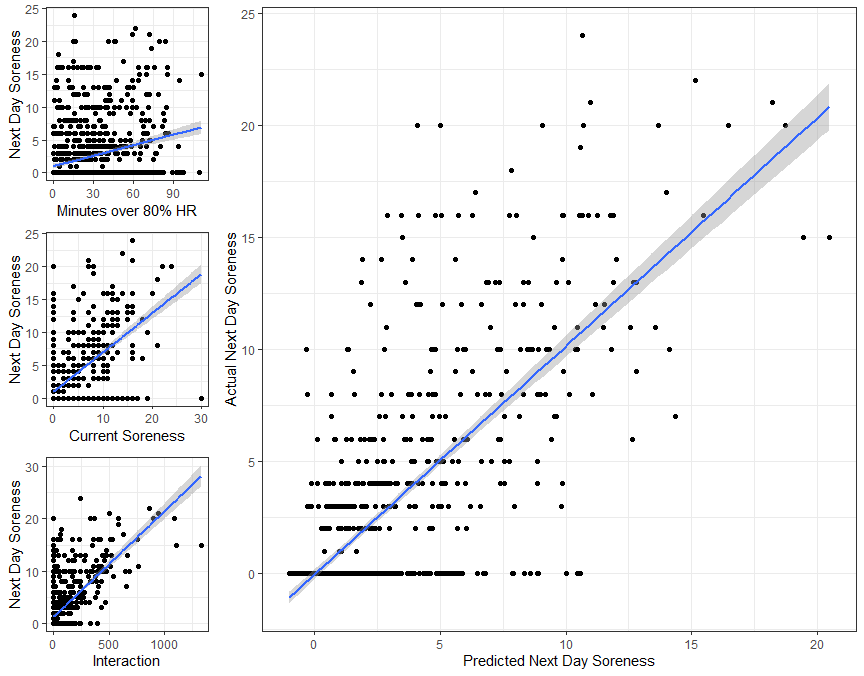
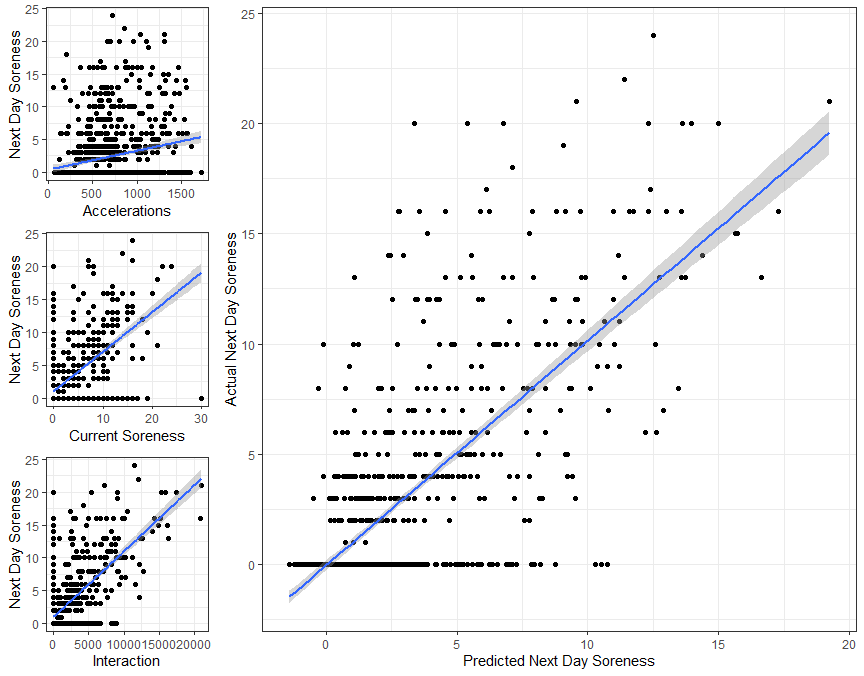
The linear mixed models demonstrated that all training load variables predicted the following day’s DOMS. Table 3 indicates the models and their impact on future DOMS. The training load variables that best predicted future DOMS were the number of decelerations (conditional R2 = 0.45, marginal R2 = 0.32, Figure 2), the number of minutes spent at high intensity heart rates (conditional R2 = 0.45, marginal R2 = 0.30, Figure 3), and the number of accelerations (conditional R2 = 0.43, marginal R2 = 0.27 Figure 4). The Chi-Square test revealed that the models with the training load variable and the interaction term fit the data better than the raw DOMS model (p<0.001).


DISCUSSION
This study aimed to investigate the predictive capability of different training load variables on future DOMS in collegiate female soccer athletes. The results indicated that the number of decelerations, number of minutes spent at high intensity heart rates, and the number of accelerations best predicted future DOMS, after accounting for the current day’s DOMS. Additionally, all the training load models added additional variance when compared to models that had DOMS only. All the training load variables predicted future DOMS, so clinicians should have confidence in utilizing training load variables in tandem with current DOMS to predict future DOMS. If sport stakeholders are interested in finding the best options to monitor DOMS, they should consider the utilization of wearable devices that incorporate decelerations, accelerations, and minutes at high heart rates.
Training load monitors have become increasingly prevalent in the field of athletics due to their ability to assist in determining injury risk,7,8,12,28 performance changes,5 and wellness alterations.7,11 Windt and Gabbett aimed to create a framework for injury development by incorporating training load variables, and describing both positive and negative aspects of training. One of the primary negative components of sport participation is DOMS. Delayed onset muscle soreness is likely the result of muscle stress and trauma, as there is significant overlap in DOMS and other stress and trauma indicators, such as decreased strength,30,31 alterations to histological markers,31,32,35 and gross structural change.36 Significant muscular stress and trauma could lead to alterations in strength output and movement biomechanics,25 thus placing collegiate athletes at risk for lower extremity injury.26 The current study demonstrates that DOMS is affected significantly by the training load that is experienced by the athletes. Specifically, the number of decelerations over 2.0 m/s2 is primarily driving the amount of DOMS that the athlete experiences the following day.
Decelerations are whole body eccentric movements, and there is a substantial amount of literature indicating that eccentric muscle activity affects DOMS.30–32,37–39 Chapman et al.32 showed that high velocity eccentric contractions led to higher DOMS, higher creatine kinase levels, and larger decrements to muscle strength than slow velocity contractions in a controlled laboratory setting. In the current study, we demonstrated that the whole body decelerations were predictive of future soreness, thus translating Chapman’s work into a sport setting. Monitoring and tracking DOMS would be beneficial for sport stakeholders, including sports medicine professionals, strength and conditioning coaches, and sport coaches. When paired with a training load monitor, stakeholders could use this data in combination for practice planning, rehabilitation, and strength programming to appropriately load athletes and reduce negative aspects of trainings around important dates, such as competitions.
Training loads can be captured with many different methods, including global positioning units,10,12,14 accelerometers,12 heart rate monitors,6,15,16 and subjective surveys.4 Anecdotally, some training load monitoring devices will create exports with over 200 columns of information. With so much information, it can be tough to navigate training load measures to create usable conclusions from the data. However, recent recommendations indicate that training load should be viewed as a dose of activity, and a response variable should be used to determine the effect of the dose, as is done in medical and epidemiological research.3,27 If training load acts as the dose of sport, then in the current study, DOMS acts as a response variable to understand which of the doses is best predicting the response variable. The number of decelerations, number of high intensity heart rates, and number of accelerations best predicted DOMS. Sport stakeholders who are searching for training load monitoring systems may want to ensure that these variables are included in the system prior to purchase and application.
It is important to note that all of the training load variables significantly predicted next day soreness to some degree, but the number of decelerations accounted for up to 15% more variance than other training load variables. Previous literature has emphasized using training load measures such as total distance and high-speed distance with soccer athletes,18,21 but in the current study, the total number of decelerations accounted for 8% and 12% more variance, respectively. This is the first study to identify decelerations as the best predictor of athlete soreness, potentially due to the innovative measurement of soreness. If put into practice, clinicians would have more confidence using number of decelerations to predict future soreness rather than distance or accelerations, as these may be better suited to view long-term for injury risk reduction. The current study did not include more than one training load variable in each model, as there was significant amount of collinearity between the training load variables. Future research that uses models robust enough to deal with high collinearity could provide even more predictive power, such that future soreness could be predicted and mitigated through thoughtful scheduling and program creation.
Training load measures are often thought of as either external9,10,17,40 or internal.9,40,41 External loads are primarily the work that is being performed, such as distance, accelerations, or duration. Internal loads are perceptual or physiological measures that correspond to the external load being performed, and these are often measured as rating of perceived exertion, heart rate, or training impulse. In the current study, both internal and external measures of load were significantly associated with the following day’s DOMS. Both external load measures and internal load measures could be used to predict future soreness, so clinicians should feel comfortable selecting training load monitoring methods that capture any training load measure.
Although clinicians should use internal and external load measures, they should also use a response variable to determine the impact of that training load. Response variables provide key context for clinicians to identify athletes who are struggling or thriving. Previous authors have used force plate assessments,20 strength measurements,19,42,43 wellness surveys,9,10 or heart rate variability16 to determine fatigue status of athletes. The current study collected DOMS via a smartphone enabled survey with a body map that has established reliability and validity.33 This method is cost-effective, easy to implement, and could aid both sports medicine clinicians and strength and conditioning coaches to ensure that athletes are not being overloaded. Clinicians could also use this method over time to track return to play and use data driven decision making to prescribe future load. Future research should track other objective measures of fatigue to identify if training load predicts these measures in the same fashion that training load predicts DOMS. Additionally, the DOMS collection method in this study could be useful for many other research projects where repeated measures or return to play are being investigated.
This study is not without limitations. Training load measures were not collected during strength training sessions where additional load may have been accumulated. The load is likely to be consistent across athletes, except for internal load measures of heart rate indices, so future research should incorporate strength training sessions into the training load calculations. It was assumed that athletes were honest in their responses regarding lower extremity DOMS. The data were collected and reported back to the sport staff, so athletes may have altered the truth to look good for the staff. Prior to the beginning of the study, honesty was emphasized to the participants, and the coaching staff was educated on appropriate responses to the wellness survey. Additionally, although questions were asked about DOMS and athletes were instructed on the difference between DOMS and other sources of pain, the DOMS outcome scores could have come from another source, such as overuse injury or direct contact that does not require removal from sport. Finally, the training load data were significantly correlated, so data was modeled with one training load variable at a time. Although future projects intend to analyze the data with more robust models to gain greater predictive capability, the authors elected to move forward with a single training load variable in each model.
CONCLUSIONS
The results of the current study demonstrate that training load measures significantly predicted lower extremity DOMS in collegiate female soccer athletes. The strongest predictors were the number of declarations, number of minutes spent at high heart rate, and number of accelerations. Clinicians who work with female soccer players should consider training load monitoring methods that collect these training load variables. Additionally, when high number of decelerations, minutes spent at high heart rates, and number of accelerations are present within a practice, the sport staff should expect higher lower extremity soreness in the following days. Future research should use similar methods to determine if training load variables can predict changes in objective fatigue measures in a similar fashion to the current study.
COI Statement
This study was funded in part by a National Athletic Trainers Association New Investigator’s Grant (#2021NIP01). The authors have no other conflicts to disclose.