INTRODUCTION
Running requires continuous lower extremity loading, predisposing runners to injury. Running related injuries (RRI) incidence varies from 10.9-84.8%, with a mean of 40.2%.1 Running is a top leisure activity globally2 and physical activity has been associated with a reduction in noncommunicable disease (NCD). Multiple researchers have reported greater incidence of RRI in runners with less running experience.3–5 Linton et al. found runners with six months or less of running experience were 1.98 times more likely to get injured compared to runners with 5-10 years of experience.3 In a meta-analysis, Videbaek et. al reported that novice runners incur 17.8 RRI per 1000 hours and recreational runners incur 7.7 RRI per 1000 hours of running.4 Gomez-Molina et al.6 found that experienced runners used a higher step rate and shorter step length than untrained runners, and concluded that adopting a higher step rate and shorter step length may be an adaptive response to decrease the risk of RRI. Therefore, gait retraining intervention that aims to reduce RRI, particularly in runners with novice or recreational experience, is a clinical pursuit that may have long lasting effects on physical activity participation in the form of leisure running and therefore, NCD.
Gait retraining – including a feedback phase and a period of unsupervised practice of running retraining principles – is one proposed intervention to address prevention and treatment of RRIs. Doyle et al. reported on modes of gait retraining including: cadence manipulation, changing a runner’s foot strike from rearfoot to forefoot, reducing impact forces, reducing ground contact time, and multiparameter programs.7 Gait retraining in the form of cadence manipulation has been shown to be a safe retraining method resulting in improved biomechanics. For example, an increased cadence resulted in a decrease in average vertical loading rate, vertical impact peak, and peak patellofemoral joint reaction force.7 Heiderscheit et al. reported subtle changes in cadence reduced the energy absorption required for lower extremity joints8 while Adams reported increasing cadence in persons with RRI’s decreased vertical oscillation resulting in lower loading rates and ground reaction forces.9 Hafer et al. investigated coordination variability and found increased cadence resulted in decreased knee flexion. Also, knee flexion, knee internal rotation, and shank internal rotation occurred later in mid-stance.10 Runners who increased their running cadence had reduced tibiofemoral contact forces,11 reduced peak knee extensor moments, reduced negative hip work, peak hip adduction, peak hip flexion, and reduced foot strike angle.12 In a mixed methods study examining experts opinions, Barton et al.13 found that experts recommended increasing step rate to manage running related injuries and suggested gait retraining as a method for injury prevention while Schubert et al14 concluded increasing step rate may help reduce running related injury rate. Therefore, gait retraining via altering cadence appears to improve biomechanics related to RRI14 and is a worthwhile clinical intervention to investigate.
Gait retraining protocols aimed to increase cadence that are high in duration and intervention frequency, or that have time intensive feedback structures limit the pragmatic use of gait retraining in clinical settings. Variability in feedback methods and minimum increases for prescribing cadence complicate intervention decision making. Cadence retraining may include audio feedback or visual feedback from the provider or from external devices such as a metronome.15 A systematic review by Schubert, Kempf, and Heiderscheit concluded the minimum increase in step frequency required to observe a biomechanical change was as little as 5%, however, optimal change was 10%.14 Doyle et al. reported gait retraining protocols ranged from one to 36 sessions over an average of two to eight weeks.7
The purpose of this study was to determine if a pragmatic protocol using audio metronome feedback set at 5-10% above a runners self-selected cadence would result in a change in cadence. The researchers hypothesized that a pragmatic gait retraining protocol focused on increasing cadence would improve biomechanics of running gait, without effecting physiologic markers including heart rate, rate of perceived exertion, or distance.
METHODS
Study Design
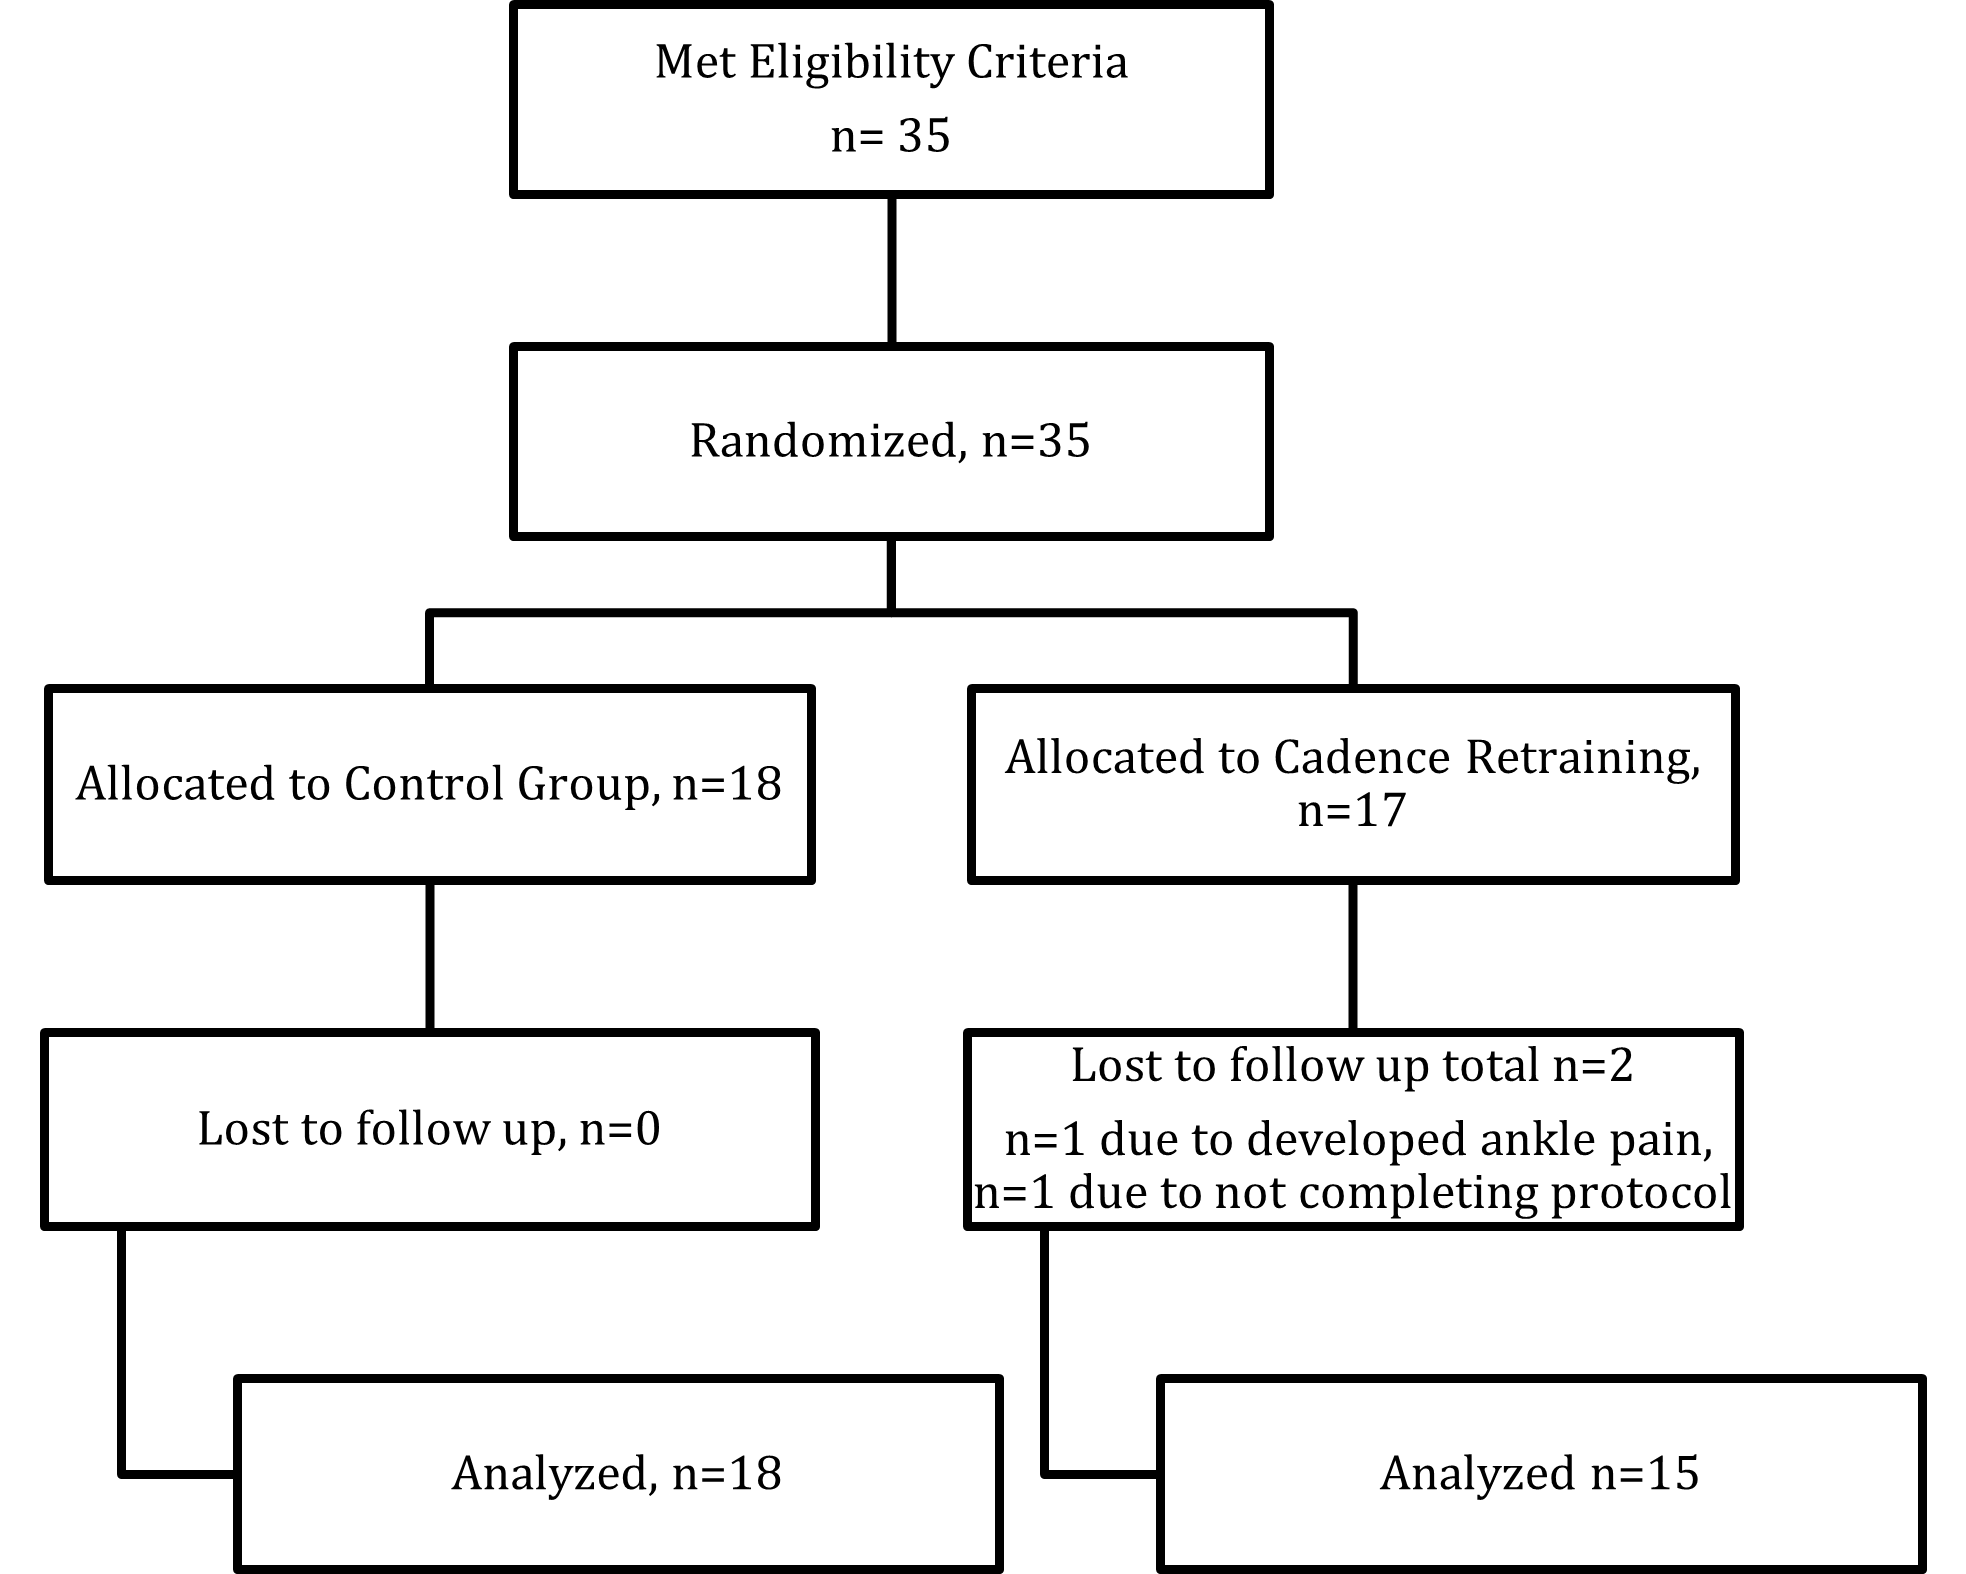
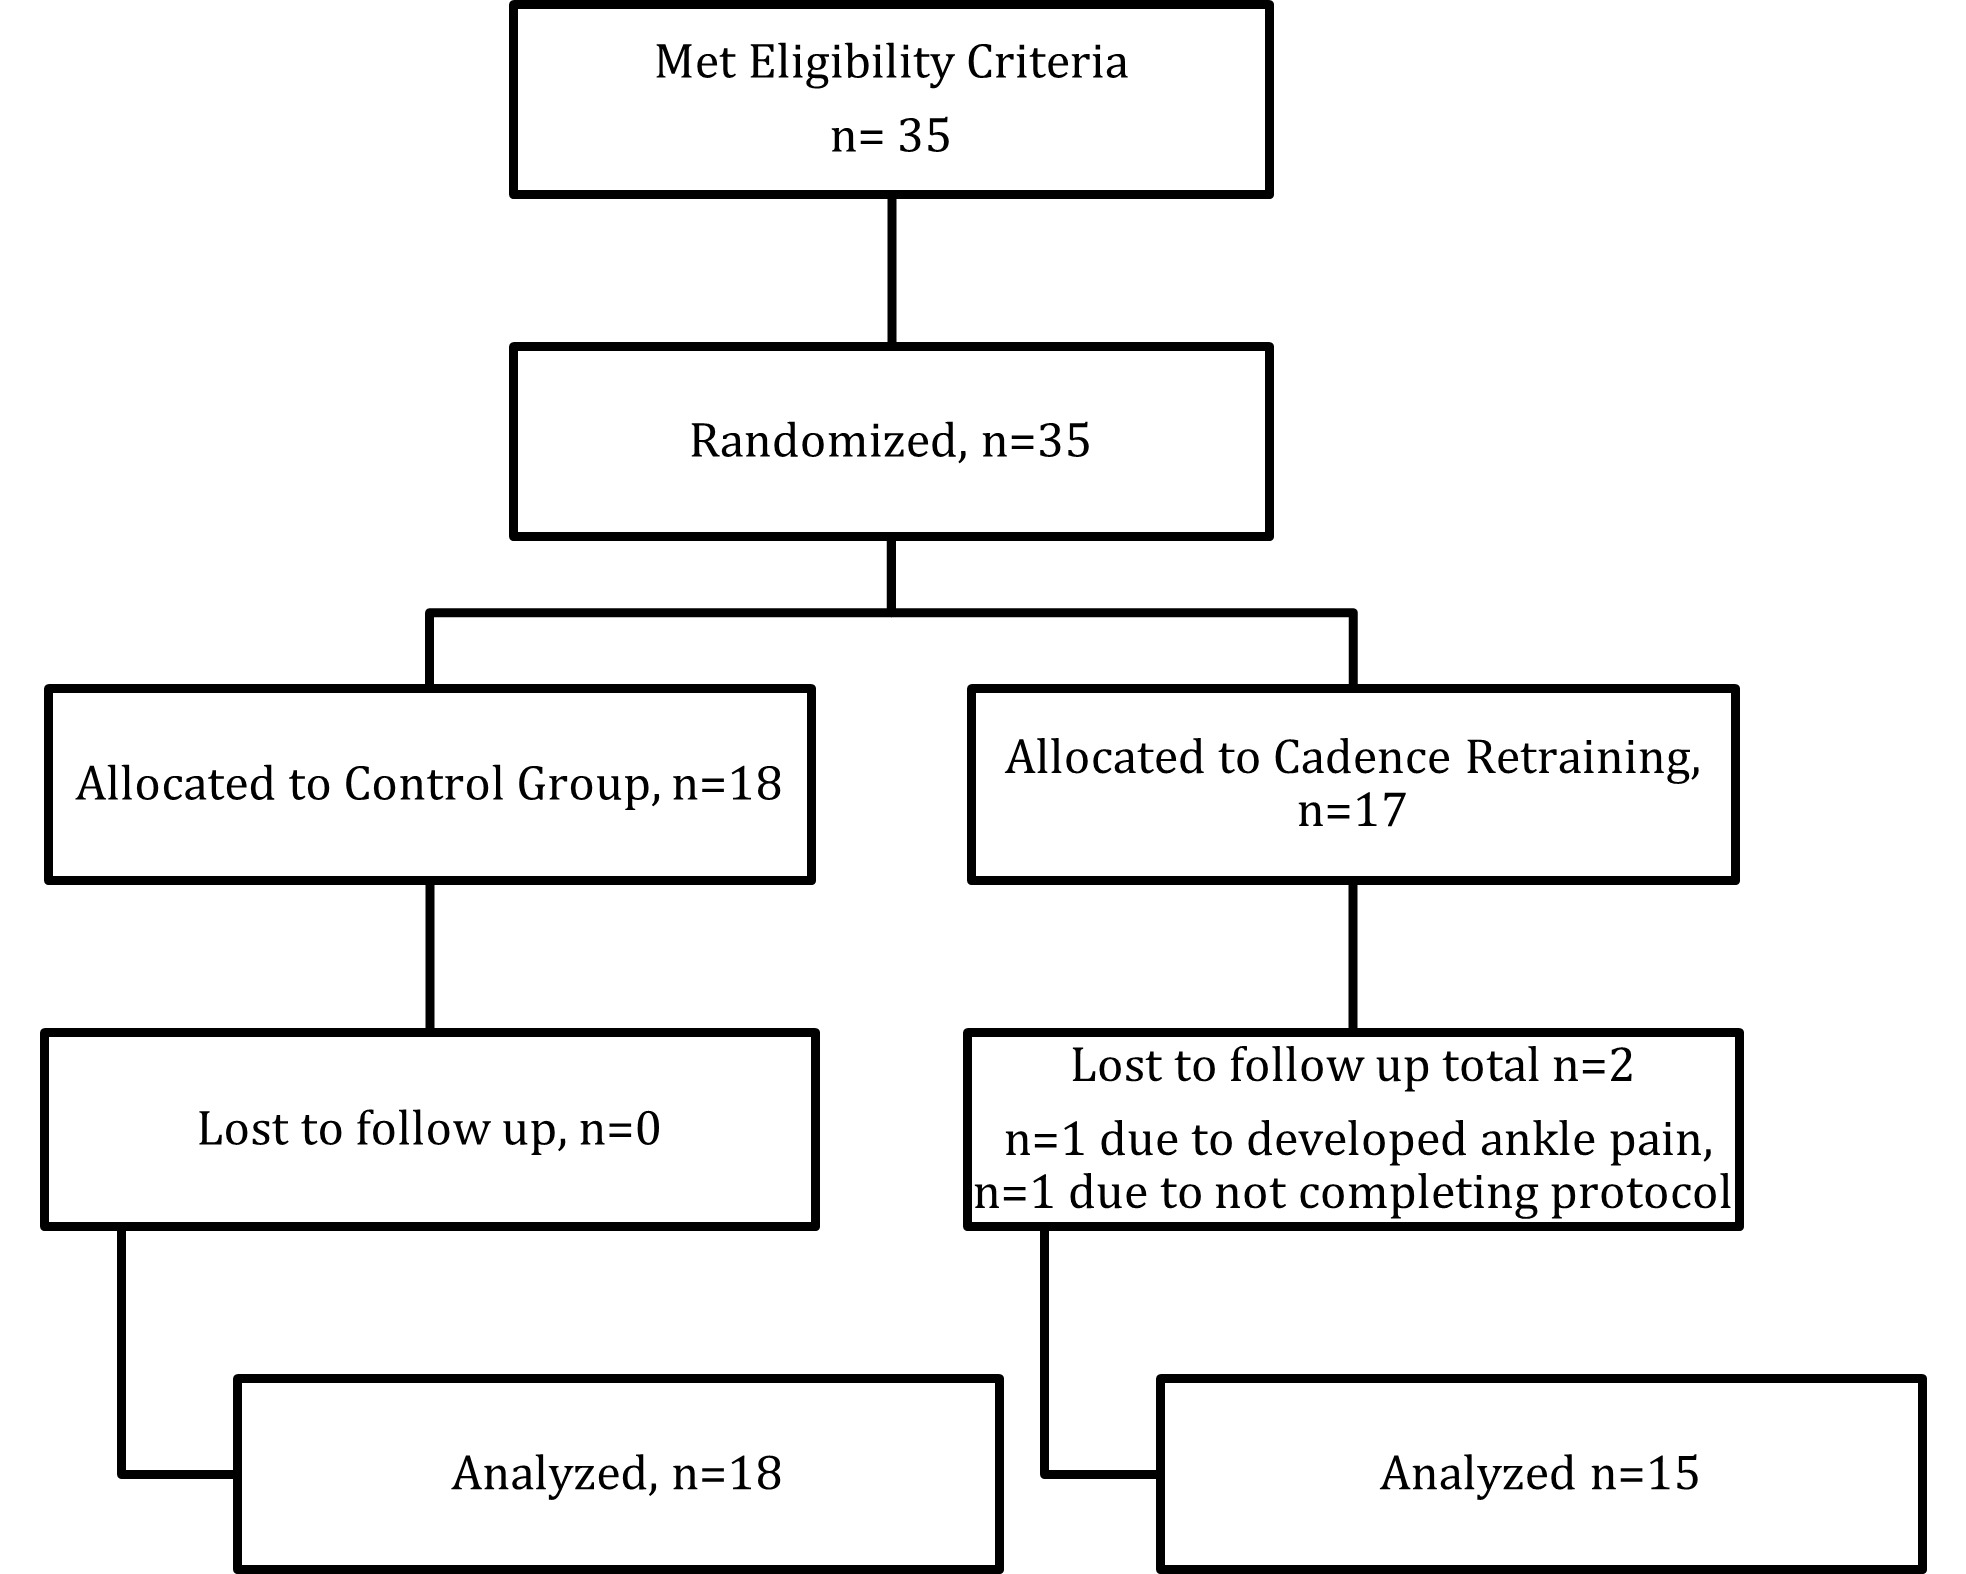
This randomized controlled trial compared an augmented metronome cadence retraining intervention to a control group over a two-week period. Microsoft Excel Version 16.76.1 was used to create a random allocation sequence, with no stratification by co-variates, which resulted in an intervention group (n=17) and a control group (n=18). All but one researcher, was blinded to the group assignment until intervention began. The researcher who enrolled participants was blinded to the participant’s allocation. Researchers were unable to be blinded during intervention due to the nature of treatment.
Participants were assessed during a Cooper 12-Minute Run at two instances: pre-retraining (Pre1), and post-retraining (Post2; after 2 weeks of independent retraining). The independent variable was gait retraining through increasing cadence. Pre1 and Post2 dependent variables were measured during Cooper 12-Minute Runs of both participant groups. Dependent variables consisted of average cadence over the entire run, cadence after 1 minute of running, heart rate (HR) at 5 and 11 minutes, Rate of Perceived Exertion (RPE) at 5 and 11 minutes, and distance ran. The stance duration, vertical excursion, knee flexion, and lumbar flexion were measured throughout the run using inertial measurement units (IMU). The study protocol was approved by the University of Findlay Institutional Review Board.
Participants
A total of 35 participant (14 male, 21 female) runners – recreational defined as running consistently for the last twelve months with a minimum of 10 km per week4 – or novice – defined as running inconsistently for the last twelve months4 – provided consent to participate in the study. Inclusion criteria included participants who were adults (≥ 18 years old) with no injuries at the time of the study, cardiovascular disease, cardiovascular signs and symptoms during exercise, diabetes, cancer, metabolic, renal disease, or cognitive impairments that would limit their safety during high intensity physical activity. Participants were excluded if they were experienced runners defined as running a minimum average of 24 km per week4 or who had trained for a half marathon or marathon.
G*Power (Version 3.1.9.4.3) was used to determine the sample size. The calculation was based on an alpha level of 0.05. The Type II error rate was set at 80% and the effect size at a medium level (0.5) of the primary outcome variables. The appropriate sample size for this study was determined to be 34 participants. The participant flow chart as per the CONSORT statement is shown in Figure 1.
Instruments
Kinematic and spatiotemporal variables were collected using IMUs (Noraxon Myoresearch MR 3.14, Scottsdale AZ, USA). IMUs have been found to be a valid method to collect this data during distance runs16 with only a joint range of motion mean error of 1.17 degrees compared to gold standard optical systems.17 HR was collected using Polar M430 GPS running watch (Polar Electro Oy, Kempele, Finland) and Polar FT1 chest strap heart rate monitor (Polar Electro Oy, Kempele, Finland). Data were transmitted wirelessly to a laptop computer and analyzed using the software associated with the Polar M430 watch. The Rate of Perceived Exertion (RPE) Scale18 was used to collect perception of physical exertion on a scale of 0-10. The RPE scale had strong correlation (r = 0.80-0.90) with HR during exercise and was valid in most conditions.18,19 Cooper’s 12-Minute Run distance was used to measure performance. Penry et al reported excellent reliability (0.96) and high validity coefficients (r = 0.90) for Cooper’s 12-Minute Run.20 A metronome app was used on the participants personal smartphone devices to provide auditory cueing.
Procedures
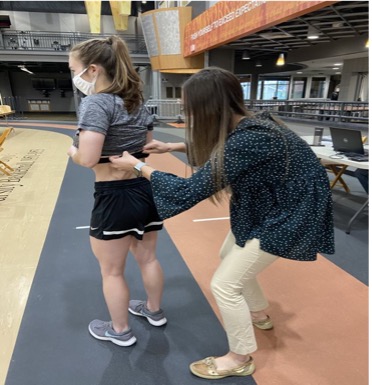
After inclusion/exclusion screening, nine IMU motion sensors were attached to the subjects with elastic and Velcro strapping at the top of both feet, bilateral mid-shins, bilateral mid-thighs, above the tailbone, and mid-low back. A Polar FTI chest strap HR monitor, and Polar M430 Watch were fitted to the participant. (Figure 2)

The participant was given five minutes to perform a self-selected warm up routine, which at minimum included acclimating to the equipment when walking around the indoor running track. IMU motion sensors were then calibrated using Noraxon Myoresearch MR3.14 protocol. Participants completed two-separate Cooper 12 Minute Runs (Pre1 and Post2) approximately two weeks apart on an indoor track (129 meters around and 30 meters straightaways). For the Pre1 Cooper 12-Minute run and the Post2 Cooper 12-Minute run the participant was asked to run at a self-selected pace that they could maintain for 12 consecutive minutes until they were asked to stop. Additionally, a script was used, “At 5 minutes and 11 minutes of running, you will tell one of the researchers how difficult your run currently is on a scale of 0-10 with 0 being no effort at all and 10 being absolute maximum effort. At the end of your 12-minute run, you will cool down by walking or jogging another lap.” Each participant was shown the RPE Scale. HR from the Polar Watch application and RPE was recorded at six and 12 minutes into the runs. The distance run at completion of the Cooper 12-Minute runs were recorded. The Cooper 12-Minute Run was chosen because it is a reliable field test,16 and an inside track was chosen to control for the external environment yet allow the participant to self-select their pace throughout each run to increase external validity. Distance was measured to determine if pace was significantly altered. Cadence, stance duration, vertical excursion, knee flexion, and lumbar flexion was collected throughout the run with IMUs and wirelessly transmitted to Noraxon Myometrics software program. Consistent with Reenalda,16 data were analyzed for five seconds (10 stride lengths) of straightaway running after 60 seconds into the run.
Intervention
Average cadence was determined from baseline IMU measurements during the entire initial Cooper 12-minute run. Only the participants in the cadence retraining group were instructed to download the Pro Metronome-Tempo metronome application on their smartphone devices, and the participants’ metronome beat was set to a 10% increase in average cadence. These participants practiced this cadence for one lap and were permitted to adjust the cadence, if the retraining cadence was at minimum 5% greater than their average cadence. This allowance was made to enhance participant autonomy and compliance without compromising performance; in addition, beneficial changes have been found with a change as little as 5% increase in cadence.8 Once the participant reported comfort with a cadence between 5-10% above their average for one lap they were done with the session. They were asked to run or complete a combination of running and walking at least three times for 30 minutes for two weeks, running at their new increased self-selected cadence. The cadence retraining participants were required to complete a minimum of four sessions to remain included in post testing over the two-week period. The control group participants were instructed to maintain their current exercise routine. To mitigate suspicions of being in the control group, both groups were asked to document their exercise regimen on an activity log until their two-week Post2 testing. At their Post2 test, both groups completed the Cooper 12-minute run without the metronome. After the two-week Post2 testing the control group was offered the same metronome retraining as the intervention group, however, with no scheduled follow up.
Data Management and Analysis
Biomechanical variables – cadence, stance duration, vertical excursion, stance duration, knee flexion at midstance, and lumbar flexion, RPE (at 5 and 11 minutes), HR (at 5 and 11 minutes), and distance run were analyzed in Jeffery’s Amazing Statistics Program (JASP). To examine descriptive differences (age, height, weight, BMI, days run per week, average miles run per week, average miles per run, and years’ experience running) between groups independent t-tests were completed. Outliers were identified via box plot analysis. The box plot analysis was determined to keep variables in analysis due to natural variation reflecting the target population. The Shapiro Wilk Test demonstrated an abnormal distribution, therefore, nonparametric testing – Mann Whitney U test was used. Separate and independent Mann-Whitney U tests were completed to analyze differences in cadence, HR, RPE, stance duration, center of vertical excursion, right and left knee stance duration, right and left knee flexion, and lumbar flexion. Effect size of intervention cadence change was calculated via Cohens ds in Microsoft Excel (V16.76.1).
RESULTS
Descriptive
Descriptive characteristics of the participants randomization into control or intervention groups, are provided in Table 1. Independent t-tests indicated no statistical differences in anthropometric and training characteristics between groups.
Cadence
Results for cadence are presented in Table 2. There was a significant increase in cadence average over the entire run (p=0.002) and after 1 minute (p=0.037) in the intervention group compared to the control group. The effect size of the difference between Pre1 and Post2 cadence over the entire run in the intervention group was Cohen’s ds= 0.837, indicating a large effect size.21
HR and RPE
Results for HR and RPE at five and 11 minutes of the run are presented in Table 3. Group differences (p>0.05) and Pre1 and Post2 differences was not observed for HR or RPE.
Distance
Results for performance, measured by distance completed in the Cooper 12-minute Run is presented in Table 4. Group differences (p>0.05) in Pre1 and Post2 running distance was not observed.
Biomechanics
Biomechanical variables are presented in Table 5. Group differences (p>0.05) in Pre1 and Post2 stance duration, vertical oscillation, left and right knee flexion and lumbar flexion were not observed.
DISCUSSION
The primary finding of this study was that two weeks of gait retraining altering cadence with augmented feedback via a metronome increased self-selected cadence during a performance run in recreational and novice runners. Overall, these results indicate that one instructional session of gait retraining with an independent component including four to six visits over two weeks duration resulted in a change in self-selected cadence. Furthermore, the cadence change effect size from Pre1 and Post2 testing was large, indicating a meaningful increase in cadence.
Participants in this study completed a pragmatic gait retraining protocol. The intervention included one face-to-face instructional session, followed by four to six independent practice sessions using auditory external feedback via a metronome application on a smartphone device over two weeks. Doyle et al. reported gait retraining interventions varying between one and 36 sessions over a two to eight week phase.7 Wang et al22 reported a similar protocol using a metronome application for auditory feedback over a 12-week time with weekly group runs for compliance checks. Baumgartner et al.23 initiated a six-week gait retraining protocol using an alert system to maintain cadence zones that increased cadence, however, lost seven of 38 subjects to follow up. Unlike previous research studies7,22,23 the protocol in this study required limited instructional time, was employed in a short duration, and resulted in a low attrition rate.
Secondary findings indicated this protocol did not change recreational and novice runners’ biomechanical variables including stance duration, vertical excursion, knee flexion at midstance, and maximal lumbar flexion (p-value=0.05). Data collection with IMU’s can be a valid method to collect real-time in-field data,16 however, can have a mean estimation of error of 1.17 degrees when compared to an optical movement system (Vicon).17 Anderson et al12 report moderate to strong evidence that increasing cadence resulted in biomechanical factors including decreased step length and strong evidence for a reduced knee flexion angle.12 In the current study, cadence parameters were set to a 5-10% increase, Post2 testing did not result in a mean of > 5% difference in cadence, despite the large effect size and statistical differences found Pre1 and Post2. The mean difference in cadence over the entire run was 6.67 steps, resulting in a 4.14% change. Heiderscheit et al. and Schubert et al. report the minimum change in step frequency required to observe biomechanical change is a 10% increase in cadence, although some changes are seen with a 5% increase.8,14 Therefore, the low percentage of overall change in cadence along with in field data measuring error may have limited the detection of changes in biomechanical variables.
The results demonstrated in this study indicate an increase in cadence does not impact HR and RPE. Study on the effect of cadence change on HR and RPE is limited.12 A weak positive correlation of vertical displacement coupled with step rate and RPE has been reported in experienced male runners.24 This study highlights the lack of effect of cadence on HR and RPE in a participant group of novice and recreational runners, whose running technique is likely less optimal compared to experienced runners. Even so, the results HR and RPE in this study may be limited by the possibility of a Type II error.
Measuring overground data with IMUs allowed in field testing which enhanced external validity versus lab-constrained optical systems and additionally allowed running at a self-selected speed rather than at a constrained speed typically encountered on a treadmill.17 Given reported biomechanical differences between overground and treadmill running,25 direct biomechanical comparisons to treadmill studies may be difficult. In addition, Lacaille et al26 reported lower levels of RPE during overground running versus treadmill running.
LIMITATIONS
Future research should include repeated testing on cadence and biomechanical variables using gait retraining protocols with limited frequency of face-to-face instruction and emphasize independent retraining with audio feedback to reduce barriers to clinical implementation. Randomized studies of cadence retraining intervention that continue to be pragmatic yet have larger sample sizes and longitudinal post testing are needed to improve the understanding of the effect and retention of increased cadence. Future research should consider standardizing definition of types of runners to enhance the external validity of findings. In addition, investigations should look at interventions over a longer period and assess injury risk in those who received or did not receive intervention.
CONCLUSION
Notwithstanding the limitations, this is a unique study because of the limited face to face instruction required of the protocol which enhances applicability to clinical settings. The results of this study indicate a pragmatic protocol including short duration, low frequency feedback in a primarily independent manner with external auditory metronome feedback can be applied clinically. The large effect size of the average cadence between Pre1 and Post2 testing indicates this protocol creates meaningful short-term change in recreational and novice runners’ cadence, however, not greater than a 5% increase. Biomechanical changes and differences in distance, RPE, and HR were not detected. These findings encourage future investigation of clinically reasonable gait retraining protocols in larger sample sizes, with repeated measures over time, across varying types of runners (including experienced runners) who are pre-determined as having low cadence.
Conflicts of Interest
The authors have no competing or conflicts of interests to disclose.
Funding
No funding was received in relation to the project.
Acknowledgements
The authors thank all who participated in this research.