
Introduction
Fatigue is a complex physiological state that often results in impaired bodily function.1,2 Fatigue has various etiologies with one of the most common being physical exercise, otherwise known as exertion fatigue.2,3 There are two primary fatigue types which result from exertion: peripheral and central. Peripheral fatigue pertains to that involving the peripheral nervous system, particularly the neuromuscular junction, and the working skeletal muscle. It is thought to be isolated to working muscles with minimal distal effects, though it may put the involved tissue at increased injury risk.4
Central fatigue arises from the central nervous system with sustained exercise, potentially serving as protection from catastrophic homeostatic disruption.1,5 It is generally thought of as whole-body cardiovascular fatigue, also known as exercise-induced central fatigue (EICF). In a centrally fatigued state, there is a net reduction in spinal mediated reflexes, producing an increased difficulty activating motor neurons and a decline in motor unit firing rates. These changes are facilitated by presynaptic modulation and autogenic inhibition of muscle spindle, Golgi tendon organ, and small diameter muscle-afferent inputs.1,6 In athletes, these effects are accompanied by the concern of diminished (worse) athletic performance, as several authors have reported balance, landing, throwing, and running impairments in athletes in a fatigued state, among others.7–9
Another major component of EICF is psychological, or mental fatigue. While not strictly exertion induced, mental fatigue plays a significant role in the physical impairments seen with EICF, including central components such as cognitive processing, contributing to mental fatigue onset with sustained exercise.2,10 Mental fatigue does not directly affect maximal voluntary muscle contraction. Instead, it appears to alter the individual’s perception of an expended effort, which may affect maximal voluntary muscle contraction.11,12 Ultimately, task failure with EICF is a complex multisystem phenomenon.
At the mercy of the previously described physiological and physical manifestations, EICF is accepted as an increased risk factor for numerous different injuries.13,14 However, the effect of EICF on the head and neck region is not well understood. This interaction is important due to potential implications for head injury, particularly concussion. In sport, concussion incidence tends to increase in the second half of the season and the second half of single sporting events, yet evidence explaining why this occurs is unavailable.15,16 A study performed on professional hockey players found that increased play time over a game correlated with increased concussion incidence, suggesting in-game fatigue may be a cause.17 However, the question remains, why would fatigue increase concussion incidence? One prospective explanation involves aspects of performance of the head and neck.
Impaired cervical spine (CS) proprioception, muscle strength, and endurance increase the risk of suffering a concussion.18–20 Fatigue may further compromise the CS and increase concussion risk. Among available evidence, central fatigue has been found to increase CS angle reproduction error in healthy adults.21 Fatigue may reveal these subclinical deficiencies that could contribute to undetected concussion risk, particularly in the head and neck, affecting athletes’ ability to sufficiently mitigate forces on structures within the region. This effect may be more pronounced in athletes with a history of concussions, as they may have long-lasting neurophysiological deficits.22–24
Therefore, the purpose of this study was to determine the effect of exercise induced central fatigue on neck joint position error, strength, and endurance in healthy subjects and those with a history of concussion. The investigators hypothesized that EICF would have a negative effect on all variables. This analysis will inform understanding of head and neck functional abilities in a fatigued state, as well as the impact on concussion risk and injury prevention strategies.
Methods
This study was conducted in two phases. Phase 1 involved CS performance testing in healthy subjects pre- and post-fatigue. Phase 2 examined CS performance in a small sample of subjects with concussion history pre- and post-fatigue. Both groups read and signed an informed consent approved by the associated IRB prior to participation.
Phase 1
Experimental Design
Group testing was performed using a single factor, within-subjects repeated measures design. Data were collected pre- and post-fatigue to determine differences in JPE, neck flexor endurance, and CS muscle strength.
Subjects
Subjects were healthy males and females between 18 and 50 years of age. Exclusion criteria were adapted based on absolute contraindications outlined in American College of Sports Medicine Guidelines for Exercise Testing and Prescription as follows: (1) Pregnancy by self-report; (2) Physical disability with limited ability to participate in the testing; or (3) Any of the following conditions diagnosed by a health care provider and conveyed by subject self-report that would have prevented safe and adequate cardiovascular fatigue testing: (a) Hypertension; (b) Circulatory condition; (c) Cardiac condition; (d) Pulmonary condition; (e) Thyroid condition; or (f) History of cerebrovascular accident.25 Additional exclusion criteria included: (1) History of concussion within the prior year; (2) Current neck pain that required health care intervention or that significantly impaired daily functional activities; (3) Active headache or migraine that required health care intervention or that significantly impaired daily functional activities; or (4) History of head or neck surgery.
Experimental Procedure
All testing was performed by the same investigator. This investigator had previously demonstrated strong intra-rater reliability with all testing procedures. A second investigator recorded the data values, blinding the first investigator to the results. Testing began with JPE measurement in order to avoid the effects of neck muscle fatigue. The strength and endurance testing order was randomized to avoid an order effect.
Joint position error was tested by active rotation angle reproduction.26,27 Subjects were seated in a chair, wearing a disposable eye cover. They were instructed to sit as upright as possible with their hands positioned in their lap. Their knees were placed at 90 degrees of flexion and their feet were positioned on specific markings on the ground. Subjects self-determined their neutral head position and were then passively moved to 20 degrees of cervical rotation to either side, so that this position would serve as a starting point for each rotation direction, respectively. The compass app was “zeroed” at that 20-degree position. Subjects were instructed to memorize this position and replicate it following active movement into maximal cervical rotation in each direction. Subjects were asked to determine when they feel they had relocated the 20-degree angle position, and the actual position was recorded in degrees. Following familiarization, subjects performed one bilateral rotation practice trial and six bilateral testing trials.
Two different error scores were obtained from the raw JPE values: absolute error and constant error. Absolute error is defined as the mean of the total deviation from the starting point over the trials, ignoring positive (overshoot) and negative (undershoot) values. This value represents the overall magnitude of error among the trials without considering the direction. Constant error is defined as the mean of the raw error over the trials incorporating the positive and negative values in each trial. This value represents the average magnitude and, unlike absolute error, uses the direction of the error. Studies suggest that a combination of absolute and constant error is best suited for measuring JPE.28 These values are derived from the following equations:
Absolute Error = (absolute of raw error trial 1) + (trial 2)… + (trial 6)/6
Constant Error = (raw error trial 1) + (trial 2)… + (trial 6)/6
Neck endurance measurements were assessed via the neck flexor endurance test.29,30 For testing, subjects assumed a supine hook lying position with their hands on their abdomen. Subjects were then instructed to retract their chin and lift their head 2.5cm off the plinth while maintaining their chin retraction. The investigator drew a line across two adjacent skin folds on the subject’s anterolateral neck, then placed his index and middle fingers in a stacked position below the subject’s most posterior occiput. Subjects were asked to relax and rest their head on the investigator’s hand, and then maintain contact during the test procedure. Once they lifted the head high enough to unload the head’s weight from the investigator’s fingers while continuing to maintain light contact with the same fingers, the investigator moved those fingers side to side to provide tactile cuing for optimal positioning. Subjects were instructed to maintain their lifted position as long as possible. The test was terminated when any one of the following occurred for more than one second: (1) the drawn line edges no longer approximated each other; (2) the subject’s head rested on the investigator’s fingers; (3) subjects raised their head enough to no longer contact the investigator’s fingers. Additionally, the test was terminated if subjects were unwilling to continue. Test duration was recorded in seconds. All subjects performed one practice trial followed by one-minute rest. Next, all subjects performed three recorded trials with one-minute rest between each trial.
Measurements for CS muscle strength were assessed via a hand-held dynamometer (HHD; MicroFet2, Hoggan Scientific, Inc; Salt Lake City, UT, USA).31 Subjects were seated and restrained at the trunk and shoulder levels to reduce accessory trunk movement. One test trial included a strength test into cervical flexion, extension, and bilateral rotation. The investigator placed the HHD at the subject’s forehead for flexion, occiput for extension and lower jaw for rotation. Subjects were instructed to clench their jaw during rotation. They were instructed to perform maximal voluntary isometric contractions into each movement direction and hold each contraction for 5 seconds. All subjects performed one practice trial followed by 10-seconds rest. Next, all subjects performed three recorded trials with 10-seconds rest in-between each trial. Mean values were used for statistical analysis.
Fatigue Protocol
Following baseline testing, subjects began a modified Bruce treadmill test to induce central fatigue. The protocol was conducted as outlined in the American College of Sports Medicine Guidelines for Exercise Testing and Prescription.25 Subjects were not tested for the purpose of cardiovascular assessment and therefore were not monitored via electrocardiogram. The test consisted of six 3-minute stages as follows:
1 – 1.7mph, 10 %GR
2 – 2.5mph, 12 %GR
3 – 3.4mph, 14 %GR
4 – 4.2mph, 16 %GR
5 – 5.0mph, 18 %GR
6 – 5.5mph, 20 %GR
Subjects were instructed to continue each test trial until they: (1) reached fatigue and could no longer continue; (2) reached 85% of their age predicated HRmax (whichever came first); or (3) desired to stop. Heart rate values were collected continuously using a chest monitor. Blood pressure values were collected at baseline and following protocol completion. Subjects were assumed to be centrally fatigued following each protocol completion.
To establish central fatigue effects on sensorimotor control, post-fatigue JPE, neck flexor endurance, and CS muscle strength measurements were conducted using the previously described procedures. Following the first fatigue event, JPE testing was performed. Subjects then returned to the treadmill and began the Bruce treadmill test one level below the previously terminated level to avoid recovery. Following the second fatigue event, either endurance or strength testing was performed in the same random order as in the pre-fatigue protocol. Subsequently, subjects again returned to the treadmill and began the Bruce Treadmill test one level below the previously terminated level. Following the last fatigue event, subjects performed the remaining out of strength and endurance testing.
Phase 2
Experimental Design
Phase-2 data were not used to test statistical hypotheses. This exploratory component used a multiple single-subject design to examine how a small sample of subjects with concussion history individually responded to the same experimental parameters.
Subjects
Inclusion and exclusion criteria for Phase-2 subjects were the same as Phase-1. However, Phase-2 subjects’ inclusion criteria required a history of at least three concussions within their lifetime. Subjects self-reported that they could participate in high-intensity exercise without symptoms, indicating that they had recovered from any previous concussion.
Experimental Procedure
Preparatory procedures, baseline testing, the fatigue protocol, and post-fatigue testing were conducted in the same manner as group testing in Phase-1.
Statistical Analysis
Data were analyzed using R (R Core Team, 3.6.1, Vienna, Austria) and RStudio Team (2020, Boston, MA).
Phase 1
Mean, median, standard deviation, 95%CI, skewness, and kurtosis were used to describe central tendency and dispersion. Shapiro Wilk test statistic and probability, density plotting, as well as skewness and kurtosis values were used to assess normality.
A prospective power analysis estimated 19 subjects to obtain a desired power of 80% (1-β=0.80) at a significance level of α= .05 (G-Power 3.1.7.9, Kiel, Germany), and a moderate effect size (Cohen’s d = 0.5). A paired t-test was used to determine differences in values for JPE, neck flexor endurance, and CS muscle strength before and after the fatiguing protocol. All parametric assumptions were satisfied. Bonferroni correction was used for JPE and strength variables post-hoc to correct for multiple comparisons and reduce the likelihood of a Type-1 error.32 Cohens d effect sizes are also reported.
Phase 2
Concussion history subjects’ data were analyzed using plots and mean, standard deviation, and percent change values. Analysis of mean differences was assessed using the two standard deviation band method. Two consecutive fatigue condition data points outside of the before fatigue conditions’ two standard deviation band was considered a statistically significant difference (p < 0.05).32
Results
Phase-1
The healthy group consisted of nine males and ten females with an average age of 32 years (SD = 8), average height of 1.7m (SD = 0.12), and average weight of 74.1kg (SD = 16.2). Mean values for the healthy group are summarized in Table 1.
Joint Position Error
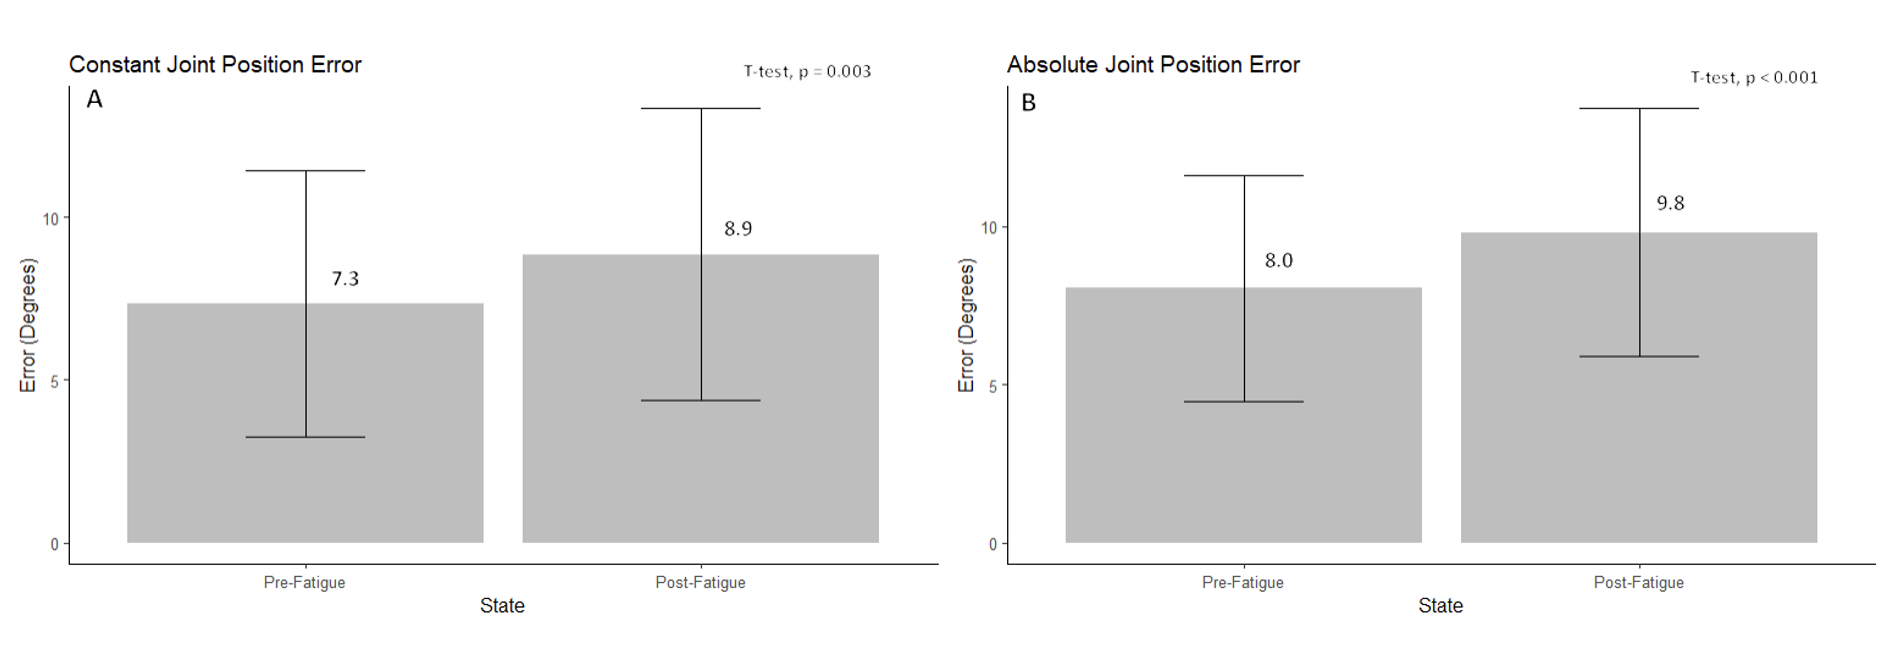
There was a significant increase in constant (p = 0.003, Cohen’s d = 0.35) and absolute (p < 0.001, Cohen’s d = 0.47) JPE with fatigue (Figure 1). Healthy subjects demonstrated a 20.7% and 21.8% increase in constant and absolute error with fatigue, respectively. Additionally, increased variance for constant JPE was observed post-fatigue, suggesting less accuracy and precision overall. This post-fatigue error was comprised of an increase in either under- or over-shooting for each subject, where overshooting occurred more frequently overall.
_and_mean_absolute_jpe_(b)_in_degrees__in_heal.png)
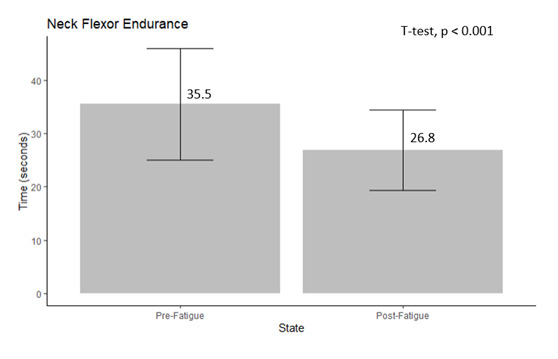
Neck Flexor Endurance
There was a significant decrease in neck flexor endurance times with fatigue (p < 0.001, Cohen’s d = 0.95) (Figure 2). Subjects demonstrated a 24.5% decrease in endurance times with fatigue.
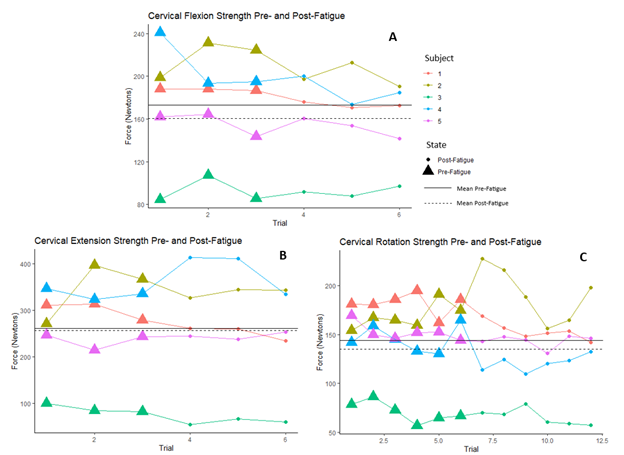
Muscle Strength
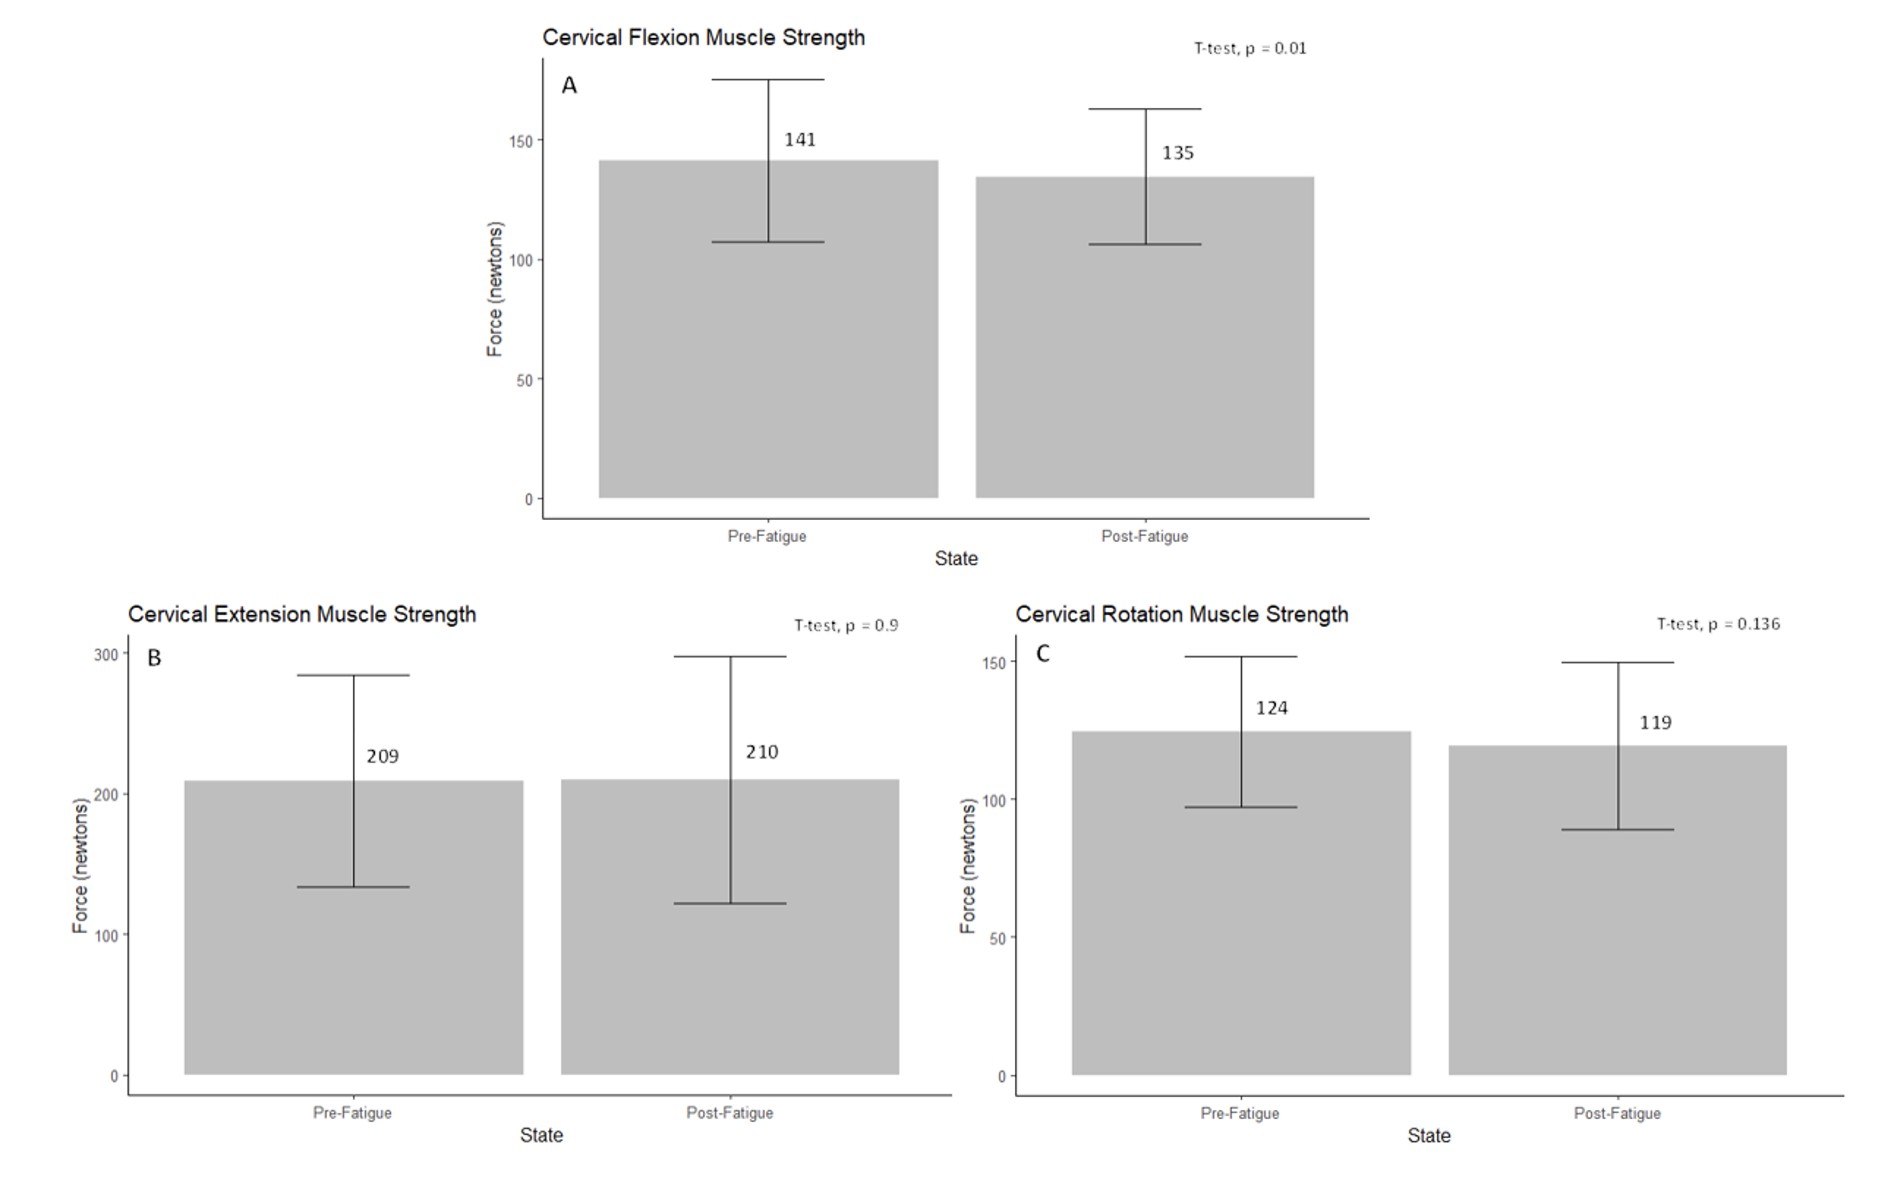
There was a significant decrease in CS muscle strength into flexion (p = 0.01, Cohen’s d = 0.21) with fatigue. There was no significant strength difference into extension (p = 0.9) or rotation (p = 0.136) with fatigue (Figure 3). Subjects demonstrated a 4.7%, 0%, and 3.9% decrease in force production for flexion, extension, and rotation with fatigue, respectively.
_extension_(b)__and_rotation_(c)_muscle_st.png)
Phase 2
Phase-2 consisted of five subjects with a history of at least three concussions within the lifetime. Subject demographics are summarized in Table 2.
Joint Position Error
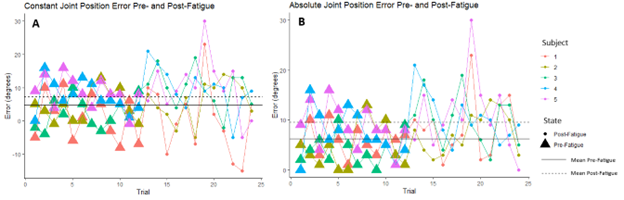
Post-fatigue error was amplified in subjects with concussion history. There was a significant increase in constant JPE overall, where 4/5 subjects demonstrated a significant increase, while 1/5 subjects demonstrated a significant decrease in constant JPE with fatigue. Five of five subjects demonstrated a significant increase (p < 0.05) in absolute JPE with fatigue. Subjects with concussion history overall demonstrated a 30.2% and 50.2% increase in mean constant and absolute error, respectively. Moreover, subjects with concussion history demonstrated even greater variance following fatigue. Undershooting was observed more often than in healthy subjects, however overshooting was still observed more often overall. All concussion history subjects JPE trials have been nested together along with their mean for visualization (Figure 4). Subjects were previously individually analyzed where two consecutive data points outside of the two-standard deviation band was considered statistically significant (p < 0.05).
_and_absolute_jpe_(b)_trials_in_degrees__in.png)
Neck Flexor Endurance
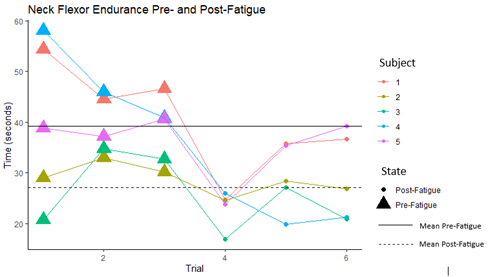
Neck flexor endurance impairments were amplified in subjects with concussion history. Four of five subjects demonstrated a significant decrease (p < 0.05) in neck flexor endurance following fatigue. Subjects with concussion history overall demonstrated a 44% decrease in mean endurance time overall. All concussion history subjects neck flexor endurance test (NFET) trials have been nested together along with their mean for visualization (Figure 5). Subjects were previously individually analyzed where two consecutive data points outside of the two-standard deviation band is statistically significant (p < 0.05).

Muscle Strength
Cervical muscle strength results were mixed in subjects with concussion history. One of five subjects demonstrated a significant decrease in CS muscle strength into flexion with fatigue. Two of five subjects demonstrated a significant decrease, while 1/5 subjects demonstrated a significant increase in CS muscle strength into extension with fatigue. Three of five subjects demonstrated a significant decrease, while 1/5 subjects demonstrated a significant increase (p > 0.05) in CS muscle strength into rotation with fatigue. Subjects with concussion history overall demonstrated a 7.6%, 1.9% and 6.6% decrease in mean flexion, extension, and rotation force production, respectively. All concussion history subjects strength trials for flexion, extension, and rotation have been nested together with their mean for visualization (Figure 6). Subjects were previously individually analyzed where two consecutive data points outside of the two-standard deviation band is statistically significant (p < 0.05).
__extension_(b)__and_rotation_(c)_cervic.png)
Discussion
The purpose of this study was to determine the effect of exercise-induced central fatigue on cervical joint position error, muscular strength, and neck flexor endurance in healthy subjects. Additionally, a multiple single-subject design was used to determine how a small sample of subjects with concussion history responded to the same experimental parameters. Subjects were tested before and after a centrally fatiguing protocol. Central fatigue arises from the central nervous system and, unlike peripheral fatigue, produces widespread physiological effects.1,2 Central fatigue effects on the head-and-neck however, are not well understood. This interaction is important due to potential implications in concussion incidence and recovery. In a centrally fatigued state, systemic physiological functions are impaired, potentially compromising head-and-neck function and increasing concussion risk.1,2
Cervical spine proprioception, strength, and endurance have been previously examined with respect to their role in concussion and have been found as significant concussion predictors in males and females.18–20 Increased CS muscle strength is associated with an attenuated kinematic response to external forces applied to the head. Eckner et al. proposed increased CS strength to be a positive and modifiable risk factor for concussion.18 Farley et al. concluded that for every 10% increase in gross cervical rotation error there was a 5% increase in concussion rate among professional rugby players.19 Baker et al.33 found that neck flexor endurance was not predictive of increased concussion injury risk. However, preseason neck flexor endurance test times were 2.9 seconds lower in athletes who ended up concussed than those who did not. Additionally, they found that neck flexor endurance times improved predictably with concussion recovery in concussed athletes.33
While there is no direct evidence linking central fatigue to increased concussion risk, it is possible that central fatigue could impair head-and-neck function and, therefore, an athlete’s ability to respond quickly and effectively to collisions or impacts, leading to a higher likelihood of suffering a concussion. As a preliminary measure that could inform a person’s risk, a Bruce Protocol was used to confidently achieve 85% of their age-predicted maximal cardiovascular output and measure the predetermined variables in the subjects before and during a centrally fatigued state.25
Healthy subjects demonstrated a significant increase in constant and absolute JPE and a significant decrease in neck flexor endurance following central fatigue. Following fatigue, mean constant JPE was 8.9 degrees and absolute JPE was 9.8 degrees, surpassing typical JPE values of 2-5 degrees reported in the literature.28 These results are consistent with Okhravi et al., who found that general fatigue increased repositioning error of the head and neck in healthy subjects.21 All subjects with concussion history individually demonstrated a significant increase in error, where mean constant (7.3 degrees) and absolute (9.6 degrees) JPE post-fatigue surpassed typical JPE values reported in the literature as well.21
Despite an even distribution of males and females, the healthy group demonstrated an average pre-fatigue NFET time of 35.5 seconds, consistent with normative values for males reported in the literature (35.57±10.43 seconds).30 Following fatigue, the group mean fell to 26.8 seconds, below normative values for both males (35.57±10.43 seconds) and females (31.86±8.53 seconds) reported in the literature.30 Subjects with concussion history demonstrated an average NFET time of 27.1 seconds post-fatigue, below normative values for females reported in the literature despite consisting of only one female. Future research should involve a full group of subjects with concussion history to allow for formal comparisons.
Subjects across both groups demonstrated variable strength testing results. In healthy subjects, only a significant decrease in CS flexion strength was observed, accompanied by minimal, nonsignificant decreased changes across all other directions. There is no published physiological mechanism that could explain why CS flexion strength would decrease without significant changes in extension or rotation. Concussion incidence typically involves rotational impact forces, however no directional preferences in strength have been documented.18,20 Additionally, there is minimal data specifically addressing the effects of central fatigue on neck strength outcomes. The observed differences could be explained by chance or undetected error in methodology. Subjects with concussion history demonstrated minimal deficits overall. Subjects with a history of more frequent concussion incidence demonstrated significance across more test directions versus those with fewer concussions, however no conclusions can be drawn. Future research should further examine strength responses to EICF using more rigorous strength testing measures to better capture fatiguability.
Due to drastic group differences inferential statistics were not conducted between healthy subjects and those who had sustained concussion. Percent change for both groups can be found in Table 3, however, comparisons cannot be made or result in any inferential conclusions. Among subjects with concussion history, concussion volume may affect fatigue responses, as subjects with a greater number of concussions demonstrated more statistically significant variables than those with fewer.
Previous authors have found impairments in gaze stability, sleep quality, and gait control long after concussion.34,35 Additionally, residual cognitive and linguistic deficits have been reported.36,37 Other investigators have discovered that athletes with concussion history have greater risk of presenting with more varied symptoms and higher symptom severity scores upon subsequent concussion.38 Future research should investigate whether central fatigue amplifies these existing impairments in those with concussion history, potentially increasing injury risk. Moreover, future research should examine fatigue effects on head-and-neck kinematics in the same subject sample.
This study had several limitations. Subjects included healthy subjects and a preliminary sample of subjects with a history of concussion to explore whether the measured parameters were influenced by the fatigue protocol. However, a full concussion history cohort suitable for inferential analysis could incorporate mixed models and allow comparisons between and within the two groups would be ideal in the future. Furthermore, the HHD used for strength testing only recorded the highest value of force detected. This instrument would not provide information regarding muscle activation and motor control. During testing, it was observed that both groups experienced greater difficulty performing each contraction, despite minimal quantitative differences. These observations suggest that an alternate tool, such as electromyography, may be well suited for further assessing muscle performance.39 Lastly, there was no head-and-neck kinematic assessment. Kinematic variables would provide a more in-depth functional assessment of fatigue effects on the head and neck and their implication in concussion.40
Conclusions
The current results suggest CS proprioception, strength, and endurance are impaired following central fatigue in healthy individuals. These effects may be more pronounced in those with a history of concussion, however further research is warranted. Athletes may be at an increased risk for injury occurrence and severity in a centrally fatigued state. Future studies should address the effect of exercise-induced central fatigue on head-and-neck kinematics and sensorimotor control, comparing a cohort of both healthy and previously concussed individuals.
Conflicts of interest
The authors report no conflicts of interest.
For inquires including access to additional data, contact antoniovintimilla94@gmail.com