
INTRODUCTION
Objective human movement is traditionally studied in research laboratories with force platforms, motion capture systems, and other instrumented tools. The introduction of portable pressure walkways like the GAITRite® (CIR Systems, Inc, Franklin, NJ, USA) and ZenoTM Walkway (ProtoKinetics LLC, Havertown, PA, USA) has enabled objective assessment of gait and other movement parameters in clinical spaces. These walkways measure and collect data including spatiotemporal variables, which are useful in identifying pathological gait patterns,1–4 assessing changes in gait related to medical intervention or aging,5–14 and identifying sensorimotor impairments.15 Instrumented walkways have predominantly been used to assess older adults6,8,10–13,16,17 and those with known pathological gait patterns,2,4,5,7,18 but few studies exist that assess younger, more active individuals or include analysis of running in addition to walking.9,19
Although the ZenoTM Walkway has previously been used in research and clinical settings, standard protocols outlining the number of trials required to capture valid gait parameters have not been established. Studies that have measured gait parameters on instrumented walkways utilized anywhere from two to 10 walking trials.1,17–20 Besser et al.20 reported that, for a given spatiotemporal variable, five to 10 gait cycles were required for 90% of individuals in the study population to be within 5%-10% of their mean. However, this study was performed using the GAITRite® mat, and up to 24.2% difference in GAITRite® and ZenoTM measurements have been reported.16 Although instrumented walkways are generally understood to be reliable measurement tools,2,21–27 these reported differences indicate the need to assess the reliability of the ZenoTM Walkway independently. Sufficient data are required to establish an accurate representation of an individual’s gait pattern and to reduce error in identifying changes in gait over time. Furthermore, unnecessarily excessive data collection increases patient burden and fatigue. A standardized data collection protocol is needed so that researchers and clinicians can confidently identify when measured spatiotemporal characteristics fall outside the range of typical variability during walking or running on the ZenoTM Walkway.8,13,28
The purposes of this study were to 1) determine if up to two additional trials of walking and running on the ZenoTM Walkway are needed to produce consistent measurements of spatiotemporal variables, and 2) establish test-retest reliability and MDC values for common spatiotemporal variables measured during walking and running.
METHODS
This cross-sectional study included 38 participants (21 females; age: 24.2±3.5 years; BMI: 24.3±3.6 [range: 16.7-30.8]) recruited between July 2019 and January 2020. Twenty-one participants completed follow-up testing between one and 14 days later (12 females; age: 24.4±3.4 years; time between sessions: 5.9±2.9 days). Participants were included in this study if the following criteria were met: 15-35 years of age, no previous history of lower extremity injury or surgery during the prior six months, who participated in at least 50 hours per year of Level I (e.g. soccer, basketball, football) or II (e.g. tennis, skiing, dancing) cutting and pivoting sports.29 Exclusion criteria included recent history of hip, knee, or ankle pain or surgery during the prior six months, balance or neurological disorders, or current pregnancy. Testing was performed in the Clinical Movement Analysis Laboratory at the University of Nebraska Medical Center (UNMC). All participants provided written informed consent. This study was approved by the UNMC Institutional Review Board (IRB #0233-19-EP).
Instrumentation
Spatiotemporal variables were measured using a ZenoTM Walkway with a sensor area 20 feet long and two feet wide with 0.4 square inch sensors. Spatiotemporal data was collected at 120 Hz with a resolution of 1.27 cm (0.5 in2).
Walking and Running Testing
Testing procedures included five trials each of walking and running at a self-selected comfortable speed. A trial was defined as a single pass in one direction along the full length of the ZenoTM Walkway. Participants were given approximately three meters of floor space before and after the length of the walkway to minimize effects of acceleration and deceleration on measured gait parameters. Speed was measured using a laser timing system (Brower Timing Systems, Draper, UT) placed at the beginning and end of the walkway. Self-selected speed was determined using three unrecorded trials of walking or running, respectively, during the baseline (T1) data collection. To ensure consistency during follow-up testing (T2), the laser timing system was used to maintain walking and running speed within ±5% of the self-selected speed measured during the baseline data collection. Participants wore their own athletic shoes and were instructed to wear the same pair of shoes for both testing sessions. Testing order was standardized, with walking completed first, followed by running. Walking and running testing procedures for the twenty-one participants who returned for follow-up reliability testing were identical to the baseline testing session. Data was collected and processed using ProtoKinetics Movement Analysis Software (PKMAS) (ProtoKinetics LLC, Havertown, PA). Right and left footfalls (i.e., footstrikes) were automatically labeled by PKMAS then confirmed by a research assistant. Variables of interest included stride length, stride width, step length, step time, stride time, stance time, swing time, percent stance phase, percent swing phase, single support time, total double support time, single support percent, total double support percent, speed, cadence, integrated pressure, and toe angle. Single support and double support variables were not analyzed for running.
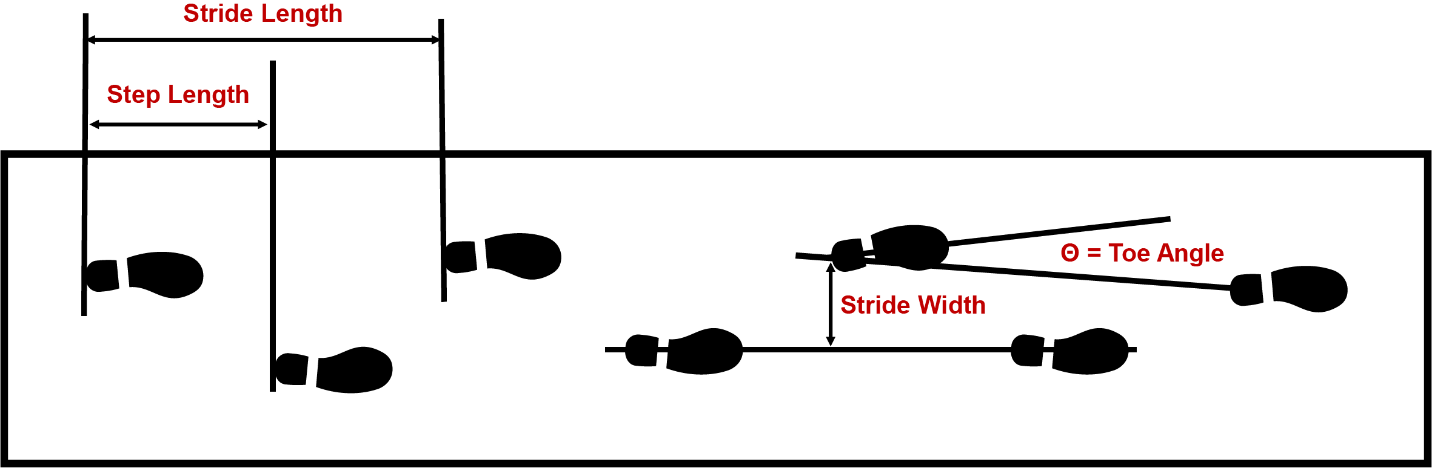
Figure 1 illustrates each of the four spatial variables (stride length, stride width, step length, and toe angle). For toe angle, positive values indicate an externally rotated foot relative to the direction of progression. As defined by PKMAS software, step time and stride time were calculated using the first contact of two consecutive contralateral or ipsilateral footfalls, respectively. Stance time was defined as the time between initial and final contacts for a single footfall. Swing time was calculated as the difference between stride time and stance time. Percentage variables were calculated as a percent of one full gait cycle, defined as the time between the first contact of two consecutive ipsilateral footfalls (i.e., stride time). Single support time was defined as the time during which only one foot is in contact with the ground. Total double support time was defined as the period during which both feet were in contact with the ground during stance phase, including both the initial and terminal portions of double support during a single gait cycle. Cadence was calculated using the number of footfalls divided by the total ambulation time of a single trial and then converted to steps per minute. Integrated pressure was defined as the area under the relative pressure curve for a single footfall and was averaged across all footfalls of the same limb for each trial.

Statistical Analysis
Sample Size
An a priori power analysis was conducted using unpublished pilot data of 18 healthy, uninjured participants collected prior to this study. Each participant completed three trials of walking and running along the length of the ZenoTM Walkway. Mean and standard deviation (SD) of sample SDs for integrated pressure, step length, step width, and stance time were calculated for walking (integrated pressure: 7.40±1.80; step length: 2.10±0.65 cm; step width: 2.00±0.50 cm; stance time: 0.015±0.005 sec) and running (integrated pressure: 4.70±1.40; step length: 4.70±1.90 cm; step width: 2.20±0.70 cm; stance time: 0.012±0.003 sec). A total sample size of n=37 was required to achieve at least 80% power and a significance level of 0.05 for all gait variables during walking and running using an equivalence margin of ±20%. To determine test-retest reliability, a sample size of n=17 was determined sufficient to detect intraclass correlation of 0.85 (vs. a null intraclass correlation coefficient (ICC) of 0.5) with 80% power and a significance level of 0.05.
Aim 1: Assessment of Additional Trials for Measurement Consistency
Statistical analysis was performed using IBM SPSS Statistics 26 (Armonk, NY). Two-way mixed effects intraclass correlation coefficients (ICC3,k) were used to assess absolute agreement between means of spatiotemporal variables calculated using three, four, or five passes over the ZenoTM Walkway.30 ICC values range from 0-1, with higher numbers indicating better agreement between variables. According to published literature, ICC values less than 0.5 indicate poor reliability, 0.5-0.75 indicates moderate reliability, 0.75-0.9 indicates good reliability, and values > 0.90 indicate excellent reliability.31
Aim 2: Establishing Test-Retest Reliability and Minimal Detectable Change
Two-way mixed effects intraclass correlation coefficients (ICC3,1) were used to assess absolute agreement of spatiotemporal variable means between testing sessions. For both walking and running, the average of each spatiotemporal variable during the first three trials was used in the analysis. MDC was calculated using the sample standard error of the mean (SEM), pooled standard deviation between both testing sessions (SDpooled), and ICC3,1:
MDC=1.96⋅SEM⋅√2
where
SEM=SDpooled⋅(1−ICC)
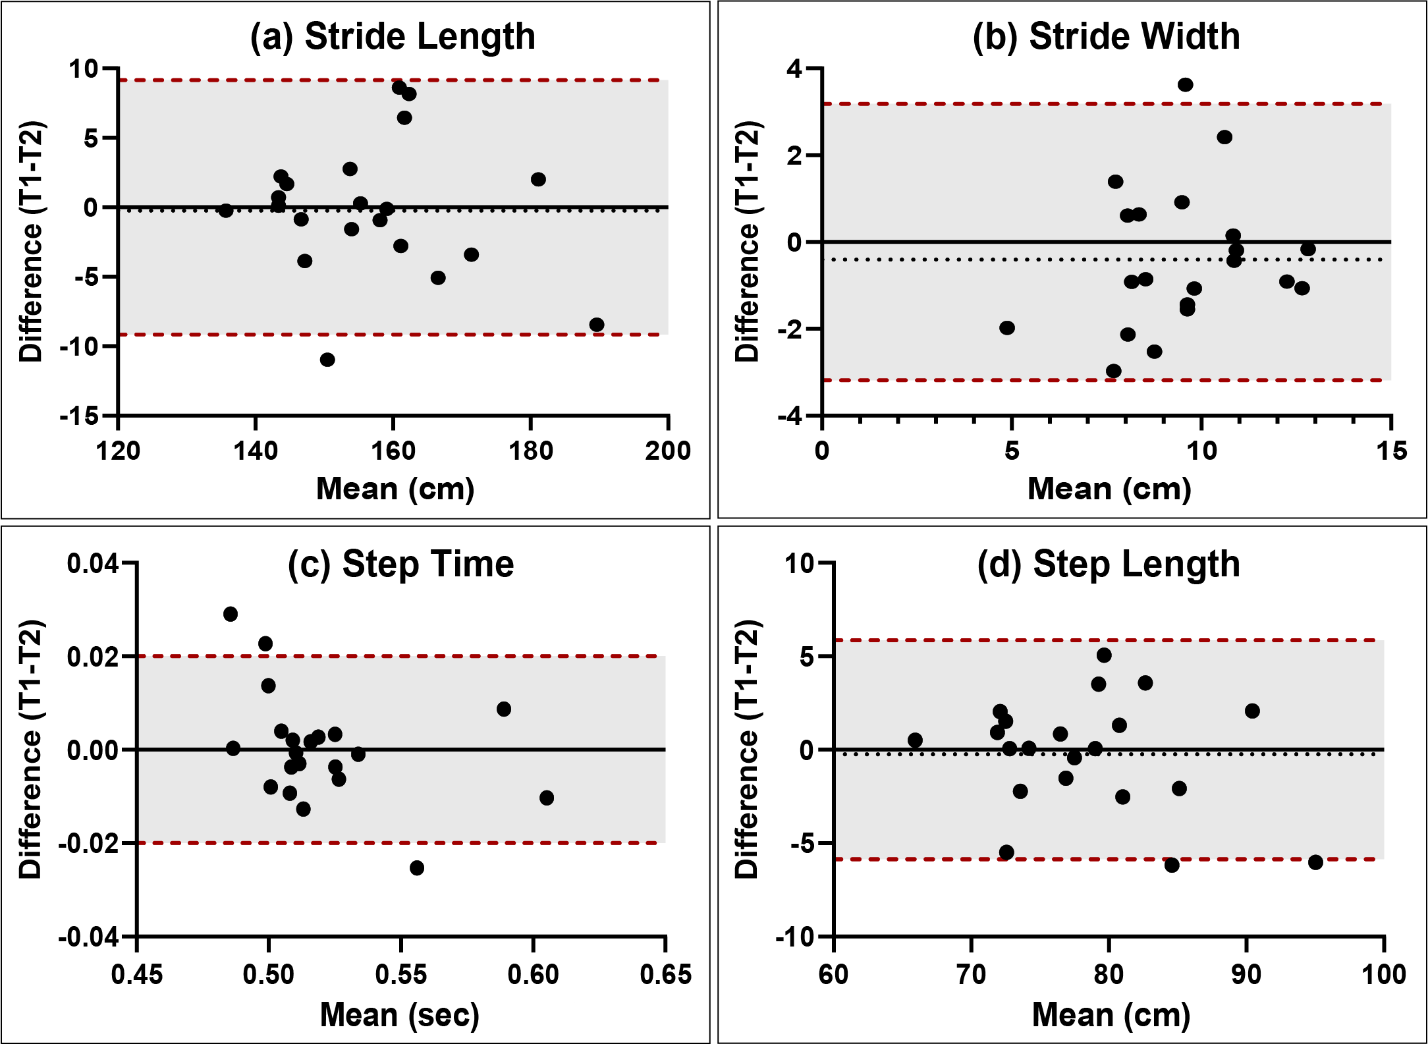
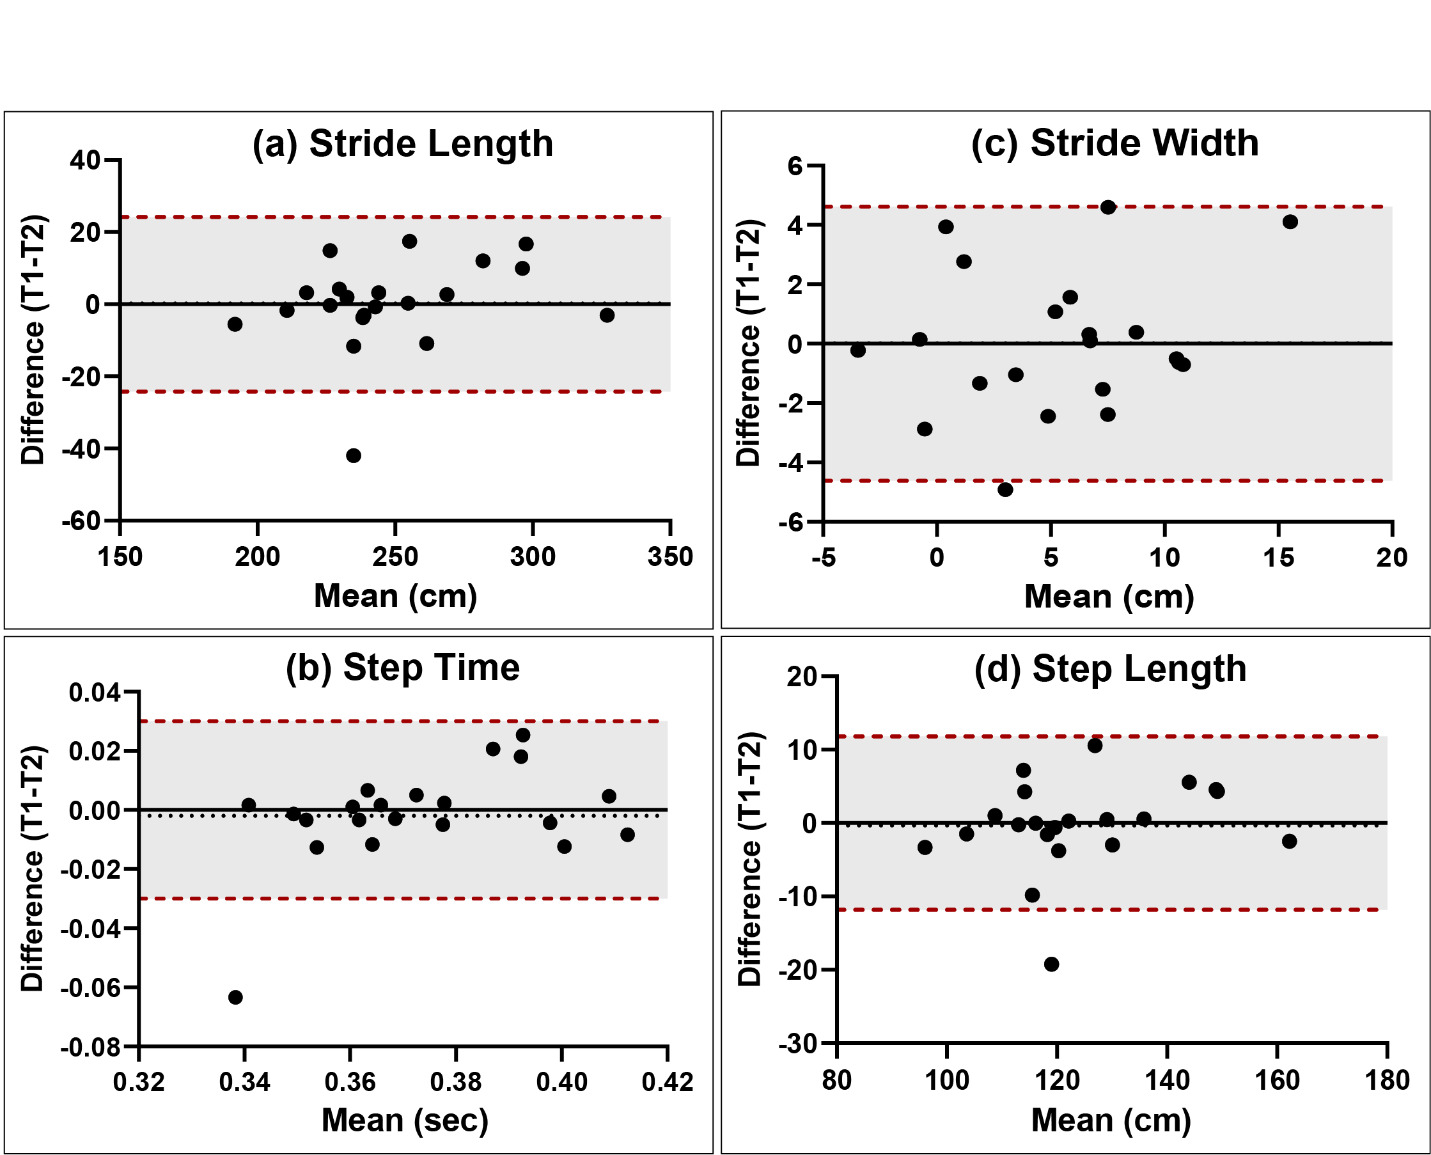
The standard error of the mean provides information about precision, or repeatability, of a measurement. Bland-Altman plots (the difference between sessions vs. the mean between sessions) were used to visualize the agreement between sessions for each variable. Bland-Altman plots can be used to evaluate the amount of measurement bias. For example, if the absolute value of the difference between measurements tends to be greater than zero, or ±1 MDC in this analysis, it would suggest bias in the measurement.32,33 Limits of agreement were set as ± 1 MDC to visually assess the magnitude of difference between measurements and observe whether a majority of measurement differences fell within the range of the MDC (i.e. would be interpreted as a true change or not).
RESULTS
Aim 1: Assessment of Additional Trials for Measurement Consistency
This analysis included data collected in a single testing session for 38 participants (21 female; age: 24.2±3.5 years). During walking, the number of footfalls per trial for a single limb for the first three, four, and five one-way trials were 2.75±0.38, 2.73±0.38, and 2.73±0.39, respectively. During running, the number of footfalls for the first three, four, and five one-way trials were 1.58±0.49, 1.57±0.49, and 1.58±0.49, respectively. Mean (SD) values for each spatiotemporal variable calculated from all footfalls during either the first three, four, or five trials are provided in Table 1 (walking) and Table 2 (running). ICC values ranged from 0.995-1.000 for all variables during walking and running, indicating excellent reliability of spatiotemporal variables when using three, four or five passes over the ZenoTM Walkway.
Aim 2: Establishing Test-Retest Reliability and Minimal Detectable Change
The mean of the first three trials for each spatiotemporal variable was used to assess test-retest reliability. Table 3 (walking) and Table 4 (running) show mean, ICC, and MDC values for each spatiotemporal variable. Bland-Altman plots of the mean value between T1 and T2 vs. the difference between T1 and T2 for stride length, stride width, step time, and step length are provided in Figure 2 (walking) and Figure 3 (running). Bland Altman plots for the remaining variables are available in Appendices A and B.

ICC values during walking ranged from 0.732-0.982. Variables with excellent test-retest reliability (ICC > 0.90) during walking on the ZenoTM Walkway were step length, stride length, step time, stride time, stance time, integrated pressure, toe angle, speed, and cadence. Variables with good reliability (ICC 0.75-0.90) were swing time, percent stance, percent swing, single support time, double support time, single support percent, and double support percent. Stride width (ICC=0.732) was the least reliable variable and the only walking variable with moderate reliability (ICC 0.5-0.75).
For running, ICC values ranged from 0.683-0.939. Variables with excellent test-retest reliability during running on the ZenoTM Walkway included step length, stride length, integrated pressure, and speed. Variables with good reliability included stride width, step time, stride time, percent stance, percent swing, and toe angle. Variables with moderate reliability during running included stance time, swing time, and cadence. No variables demonstrated poor test-retest reliability during running.
DISCUSSION
The purposes of this study were to 1) determine if up to two additional trials of walking and running on the ZenoTM Walkway are needed to produce consistent measurements of spatiotemporal variables, and 2) establish test-retest reliability and MDC values for common spatiotemporal variables measured during walking and running. The results of the first aim suggest that three one-way passes over the walkway are sufficient to collect reliable walking and running data in young, active individuals, when compared with using four or five one-way passes. This information can serve as a guideline for efficient and effective use of a ZenoTM Walkway in clinical and research settings. Fewer trials may reduce patient or participant fatigue and the burden of time on both the patient and clinician/researcher collecting the data.
Use of the ZenoTM Walkway and other instrumented pressure walkways has historically been limited to older adults or populations with known gait pattern abnormalities. The results of this study support its use in younger, more active populations and with higher-level movements like running. The use of pressure walkways with these movements would allow a deeper understanding of running without the time and cost of three-dimensional motion capture. Results from the second aim demonstrate that the ZenoTM Walkway is a reliable measurement tool for spatiotemporal characteristics of walking and running in a relatively young (15-35 years old) population, with most variables showing good to excellent reliability. Stride width, percent stance, and percent swing were the least reliable variables during walking with ICCs of 0.732-0.766, although they still show moderate to good reliability when measured by a ZenoTM Walkway. Although these values showed lower ICCs, they each demonstrated relatively small magnitude SEMs, supporting the precision and reliability of the measurements.34 Participants in this trial demonstrated comparable walking gait parameters to previously published data collected on the ZenoTM Walkway in samples of a similar age range.9 Minimal detectable change values indicate the amount of expected variability between testing sessions for each variable during walking or running. Variations larger than the MDC indicate true changes in gait pattern. The MDC values reported in this study are unique to the ZenoTM Walkway and may be useful in clinical and research settings to discern subtle but legitimate changes in gait parameters longitudinally or in response to intervention that would not otherwise be perceived. Further investigation is needed to determine whether these MDC values correspond to clinically-meaningful changes in spatiotemporal characteristics of walking and running.
This is the first study to quantify spatiotemporal parameters of running when using the ZenoTM Walkway. All spatiotemporal variables included in this analysis showed moderate to excellent test-retest reliability during running. Temporal variables including cadence, stride time, step time, and stance time were the least reliable with ICCs ranging from 0.683-0.771. In general, reliability decreased during running compared to walking. This reduction in reliability during running could be a result of measurement error at higher velocities. Despite showing reduced reliability, differences in measured spatiotemporal variables between sessions may still fall within the range of normal variability and not affect the larger goal of assessing for clinically-relevant changes in running characteristics.
Limitations of this study include the narrow inclusion criteria such that results may only be generalized to young, active individuals and not to older, active adults and sedentary young people. Future studies should aim to assess the reliability of specific high-level movements like hopping to increase the utility of the ZenoTM Walkway for young, athletic populations.
CONCLUSION
The findings of this study recommend a reliable measurement protocol of three one-way passes over the ZenoTM Walkway for assessment of walking or running. During both tasks, spatiotemporal variables of gait show moderate to excellent test-retest reliability when measured at least one day apart. The ZenoTM Walkway is a reliable measurement tool for gait analysis and can be used in the assessment and management of young, active populations without neuromusculoskeletal impairment or injury.
Conflicts of interest
None
Funding
This work was supported by the Nebraska Bankers Association and the University of Nebraska Medical Center. The funding sources had no involvement in study design, data collection, analysis, interpretation, manuscript writing, or decision to submit the article for publication.