
INTRODUCTION
Ankle sprains are among the most common musculoskeletal injuries. The greater incidence of lateral ankle sprains amongst athletes,1,2 military academy Cadets,3 and the general population4 presents a considerable challenge for rehabilitation professionals. In military academy Cadets, the incidence rate of ankle sprains between 2005 and 2007 was 58.4 per 1000 person-years with 64.1% of those sprains occurring during athletics.3 A history of prior injury leads to increased rates of ankle sprains.5,6 Military Cadets with a prior ankle sprain had between three and six times the risk of sustaining an ankle sprain during basic training than Cadets without an ankle sprain history.7 Unfortunately, an initial ankle sprain has a high rate of recurrence and often leads to chronic ankle instability (CAI), which can greatly impact quality of life.8–11
One impairment routinely identified in patients after an ankle sprain is decreased balance control.12 Static balance is often impaired immediately after an ankle sprain and likely improves approximately two to four weeks following the injury.13 Clinicians evaluating and treating patients after ankle sprains frequently use non-instrumented tools to assess static balance and assess risk for chronic ankle instability.14,15 One such test, the Balance Error Scoring System (BESS), may be able to detect individuals with and without chronic ankle instability and requires the clinician to tally “errors” while the patient attempts to maintain a static position for a prescribed length of time.14–16 The BESS demonstrates moderate reliability (ICC 0.57 – 0.74) in assessing static balance;17,18 however, it may not be able to detect subtle deficits in static balance, such as those present in the late stages of ankle sprain rehabilitation. An instrumented assessment of static balance using a force plate can detect impairments after an ankle sprain with greater sensitivity than clinician scored assessments.16 The ability to detect subtle deficits in static balance during recovery from ankle sprains may result in decreased rates of injury recurrence and risk for chronic ankle instability.14,15 However, the requirement of expensive technology to detect subtle deficits in static balance may not be practical for clinical implementation.
Mobile technology may be a portable and affordable solution to objectively measure static balance. Previous studies have explored the role of wearable inertial sensors to evaluate static balance in patients with Parkinson’s Disease, concussion, fall risks, and diabetic neuropathy.19 Recently, the addition of a wearable inertial measurement unit (IMU) during the BESS produced reliable, clinically accessible objective BESS scores without requiring human judgment from a trained test administrator.20 The Sway Mobile Balance Application (SWAY App) similarly uses the accelerometer in a modern smart phone or tablet to assess static balance during a modified BESS (mBESS). The mBESS administered by the SWAY App demonstrated good test-retest reliability in healthy participants (ICC = 0.76)21 and is often used for concussion baseline testing in youth and collegiate athletics (r = 0.75-0.78).22 This commercially available tool may also be useful for clinical assessment of static balance in individuals with acute ankle sprains.
The primary purposes of this study were to determine the ability to differentiate between those with ankle sprain versus controls (construct validity) and ability to detect change over time (responsiveness) of a mBESS assessment using a mobile device application to evaluate static balance after an acute ankle sprain. A secondary purpose was to determine the relationship between the mobile device application and laboratory-based static balance assessment (concurrent validity). It was hypothesized that the application could differentiate individuals with an ankle sprain from healthy controls, measure improvements in balance control over time, and demonstrate strong correlation with the laboratory assessments of static balance control.
METHODS
Study Design
This study was a case-control design. The first primary aim compared static balance between participants with an acute ankle sprain with a group of healthy controls (construct validity). The second primary aim assessed static balance following a four-week rehabilitation program (responsiveness). The secondary aim determined the relationship between static balance as assessed by the SWAY application and laboratory-based static balance assessments using a laboratory-grade force plate (concurrent validity).
Participants
Military academy Cadets were recruited through brochures and announcements within the Arvin Cadet Physical Therapy Clinic within Keller Army Community Hospital. The study was approved by the Naval Medical Center Portsmouth Institutional Review Board, and all participants provided written informed consent prior to participation.
Participants in the injured group were diagnosed with an acute grade I or II lateral ankle sprain by a physical therapist practicing in a direct-access musculoskeletal clinic. Acute was defined as occurring within the past two weeks at the time of the initial evaluation. Participants in the healthy group were Cadets free from any lower extremity injury including an ankle sprain within 12 weeks of enrollment. Participants with a history of lower extremity surgery involving the foot or ankle, concussion within the past six months, or any disorders known to affect balance (i.e. knee sprain, lumbar radiculopathy, etc) were excluded from both groups.
Procedures
All participants completed a baseline assessment that included, in order, pain (via the Numerical Pain Rating Scale), self-reported function, (via the Single Assessment Numeric Evaluation and Quick-Foot and Ankle Ability Measure), ankle dorsiflexion range of motion (weight-bearing lunge test), dynamic balance (Y-Balance Test/Modified Stare Excursion Balance Test)), and static balance (SWAY modified Balance Error Scoring System).
Numerical Pain Rating Scale (NPRS)
The NPRS measures a patient’s subjective report of pain on an 11-point scale with ratings ranging from 0 (no pain) to 10 (worst possible pain). Participants reported their current pain and maximum pain over the past seven days. This scale is a valid and reliable measure of global pain intensity, with an MCID of two points.23,24
Single Assessment Numeric Evaluation (SANE)
The SANE is a global rating scale that is a reliable and responsive (CVME <1%, MCID 7-19%) tool of global function.25,26 The SANE is scored on a 0-100% scale with 0% being unable to function and 100% equaling full function.
The Quick Foot and Ankle Ability Measure (Quick-FAAM)
The Quick-FAAM is a 12-item questionnaire shortened from the 29-item Foot and Ankle Ability Measure (FAAM).27 The FAAM is a reliable, valid, and responsive (ICC 0.82, MDC 6.5%) measure of ankle function28–31 and compares favorably to other self-report instruments that measure ankle instability in categories of test-retest reliability, internal consistency, construct validity, and responsiveness.32
Weight-Bearing Lunge Test (WBLT)
Ankle dorsiflexion range of motion is often limited in people with ankle instability12,33 and can influence performance on balance tasks.34 Performance of the WBLT is reliable (ICC 0.85 – 0.96) and demonstrates adequate responsiveness (MCD 3.7 – 3.8 degrees) in the clinical assessment of ankle dorsiflexion range of motion.35 Both the involved and uninvolved ankles were tested. Participants were instructed to attempt to place their ankle in maximum dorsiflexion while maintaining full foot contact with the floor while the investigator placed a digital inclinometer in the sagittal plane along the anterior tibia to measure the WBLT.35,36 Hand support on a wall was allowed during all test trials. Participants were instructed to move “as far as you can” through their entire available range without stopping because of pain. Three practice trials were followed by three record trials and the average of the three trials was recorded.
Dynamic Balance: Y-Balance Test Lower Quarter (Modified Star Excursion Balance Test)
The Y-Balance Test Lower Quarter (YBT-LQ) is an instrumented version of the Star Excursion Balance Test. The test is performed by standing on one leg without shoes while reaching in three different directions (anterior, posteromedial, and posterolateral) with the other leg.37 The YBT-LQ has good to excellent interrater reliability (0.85 – 0.91).38 Participants completed six practice trials in each reach direction (anterior, posteromedial, and posterolateral) bilaterally prior to the assessment to account for learning effects.39 Participants then performed three record trials, the average of which was recorded. If any errors occurred (i.e. touching the foot to the ground), the trial was terminated and not recorded. Limb length was measured from the anterior superior iliac spine (ASIS) to the medial malleolus. The recorded distances were normalized to limb length then summed to calculate a composite score.
Modified Balance Error Scoring System (mBESS)
The SWAY App uses a proprietary algorithm to calculate a balance score using information collected from the mobile device’s inertial sensors during testing. The SWAY App mBESS consists of five test positions all performed for 10 seconds with the participant’s eyes closed on a hard level surface. The positions were feet together, tandem involved (injured leg behind uninjured leg), tandem uninvolved (uninjured leg behind injured leg), single leg stance involved, and single leg stance uninvolved. For the injured group, the tandem and single leg test positions were categorized as involved and uninvolved leg based on the side of ankle injury. For the healthy control group participants, the involved side (right or left) was categorized the same as their matched injured participant. The participant held the mobile device administering and recording postural sway during the mBESS flat against their chest with elbows maintaining contact with the trunk. After an acclimation trial with the SWAY App and mobile device, the participant performed three trials of the mBESS. SWAY mBESS scores are unitless, derived from undisclosed proprietary manufacturer calculations, and can range from 0 to 100, with greater scores indicating better balance.
Prior to performing the modified version of the BESS, the investigator applied a retroreflective marker to the mobile device (Figure 1). Concurrently with measurements taken from the mobile device, center of pressure (COP) was captured with a force plate (AMTI, Watertown, MA) sampling at 1200 Hz. Ground reaction forces were recorded using Vicon Nexus software (Vicon, Oxford UK) and processed in Visual3D software (C-Motion, Germantown, MD USA). Force plate COP data were filtered using a zero-lag, 2nd order, low-pass Butterworth filter with a cut off frequency of six Hz. Root-Mean-Square (RMS) sway area was calculated about the mean anterior-posterior (A-P) and medial-lateral (M-L) COP displacement (disp) (RMS = along with mean and peak A-P and M-L COP velocities using a custom LabVIEW program (National Instruments Corp., Austin, TX, USA).

Participants in the injured group then completed four weeks of ankle of rehabilitation based on the current standard of care for acute ankle sprains.5 Rehabilitation was performed by six sports physical therapy fellows and consisted of a combination of in-clinic therapy and at-home exercise programs with interventions to restore normal range of motion, strength, and balance. Balance training included single leg stance activities progressing in level of difficulty (i.e. single leg stance with eyes open to single leg stance with eyes closed over stable surfaces to over unstable surfaces). Rehabilitation was progressed based on patient presentation and symptom response. Details of the ankle sprain rehabilitation program and criteria for progression can be found in Appendix A. Upon completion of four weeks of rehabilitation, participants in the injured group were reassessed using the same protocol described at baseline.
Statistical Analysis
Descriptive statistics for age, height, and body mass were calculated with means and standard deviations reported. Differences in overall and mean SWAY scores for each test position between the injured and healthy groups were compared using an independent t-test. A paired t-test compared the mean overall and individual test position SWAY scores of the injured group at baseline to four-week follow-ups. Cohen’s d (d) effect sizes were calculated, with 0.8 indicating a large, 0.5 indicating a medium, and 0.3 indicating a small effect.40 Additionally, Pearson correlations explored the associations between SWAY scores and a laboratory-based measure of static balance from the force plate (COP RMS and velocities). Correlation coefficients were interpreted as strong (r 0.75), moderate-good (r = 0.50 – 0.74), low-fair (r = 0.25 – 0.49).40 All tests were two tailed and the significance level for all analyses was set at α = .05. A Bonferroni correction was used to control for family-wise type 1 error with multiple comparisons when testing the hypotheses of the ability of SWAY scores to distinguish between healthy and injured participants and to detect change over time (six comparisons, p = .008). All statistical analyses were completed using SPSS (version 28; IBM Corp, Armonk, NY, USA). Secondary analysis of subjective functional outcomes, ankle dorsiflexion range of motion, and dynamic balance included independent t-tests to examine differences between participants with ankle sprain and health controls and paired t-tests to examine differences in participants with ankle sprain at baseline and after four weeks of rehabilitation.
RESULTS
Forty-two military Cadets consented to participate in this study: 22 (5 Females) with acute ankle sprains (injured group) and 20 (5 Females) healthy controls (healthy group). The mean ± SD time from the evaluation for ankle sprain to first data collection was 6.1 ± 3.2 days. Two participants in the injured group did not complete their second data collection after completion of the standard rehabilitation and their data were not included in the analysis of responsiveness over time within the injured group; their data were used in the comparison with the healthy controls. There were no statistically significant differences in age, height, and weight between groups (Table 1).
Construct Validity
Participants with acute ankle sprains had lower total SWAY scores than healthy participants (p =0.004) with a mean overall SWAY score of 74.4 ± 15.3 in injured versus 85.6 ± 6.5 in healthy participants. Injured participants scored worse than healthy participants in two mBESS stances: Tandem Involved (injured leg behind uninjured leg) [71.5 ± 22.4 for injured and 88.6 ± 8.5 for healthy; p = 0.002] and single leg involved [58.6 ± 21.7 for injured and 76.7 ± 14.2 for healthy; p = 0.002] (Table 2).
The magnitude of SWAY score difference between injured and healthy groups was greatest during the single leg involved test position (d = 1.01). SWAY scores were not significantly different between injured and healthy groups during the tandem uninvolved (uninjured leg behind injured leg) and single leg uninvolved test positions. The injured and healthy groups were also significantly different in all self-report and clinical measures assessed (Table 3).
Responsiveness
Injured participants’ overall SWAY scores significantly increased from 74.2 ± 16.1 at baseline to 82.7 ± 9.5 after four weeks of ankle rehabilitation (p = .004, mean assessment interval: 32.4 ± 6.5 days) (Table 4). Overall SWAY scores for healthy participants (85.6 ± 6.5) were not significantly different from the SWAY scores for injured participants after four weeks of ankle rehabilitation (p = 0.17). Individual test position mBESS scores of the injured participants significantly improved between baseline and follow-up assessments in the tandem involved position (70.3 ± 23.2 at baseline and 84.7 ± 13.3 at follow-up; p = 0.006) and single leg involved position (61.7 ± 20.0 at baseline and 72.5 ± 12.9 at follow-up; p = 0.008) (Table 4).
The test position with the greatest magnitude improvement in SWAY score between baseline and follow-up assessment times was the tandem involved position (d = 0.70). There were no differences in SWAY scores between baseline and follow-up assessment for the feet together and single leg uninvolved test positions. All self-reported and clinical measures also significantly improved between the baseline and four-week assessments (Table 5).
Concurrent Validity
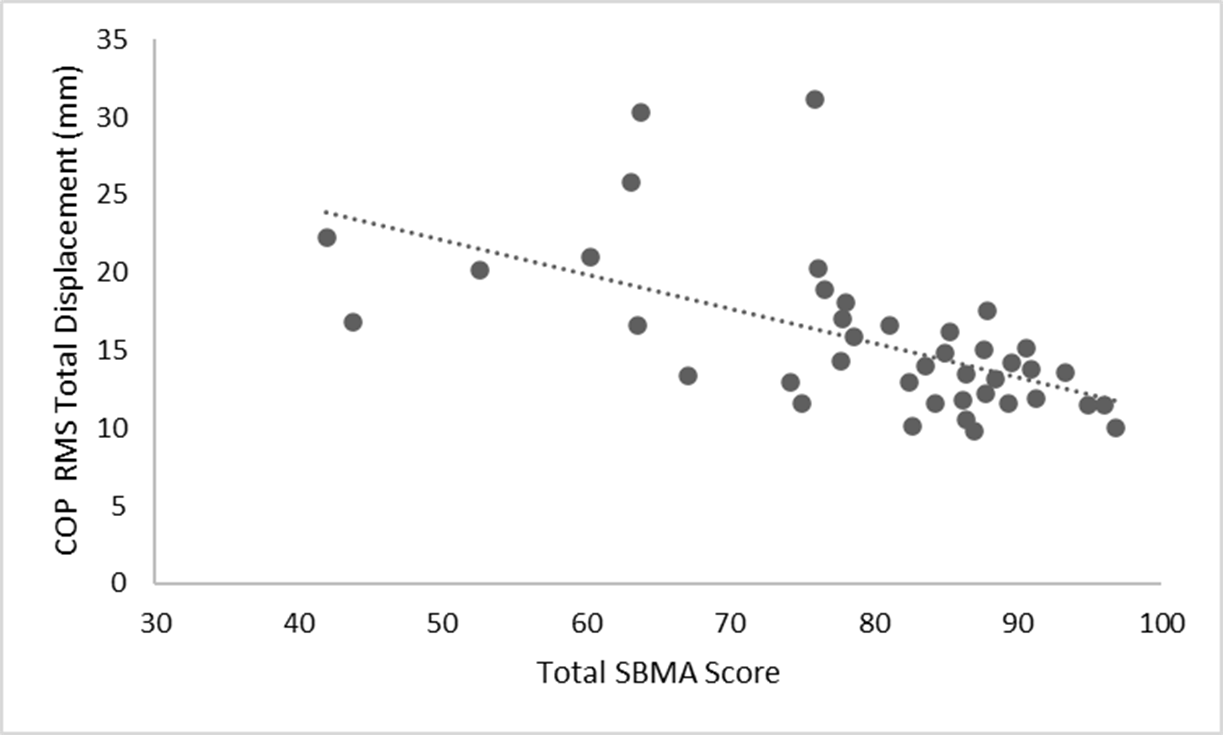
Total SWAY scores were moderately negatively correlated to RMS total displacement of COP (r = -0.59, p < 0.001) (Figure 2).
_root_mean_square.png)
DISCUSSION
The purposes of this study were to assess the construct validity, responsiveness, and concurrent validity of the SWAY App for detection of differences in static balance in individuals after an acute ankle sprain. The results of this study confirmed the hypotheses that the mBESS measured with the SWAY App is a valid and responsive measure of static balance in individuals recovering from a grade I or II lateral ankle sprain.
The SWAY differentiated the injured group at baseline and the healthy group, with a large effect size for the total SWAY score (d = 0.94). Additionally, the SWAY detected change in static balance for the injured group after four weeks of ankle rehabilitation, with a medium-large effect size for the total SWAY score (d = 0.74). Total SWAY scores of the healthy group (85.6 ± 6.5) in this study agree with previously published normative values for 20-year-old males (85.8 ± 11.5) and females (89.0 ± 11.2).41
Identifying a streamlined protocol for static balance assessment may reduce the number of test positions within the SWAY needed to assess static balance. The total SWAY score had a smaller effect size than the individual single leg involved test position (d = 0.94 versus d = 1.01) when comparing injured and healthy participants, suggesting that the individual test position may be the most efficient assessment in differentiating between these two known groups. For determining change over time, the single leg involved test position had a similar effect size to the total SWAY score (d = 0.66 versus d = 0.74), again suggesting that the individual test position of single leg involved may be the most efficient assessment. In a study comparing center-of-mass acceleration measurements from a mobile deice versus motion capture in healthy individuals, single leg stance on firm and unstable surfaces similarly demonstrated the highest correlations.42 Further evaluation of a simplified SWAY testing procedure with only the single leg involved test position would better determine the most efficient method for assessing static balance with the SWAY mBESS after ankle sprains.
These findings demonstrate concurrent validity, with the mBESS measured by the SWAY App having a moderate, negative correlation to the reference standard of RMS total displacement of COP (r = -0.59, p < 0.001). Previous research conducted by Dewan et al. evaluating the relationship between the SWAY and COP measured by a force plate in healthy young adults observed significant negative correlations ranging from low-fair to moderate-good across multiple test conditions.43 In the present study, the magnitude of correlation was stronger (moderate-good) between the SWAY and RMS COP total displacement. Additionally, this study assessed the aggregated SWAY total score in relationship to COP RMS total displacement across all test positions, while Dewan et al. compared measures of static balance within each test position.
The ability of the SWAY App to provide quantitative data during the mBESS may be a more sensitive assessment of static balance than raters attempting to subjectively count errors. Traditional qualitative balance assessment trials with increased postural sway but no errors could hypothetically achieve a perfect score using observational assessment tools while the SWAY App is able to capture postural sway with or without errors. Additionally, rehabilitation professionals working in telemedicine could employ this technology to assess balance remotely and use that information to recommend rehabilitation programs better tailored to specific patient impairments.
This study has several limitations. The population assessed was a relatively young, healthy, and active population, which may not generalize to other population groups. Static balance was only assessed at two time points in recovery. Adding additional assessments through the first six weeks of recovery from ankle sprain may increase understanding of variability over time. Also, long term follow-up assessments were not completed, which limits the ability to determine the sensitivity of the SWAY to detect subtle, lingering deficits in static balance. Future research in this area should incorporate more frequent assessments and follow participants for a longer duration to attempt to determine patients at increased risk for CAI. Identifying patients at risk for CAI relatively early in rehabilitation may allow more effective intervention and justify additional focus on balance control training even after the most obvious ankle sprain symptoms have resolved.
CONCLUSION
The SWAY can identify deficits in static balance in patients after acute ankle sprains and is responsive to improvements in static balance during recovery. SWAY scores have moderate to strong negative linear relationships with laboratory-based assessments of balance control illustrating the application’s technical sensitivity. Overall, this study demonstrates the validity and responsiveness of the SWAY and expands the utility of the clinical assessment into musculoskeletal conditions, specifically, acute ankle sprains. The SWAY may warrant inclusion in the routine assessment of static balance after ankle sprain.
DISCLAIMER
The opinions or assertions contained herein are the private views of the authors and are not to be construed as official or reflecting the views of the United States Army or Department of Defense.
Conflict of Interest
The authors report no conflicts of interest.
Acknowledgements
This work was supported by the Telemedicine and Advanced Technology Research Center (TATRC) at the US Army Medical Research and Development Command.