
INTRODUCTION
Performance in sports can be broadly defined as how well an individual executes a specific task or activity. In athletic settings, performance is commonly assessed using specific, standardized tests, which help track progression, evaluate overall athleticism, and screen for potential injury risk.1,2 These include tests assessments of muscle strength and hop distance. Horizontal hop distances are reliable and valid measures of lower limb function and are frequently used in rehabilitation from unilateral lower limb injury, and as measures of agility, strength, and power in sports.3,4 The Single-leg Hop for Distance (SLHD) test is a combined measure of hop performance that requires power, strength, and balance.5
Poor dynamic balance may indicate reduced hop distances, since the ability to maintain the center of mass within the base of support is critical in both the propulsion and landing phases of a horizontal hop.1 Better dynamic balance has previously been associated with better horizontal hop performance.6
While the Y-Balance Test (YBT) has primarily been used to assess injury risk, it may also have relevance for performance screening.7–9 Previous research has demonstrated significant positive associations between balance and hip muscle strength,10 and greater lower limb muscle strength has been associated with better horizontal hop and jump performance.11–16 However, these relationships have largely been examined separately.10–19 To date, no study has investigated whether the association between dynamic balance and hop performance differs across levels of hip muscle strength. Understanding potential subgroup differences may provide valuable insight for future research and clinical practice. If the association is stronger in one subgroup, this would suggest that the predictive value of dynamic balance varies according to strength capacity. Such insights could inform targeted screening, allowing clinicians to prioritize balance testing for individuals most likely to benefit. For example, if the association is more pronounced in individuals with lower hip muscle strength, clinicians may prioritize balance testing in this subgroup, while relying more on strength assessment in those with higher strength levels. Furthermore, establishing the predictive utility of the YBT for horizontal hop performance may therefore extend its application beyond injury risk screening and support its use in both sports and rehabilitation contexts.
The objectives of the present study were to i) investigate whether better dynamic balance predicts better horizontal single-leg hop performance in Danish volunteers without musculoskeletal conditions, and ii) investigate whether this predictive association varies between groups with maximal isometric hip muscle strength below or above the sample mean in hip flexion, extension, abduction, and adduction. Since performance in a horizontal hop requires both hip muscle strength and dynamic balance, it was hypothesized that an increase in dynamic balance may be associated with an increase in hop performance. Additionally, it was hypothesized that the predictive association of better dynamic balance on better horizontal hop performance varies across subgroups of participants characterized by isometric hip muscle strength below or above the sample mean.
MATERIALS & METHODS
This article followed the STROBE (Strengthening the reporting of observational studies in epidemiology) checklist for cross-sectional studies.
Study Design
This study employs a cross-sectional design to investigate if dynamic balance predicts better performance in a horizontal single-leg hop. The data was primarily collected for use as reference data for participants in the MovetheHip trial, a randomized controlled trial comparing exercise and patient education to usual care in patients with hip dysplasia.20 The present study represents a cross-sectional analysis of these reference data conducted prior to randomization and independent of any trial interventions.
Participants
Participants were recruited between September 2021 and January 2024 from personal networks, invitations from social media (Facebook, LinkedIn) as well as posters on various institutions and companies in Aarhus and Horsens, Denmark (e.g., schools, universities, university colleges, and hospitals). Participants were included in the study if they were between 18 and 50 years of age. This age range was chosen to include skeletally mature adults and to minimize the influence of age-related degenerative changes, while reflecting the population of the randomized controlled trial for which these data were collected as reference data.20 Participants were excluded if they met one or more of the following criteria: i) current pain in the back or lower extremities, ii) surgery within the previous two years in the back or lower extremities affecting the function of the hip, iii) a BMI >35, iv) performing sports at elite level, v) any physical-, neurological-, rheumatological, or other known condition affecting the function of the hip, or vi) inability to read and respond to oral and written material in Danish.
The study was conducted in accordance with the Helsinki Declaration and was approved by The Central Denmark Region Committees on Health Research Ethics (record number: 1-10-72-1-21) and the Danish Data Protection Agency (record number: 1-16-02-337-21). All participants gave written informed consent to participate.
Procedures
Self-reported participant characteristics were collected and managed using REDCap (Research Electronic Data Capture, Vanderbilt University, Nashville, TN, USA; version 14.1.2) prior to clinical assessment.21 Participants received a link (via e-mail) to a webpage enabling them to respond to a questionnaire regarding self-reported characteristics one week prior to the clinical assessment. A new e-mail was distributed including a reminder three days later if the questionnaire was not completed. Participant characteristics comprised age, sex, marital status, educational attainment level, physical activity, and sports activity level, as well as confidence in their hip during the horizontal single-leg hop. Marital status was classified into two categories: i) single or divorced and ii) married, cohabiting, or residing with family members. Physical activity was classified based on adherence to the World Health Organization’s (WHO) guidelines for Physical Activity using three validated questions adopted from Moholdt et al. (how often do you exercise; how hard do you exercise; and how long time do you exercise?).22 Participants who engaged in either 150 minutes of moderate intensity exercise each week, 75 minutes of vigorous intensity exercise each week, or a combination of both were classified as adhering to the guidelines. Marital status, educational attainment, and self-reported confidence were collected for descriptive and contextual purposes only and were not included in the statistical analyses.
Further characteristics and outcome measures were measured at a clinical assessment either at a university college or at a department of Physiotherapy and Occupational Therapy in Aarhus and Horsens, Denmark. In accordance with the General Data Protection Regulation (GDPR; Regulation (EU) 2016/679),23 data categories containing fewer than five participants were not reported directly. To ensure participant anonymity, these data were either aggregated or redistributed across existing categories, as appropriate.
At the clinical assessment, which took approximately one hour to complete, bodyweight (kg) and height (m) were measured to calculate BMI (kg/m2). Limb length and moment arm were measured on the participant’s right leg from the anterior superior iliac spine to two different visible marks, one located five centimeters proximal to the basis of the patella and the other five centimeters proximal to the lateral malleolus of the ankle.
The assessment was conducted by one of six trained testers with a minimum of 10 training hours, who had completed a minimum of six test assessments. All participants were given the same standardized verbal and visual instructions. All tests were performed on the right leg only, and the test order was as follows: dynamic balance, hop performance, and maximal isometric hip muscle strength. This approach was chosen to standardize the protocol and reduce testing time and participant burden. In healthy adults without musculoskeletal conditions, dominant and non-dominant limb differences in hip muscle strength and functional performance have been reported to be absent or small.11 Therefore, assessment of one consistently selected limb was considered appropriate for the purpose of this study.
Dynamic balance
The primary assessment was dynamic balance in meters measured with the YBT using the Y-Balance Test Kit™ (Perform Better, West Warwick, Rhode Island). The YBT is a valid and reliable tool to measure dynamic balance.7–9 A standardized test protocol24 was followed and applied the modifications reported by Gonell et al.9 The participants were instructed to stand barefoot on the right foot with toes behind a marked line. Following this, they were instructed to push the reach indicator of the Y-Balance Test Kit™ as far as possible in each test direction (anterior, posteromedial, and posterolateral direction in relation to stance foot) and return to the center maintaining single-leg stance. Participants were given six practice trials in each direction to reduce potential learning effects.8,25 For each test, the participants were given three trials in each direction and the greatest reach distance of the three was recorded. The trials were discarded and repeated if the following was observed: i) the participant lost balance during the exercise, ii) the heel of the stance foot was lifted, iii) the foot could not maintain contact with the distance indicator, iv) the participant supported their weight on the distance indicator or floor, v) the participant lost balance during return to the starting point. The trial was excluded if the participant was unable to maintain single-leg balance. Reach distance was normalized for limb length (m) (reach distance/lower limb length) to allow comparison between participants. Also, the reach distance of the three directions was summed (anterior + posteromedial + posterolateral) to provide a Composite Reach Distance (CRD) in meters, which was found reliable by Plisky et al.24 The CRD was normalized for limb length in meters (CRD/(3 x lower limb length)) for analysis of the participant’s ability to maintain their balance through a series of motions.9,10
Horizontal hop performance
Horizontal hop performance in meters was the outcome in the present study. Hop performance was assessed using the SLHD test, adhering to a standardized protocol11 with specific modifications as outlined by Ageberg et al.3 The SLHD test is recognized as a reliable method for evaluating performance.11 Participants were instructed to stand barefoot on their right leg with toes behind a marked line and with both hands behind their back. Participants then performed a horizontal forward hop as far as possible maintaining their balance for 2–3 seconds upon landing. The hop distance was measured in meters from the marked line to the posterior aspect of the heel on the landing foot using an inflexible tape measure.
To mitigate potential learning effects, participants were allowed two practice trials. For the test, the participants were given three trials of which the longest horizontal hop distance was registered. The trial was discarded and repeated if the participant deviated from protocol during the trial or lost balance during landing. If the participant had a 10-centimeter increase between the second and the third hop, additional trials were performed until the participant performed an increase of less than 10 centimeters. The trial was excluded if the participant was unable to perform a single-leg hop.
Hop distance in meters was normalized for height in meters (hop distance/height) to facilitate comparison between participants. Following the performance test, the participant was asked to indicate the level of confidence in their hip and groin area when performing the SLHD test using a bipolar visual analogue scale. The result was measured on a scale from 0 (worst) to 100 (best). This measure was included to capture perceived confidence during task performance, as such perceptions may influence functional performance even in asymptomatic individuals.
Maximal isometric hip muscle strength
Maximal isometric hip muscle strength in Nm/kg was used for subgroup analysis. The testers measured maximal isometric hip muscle strength of the right hip of all participants using a handheld dynamometer (JTECH Commander ECHO Wireless Muscle Tester) with external belt fixation in hip flexion, extension, abduction, and adduction. Visible marks were placed 5-centimeters proximal to the lateral malleolus and 5-centimeters proximal to the base of the patella to guide the placement of the transducer for the handheld dynamometer and to allow measurement of moment arms. Handheld dynamometer with external fixation is found to be reliable and acceptable for assessment and evaluation of maximal hip muscle strength in athletes with hip, groin, and hamstring injuries, and is assumed to be reliable in individuals without musculoskeletal problems.26
The test order for each hip strength assessment was randomized to reduce the risk of systematic bias. Hip extension was measured in prone position. Hip abduction and hip adduction were measured in supine position. Hip flexion was measured with the hip positioned at 90° of flexion in an upright sitting position. Participants were given two submaximal practice trials in each direction to reduce potential learning effects. The measurements were taken a minimum of four times in 5-second periods at maximum exertion with a 30-second break between each measurement. If the last of the four measurements had the highest value, the test continued until the value decreased. A maximum of eight trials was allowed. Data were normalized for bodyweight in kilograms and moment arm in meters using the formula: (moment arm x Newton)/bodyweight, expressed as Nm/kg.
Data management
All data were collected in REDCap (Research Electronic Data Capture, Vanderbilt University, Nashville, TN, USA; version 14.1.2), hosted at Aarhus University, Aarhus, Denmark. REDCap is a secure, web-based software platform designed to support data capture for research studies with two-factor authentication. Data were stored and handled in accordance with the data protection act and the data protection regulation.21
Statistical analysis
Histograms and quantile-quantile plots were used to test for normality. Parametric continuous data were reported as means with standard deviations (SD) and otherwise as medians with interquartile ranges (IQR). Linear regression analyses were performed to investigate if better dynamic balance predicted better hop performance. Performance data was the dependent variable, and balance data was the independent variable. Additionally, stratified linear regression analyses were performed to investigate possible differences in slopes from the regressions between subgroups of hip muscle strength below or above the sample mean in each of the four directions.9 The assumptions for the linear regression models were met (independent observations, linear association, constant variance of residuals, and normal distribution of residuals). Z-tests assuming equal slopes were used to investigate whether the regression coefficients were significantly differed between subgroups. RStudio (Version: 2024.04.1+748), an open-source integrated development environment (R 3.6.0+) was used for data analysis. Results were considered statistically significant if p<0.05.
Sample size
No formal sample size calculation was performed, as the primary aim of the study was to establish reference data rather than to detect an intervention effect or test a specific hypothesis. The sample size was determined pragmatically to ensure a sufficiently large reference population for a randomized controlled trial.20 Additional participants were included to strengthen the independent relevance of the present dataset, and efforts were made to achieve a more balanced sex distribution than in the trial population to enhance generalizability.
RESULTS
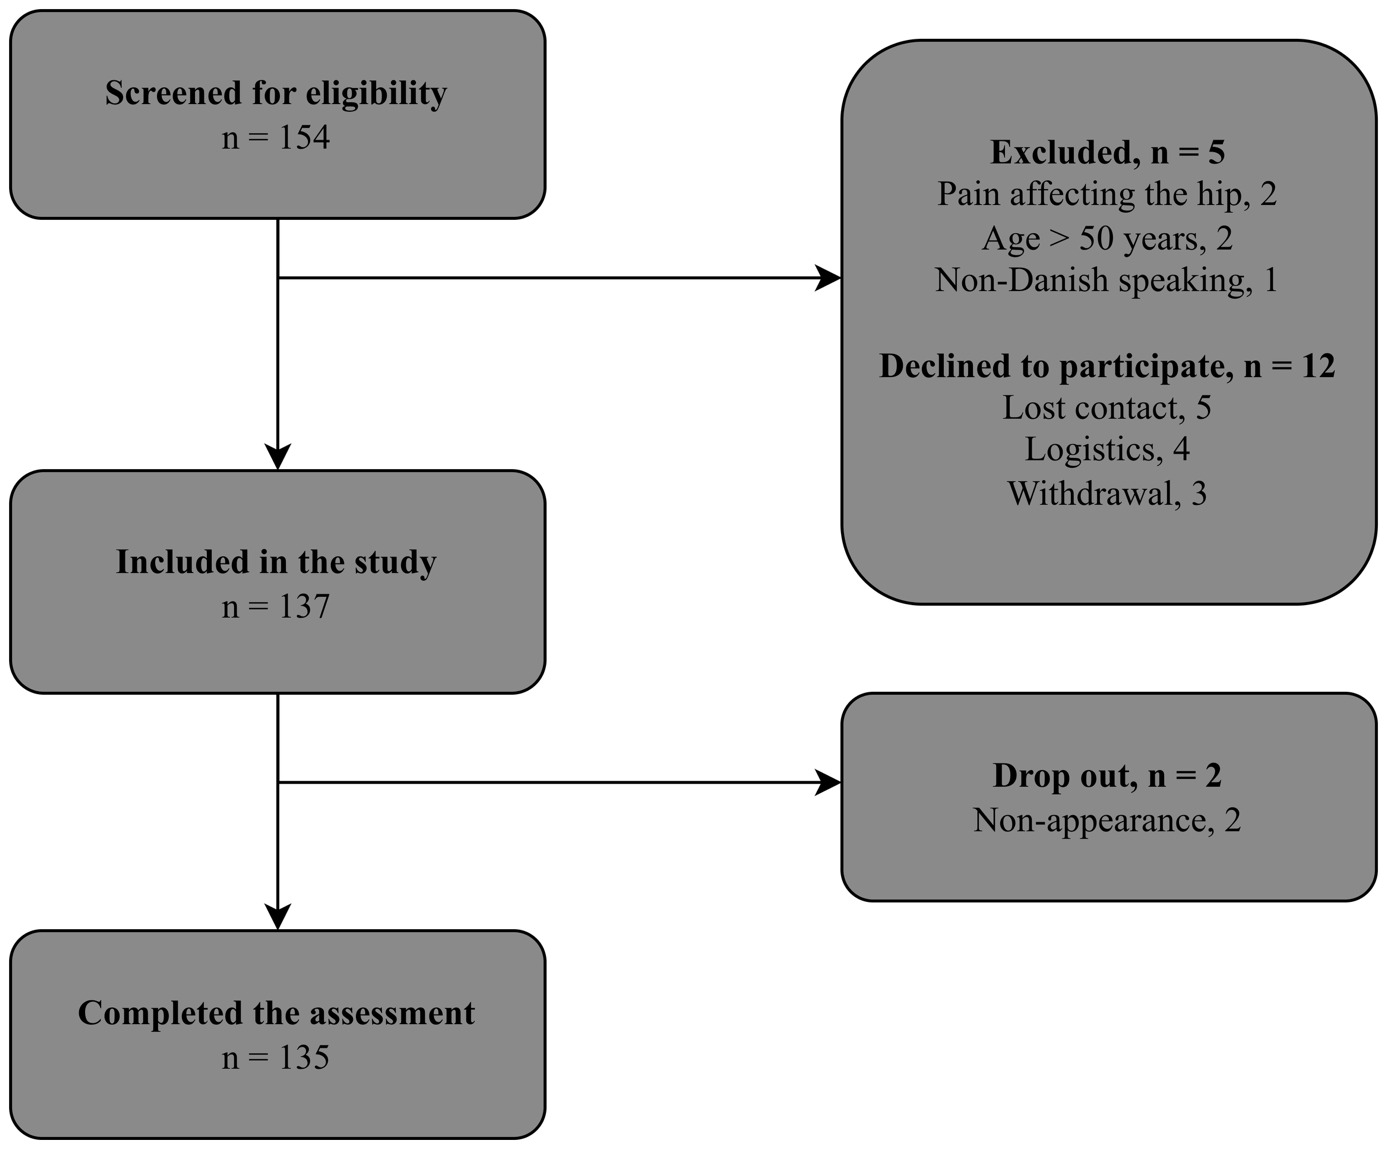
A total of 154 participants were assessed for eligibility (Figure 1). Of those assessed for eligibility, 12 individuals declined to participate, five individuals were excluded, and two individuals did not appear for their assessment leaving 135 participants providing informed consent to participate. The age of the 17 non-participants ranged between 21 and 45 years, and three were males.
Participant characteristics
Participant characteristics are shown in Table 1. The group of participants was evenly distributed by gender, with a median age of 25 (range: 18-49) years and a BMI of 24.06 (SD: 3.18) kg/m2. More than half of the participants (59%) had completed 10-15 years of education, and more than two-thirds (70%) were either married, in a relationship, or living together with family members. In terms of physical activity, more than two-thirds (74%) adhered to WHO guidelines regarding cardiovascular exercise.
Primary linear regression analysis
Linear regression analysis (Table 2) showed that better dynamic balance, expressed as normalized CRD, was associated with better normalized horizontal hop performance (β = 0.59, [95% CI 0.29-0.88], p<0.001). Furthermore, better reach distance in the posteromedial and posterolateral directions also predicted better hop performance. Better dynamic balance for the reach distance in the anterior directions was not statistically significantly associated with better horizontal hop performance.
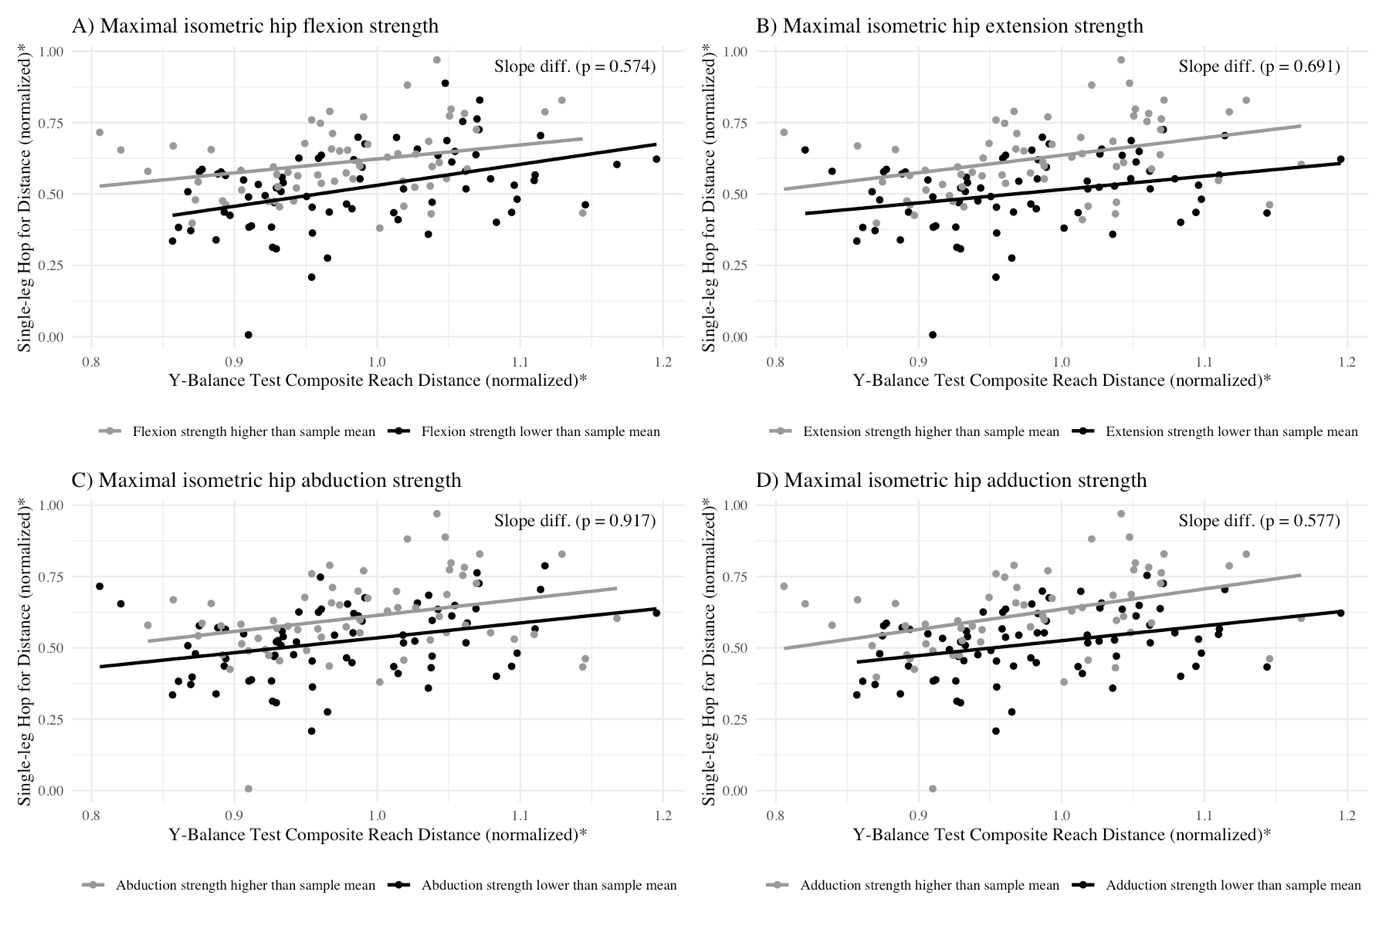
Maximal isometric hip muscle strength subgroup analyses
Likewise, better dynamic balance statistically significantly predicted better horizontal hop performance in participants with maximal isometric hip muscle strength below the sample mean in flexion (β = 0.74, [95% CI 0.36-1.11], p<0.001), extension (β = 0.47, [95% CI 0.11-0.83], p<0.05), abduction (β = 0.52, [95% CI 0.17-0.88], p<0.05), and adduction (β = 0.52, [95% CI 0.20–0.85], p<0.05) and in participants with maximal isometric hip muscle strength above the sample mean in flexion (β = 0.49, [95% CI 0.07-0.91], p<0.05), extension (β = 0.61, [95% CI 0.20-1.02], p<0.05), abduction (β = 0.56, [95% CI 0.09-1.04], p<0.05), and adduction (β = 0.71, [95% CI 0.24-1.18], p<0.05). The Z-test showed no differences between linear regression slopes in subgroups of maximal isometric hip muscle strength below or above the sample mean (Figure 2). This suggests that the association between better dynamic balance and improved horizontal hop performance was consistent across subgroups (Table 3a, 3b, 3c, and 3d in supplemental material).

DISCUSSION
The present study showed that better dynamic balance predicted better hop performance irrespective of maximal isometric hip muscle strength in an asymptomatic adult population. Interestingly, better dynamic balance in the posteromedial and lateral directions as well as the CRD predicted better hop performance whereas the anterior direction did not.
Consistent with the findings of the present study, the results of two other studies in 31 adolescent amateur rugby players and 72 young football players showed that the posteromedial and posterolateral directions as well as the CRD in the YBT were positively associated with performance in the SLHD test.6,19 Nonetheless, no previous studies have investigated whether the associations between dynamic balance and hop performance vary with different levels of maximal hip muscle strength. A possible explanation for the lack of differences in the predictive association of better dynamic balance on horizontal hop performance across subgroups of muscle strength may be attributed to the similarities between the YBT and the Single Leg Hop for Distance test.27 Both tests require comparable efforts in dynamic balance and involve similar demands on the hip musculature.28,29 The SLHD test measures the ability to control the body as hopping forward and landing, which like the YBT requires control of the hip joint, as well as the ankle and knee joint.28,29 This is particularly evident in the stance leg during the posteromedial and posterolateral reach directions of the YBT, as well as during propulsion and landing phases of the SLHD test.28,29
Notably, both tasks require precise neuromuscular coordination and the ability to regulate force production across multiple joints. This regulation likely involves graded activation of individual muscles rather than reliance on maximal force capacity alone, particularly during balance maintenance and controlled landing phases. While functional performance is not solely dependent on maximal strength capacity, certain phases such as single-leg propulsion and landing stabilization may necessitate high levels of hip muscle activation and torque production. Therefore, maximal hip muscle strength may contribute to performance capacity, even though the overall execution of the tasks also depends on motor control and submaximal force modulation.
Consequently, the predictive association between dynamic balance, as measured by the YBT, and hop performance, as assessed by the SLHD test, may remain consistent regardless of whether a participant’s maximal isometric hip muscle strength is below or above the sample mean, as both tasks appear to share overlapping neuromuscular and mechanical demands.
Although purely speculative, the lack of a predictive association between performance in the anterior direction of the YBT and horizontal hop performance may be attributed to differences in the muscle activity required for each task. Horizontal hop performance primarily depends on muscle activity at the hip (44%) and ankle (43%) joints, with the knee contributing only 13% in the propulsive phase.30 In contrast, the anterior reach of the YBT presumably involves greater reliance on knee extension strength.29 Furthermore, limited ankle joint mobility may constrain anterior reach more than posterior directions. Therefore, improvements in anterior YBT may not necessarily translate to enhanced horizontal hop performance.
Study strengths and limitations
One major strength of the present study is that the participants subjectively reported a high level of confidence in their hip and groin during the SLHD test. This supports that the present study included participants free from musculoskeletal conditions affecting the back or lower extremities. Additionally, the testers performing clinical assessments received the same training and used standardized test protocols with valid and reliable tests and instructions for the participants.3,8,9,11,24–26
Despite the strengths of the study, some limitations should be acknowledged. The involvement of six testers in conducting the clinical assessments may have introduced intertester variability, even though standardized protocols were employed.3,8,9,11,24–26 Thus, the impact of this variability is considered minimal. Participants were permitted to use their upper extremities during the YBT, but not during the SLHD test. While this inconsistency may have influenced the results, the testers adhered to previously established reliable protocols.3,8,9,11,24–26 All participants performed the YBT and SLHD test barefoot to ensure standardized testing conditions. However, testing without shoes may limit comparability with performance in sport-specific conditions.
Furthermore, the decision to stratify participants based on whether their isometric hip muscle strength was below or above the sample mean,9 could raise a concern; since participants with nearly identical strength values may have been assigned to different groups, potentially affecting the findings. However, with the consistent findings across all strength tests and almost all YBT directions, the risk of systematic misclassification seems small.
The generalizability of this study is considered acceptable as the participants were recruited from different institutions and organizations, representing a normal population. However, the demographics of the study sample suggest that the population of the current study is younger and more physically active compared to the general Danish population.31 This should be considered when comparing these findings to the findings of other populations.
Clinical implications
The current findings suggest implications for researchers and practitioners working with individuals engaged in sports and physical rehabilitation. Relatively strong associations between dynamic balance and hop performance were observed, irrespective of muscle strength status. These results suggest that dynamic balance assessment may provide complementary information regarding functional performance capacity and movement control. However, the cross-sectional design precludes causal inference, and it remains unknown whether improving dynamic balance leads to improved hop performance or rehabilitation outcomes.
Given that the participants in the present study were free of musculoskeletal conditions, the results can serve as a valuable reference point for clinical populations, particularly those recovering from hip and knee injuries who may have compromised balance or strength. In clinical practice, these reference data may support interpretation of YBT and hop performance results by providing a contextual benchmark from an asymptomatic cohort. Accordingly, balance assessment may be considered alongside strength testing when evaluating lower limb functional performance, particularly in tasks requiring single-leg control and coordination. However, as previously noted, the study sample was younger and more physically active than the general Danish population; therefore, generalizations should be made with caution.
Finally, considering the consistent associations across the various directions of the YBT, future studies may examine whether changes in balance performance are associated with changes in functional performance in symptomatic and athletic populations. At present, these findings primarily inform assessment and benchmarking rather than specific training recommendations.
CONCLUSIONS
Individuals with better dynamic balance displayed better horizontal hop performance, irrespective of the individual’s maximum hip muscle strength. These findings provide data on subjects without musculoskeletal conditions, which can be used as reference points when compared with symptomatic populations. However, further research is needed to assess whether better dynamic balance predicts horizontal hop performance in symptomatic and athletic populations.
Acknowledgements
The authors would like to thank Anne Sofie Vestergaard Sølvkjær and Mathias Waagepetersen for assisting in the recruitment of participants and the collection of data. Furthermore, we thank the participants involved in the research.
Disclosure of interest
All authors declare that they have no competing interest.