
INTRODUCTION
Current best practice recommendations for rehabilitation for athletes following anterior cruciate ligament (ACL) reconstruction (ACLR) focus on the outcomes of muscle strength and contractility of the knee extensor and flexor muscles, lower body muscle power, change-of-direction movements, and overall functional outcomes.1–3 Inadequate restoration of these qualities is associated with inferior short and long-term outcomes, including greater risk of a second ACL injury, decreased patient satisfaction, and movement strategies associated with premature osteoarthritis of the knee.4–6 While many guidelines for rehabilitation for patients following ACLR exist, the optimal strategy to maximize outcomes and minimize long-term risk remains unclear.1,2,7,8
Supervised rehabilitation by a physical therapist or athletic trainer confers benefits over unsupervised rehabilitation for athletes who wish to return to sport following ACLR.9 Supervised rehabilitation may identify individualized care to address deficits in strength, motivation/confidence, and movement strategy.1,10 Survey data of physical therapists suggest the typical duration of supervised rehabilitation following ACLR may be four months or fewer.11 This is in stark contrast to the recommended time it is currently recommended for an athlete to wait to return-to-sport after ACLR, which is eight months or longer.12,13 In addition to time, it is generally agreed upon that surpassing minimum thresholds for return-to-sport testing occur prior to returning to sport, however there is a lack of consensus on which specific tests are the most important, and a battery of tests is recommended over any single measure.1,4,12,14 For example, it is recommended knee extensor torque be at least 3.0-3.5 N*m/kg when assessed with an isometric dynamometer, and a limb symmetry index (LSI) of less than 10% compared to the unaffected side when measured with an isometric or isokinetic dynamometer.4 Notably, knee extensor torque is typically well below this recommended value for returning to sport when most athletes following have ended formal rehabilitation following ACLR.15 It is not well established whether the optimal length of supervised rehabilitation is related to outcomes following ACLR. Therefore, the purpose of this systematic review was to analyze the effect of the duration of supervised rehabilitation on strength, functional performance, and self-reported outcomes following ACLR.
METHODS
Manuscript Registration
This systematic review was registered with PROSPERO (Registration No. [CRD 42024604980]).
Search Strategy
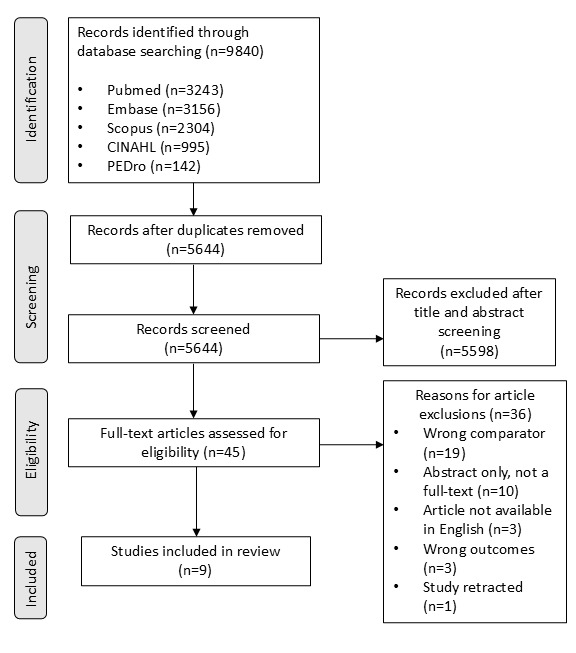
A comprehensive literature search was conducted in November of 2024 following the Preferred Reporting Items for Systematic reviews and Meta-Analyses (PRISMA) guidelines. The databases PubMed, Embase, Scopus, CINAHL, and Pedro were used to identify studies examining rehabilitation and return-to-sport outcomes following ACLR in athletic populations. The search strategy incorporated both Medical Subject Headings (MeSH) and keyword terms to ensure broad coverage of relevant literature.
The search included terms related to rehabilitation and physical therapy, such as “Rehabilitation”, “physical therapy”, and “physiotherapy” in the title or abstract. Terms related to outcomes, such as “Return to Sport”, and “Recovery of Function”, and “return to play” were included. To focus on ACL injuries, the search included terms such as “Anterior Cruciate Ligament”, “ACL”, “ACL reconstruction”. Full search strategies are provided in the Appendix.
Criteria for Selection
Inclusion criteria included studies that were Level 3 or higher (cohort studies and controlled trials). Additionally studies: 1) that included patients who had undergone primary ACLR with any graft type, 2) that provided outcome measures for strength, performance testing (such as change-of-direction or hop testing), and/or patient reported functional status, and 3)that provided temporal measurements of the duration of supervised rehabilitation following ACLR were included. A study that had any objective strength measurement was included due to the lack of consensus regarding the best method for and significant correlation between strength measurements of different isokinetic speeds (including isometric).16 Exclusion criteria included a lack of direct analysis of the relationship between rehabilitation duration and outcome measures; studies that were not available in full-text in the English language; or studies that were later retracted.
Studies identified from the eligibility criteria were independently analyzed by two authors following PRISMA guidelines, beginning with title and abstract screening, followed by full-text review for studies selected. At each stage, disagreements regarding inclusion of an article were arbitrated by a third author.
Data Extraction and Study Assessment
The Downs and Black checklist was implemented to assess the quality of the studies included. This was used for all studies to account for studies of varying methodology. Higher scores (up to 28) on the Downs and Black checklist indicate higher quality. Since cohort and non-randomized controlled trials were included, risk of bias was assessed for all studies by the ROBINS-I tool. The ROBINS-I tool is a domain-based qualitative assessment of risk of bias, and provides a score of low, moderate, or serious risk of bias.17
Two authors completed the appraisal of each included article separately. Disagreements in scoring were arbitrated by discussion, and consensus was reached among the authors.
Data extracted from all articles included study design, country of origin of the study, demographics of participants, the duration (months) of rehabilitation used in the groupings, the time point of assessment of the outcomes measures, the relevant outcomes assessed, and the results of the outcomes. When not directly reported, means and standard deviations were calculated when sufficient data allowed. Additionally, any available information regarding the content of the rehabilitation delivered was collected for each study. A meta-analysis was deemed inappropriate due to methodological heterogeneity among studies, inconsistent outcome measurement, and inadequate reporting of data required for pooling.
RESULTS
Subject and Study Characteristics
Of the 5644 studies initially retrieved after removal of duplicates, 45 were selected for full-text review, and nine studies were included in the final review. (Figure) This included one randomized controlled trial,18 one retrospective cohort study,19 and seven cross-sectional cohort studies.20–26 The quality of studies and risk-of-bias assessment can be found in Table 1.
The sample sizes ranged from 30 to 470, with a median average of 91. There were a total of 1498 subjects, of which 68.6% (1028) were male, 31.1% (466) female, and 0.4% (6) an unspecified sex. The mean average age was 27.6 (± 10.0) years. (Table 2)
Rehabilitation duration was reported as a continuous variable in four studies and an ordinal variable in five studies. Rehabilitation duration was statistically assessed as a continuous variable in one study and as an ordinal variable in eight studies. The rehabilitation strategies compared in each study are outlined in Table 3.
Knee Strength
Five of the nine studies included isokinetic strength assessment as an outcome measure. Three studies reported statistically significant differences (p < 0.05) favoring longer duration rehabilitation,22–24 and two studies reported no statistically significant differences in strength based on rehab duration.18–21 Two studies directly compared peak torque production between groups.18,24 One study evaluated peak knee flexor and extensor torque normalized to body weight at 60 and 180 degrees/second,24 and the other study evaluated peak knee flexor and extensor torque at 60 degrees/second.18 The other three studies compared peak torque LSI between groups.21–23 Two studies included knee extensor and flexor peak torque LSI at 90 degrees/second,22,23 and the other study reported knee extensor and flexor peak torque LSI at 60 and 180 degrees/second.21 The results of these studies can be found in Table 4.
Performance Testing
Five of the nine studies included performance testing as an outcome measure. Three studies reported statistically significant differences (p < 0.05) favoring longer duration rehabilitation,22,23,25 and two studies reported no statistically significant differences in performance testing based on rehab duration.18,20 The single leg hop for distance was directly compared in two studies,18,20 and the LSI of the single leg hop for distance was compared in two studies.22,23 The triple hop for distance, triple crossover hop for distance, and 6 meter timed hop were assessed in two studies.22,23 A change-of-direction assessment was assessed in only one study.25 The results of these studies can be found in Table 4.
Self-Reported Function
Self-reported function was assessed in six studies with a variety of tools. The International Knee Documentation Committee (IKDC) score was used in two studies.18,20 The Tegner activity scale was used in one study.18 The Knee Outcome Survey Activity of Daily Living scale (KOS-ADL) was used in one study.19 The Lysholm score was used in two studies.20,21 Binary (yes/no) self-reported return to sport was used in one study.20 Binary self-reported return to Level I/II sport was used in one study.22 Binary self-reported return to prior level of sport for those that previously played a Level I/II sport was used in one study.26 Two studies reported statistically significant differences (p < 0.05) favoring longer duration rehabilitation,22,26 one study reported statistically significant differences (p < 0.05) favoring longer duration rehabilitation for females but no significant differences for males,19 one study reported statistically significant differences (p < 0.05) in some self-reported functional outcomes but not others,20 and two studies reported no statistically significant differences in self-reported function based on rehab duration.18,21 The results of these studies can be found in Table 4.
DISCUSSION
This review was designed to elucidate the relationship between the duration of supervised rehabilitation and outcomes pertaining to strength, performance, and self-reported outcomes in athletes following ACLR. Seven out of the nine studies included in this review identified a statistically significant and beneficial association between the duration of supervised rehabilitation and at least one relevant outcome. No studies showed evidence of outcomes worsening with a longer duration of supervised rehabilitation.
There is currently no universally accepted rehabilitation timeline for an athlete following ACLR to optimize return-to-sport outcomes. Maturation of the healing ACL graft varies by graft type, health status, and other individual differences, with complete healing taking up to two years or longer.27 Strict adherence to such a timeline for returning to sport may be psychologically and socially unacceptable for many athletes.28 However, earlier return to high-risk sports comes with higher risk of re-injury and disability, particularly returning before 9-12 months post-operatively.29,30 Due to the limitations of using time alone for determining readiness for returning to sport, criteria-based return-to-sport assessments, including measures of knee strength and performance, are widely recommended to assist with decision-making.1,2,31 Greater performance on such return-to-sport assessments may be associated with improved outcomes in performance and reduced re-injury risk.30,32 The findings of this systematic review highlight the potential role of the duration of rehabilitation with improvements on performance on return-to-sport assessments. Supervised rehabilitation of at least six months was consistently associated with improved outcomes, albeit in evidence with moderate or greater risk of bias. This is a longer than what may occur in practice, which may be less than four months.12 Future research investigating barriers and facilitators to aligning practice standards with the findings in this study may be worthwhile, given the discrepancy between the duration of supervised rehabilitation that is associated with positive outcomes and the actual duration of supervised rehabilitation in common practice.
The variability of outcome measures assessed across the studies in this review may be reflective of the lack of consensus regarding the most relevant outcomes for determining return-to-sport readiness.1 Studies included in this review generally did not find differences in standardized patient reported outcome measures such as the IKDC, Tegner, or Lysholm. On the contrary, most of the significant differences were found in measures more specific to return-to-sport status, such as the self-reported return to sport or return to prior level of sport. The comprehensive nature of standardized outcome measures used in research differs from dichotomous return-to-sport outcome measures. The IKDC and Lysholm include many activities of daily living, and it is possible that a ceiling effect of these measures precluded differences between groups. While the Tegner scale does directly measure perceived athletic status, it does not account for important qualities of sport such as intensity or frequency.33 As the later stages of supervised rehabilitation following ACLR often focus on more athletic qualities, it is possible that these qualities are better captured with measures that are specific to sport. This may explain the variability in findings across studies in this review.
While most studies included in this review assessed the quality and content of rehabilitation, most did so only minimally and subjectively, such as relying on the athlete’s self-reported perception of their experiences in rehabilitation based on brief descriptors. Interventions that focus on athletic constructs such as jumping, change-of-direction, and agility are not medically appropriate in the early post-operative phases of rehabilitation following ACLR.34 It is possible that the positive relationship between the duration of supervised rehabilitation and outcomes found in this review is related to these athletic constructs being introduced and guided in the mid to later phases of rehabilitation. In addition to potential physical benefits, supervised rehabilitation may aid in psychological readiness, which is important during the transition towards returning to sport following ACLR.35 Further research that can distinguish duration and content of rehabilitation in relationship to readiness may be of value for determining optimal rehabilitation trajectories.
There are notable demographic disparities in who is most affected by ACL injuries. The incidence of ACL injury is higher in female athletes (0.14 injuries/ 1000 player hours) compared to males (0.05/1000 player-hours), and disproportionately affects adolescents (0.19 injuries/1000 player hours) compared to adult athletes (0.07 injuries/player hours).36 Female athletes are at greater risk for re-injury after ACLR compared to males.37 Further, improvements in quadriceps strength and performance testing following ACLR is often slower in females compared to males.38,39 Adolescents have higher rates of re-injury and different rehabilitation trajectories following ACLR compared to adults.7
Limitations
Adolescents and females are poorly represented in the studies included in this review: subjects across the included studies were 68.6% male and had an average age of 27.6 years which limits interpretation of results for younger patients and females. There are also regional and temporal variations in graft choices for ACLR, which may explain hamstring autografts being disproportionately represented in the studies included.40 Therefore, the findings of this review may not be relevant to some groups of patients, such as those who commonly undergo ACLR using alternate graft sources.
All but one study included in this review was either cross-sectional or retrospective in nature, and the lone randomized controlled trial did not account for those lost to follow-up, thereby impacting its risk of bias. In fact, all included studies exhibited signs of moderate or serious risks of bias. This dampens potential conclusions regarding the duration of supervised rehabilitation and outcomes in patients following ACLR, and these results must be interpreted with caution. Furthermore, the time of strength and functional assessments relative to time of surgery was highly variable across studies. Importantly, in most of the studies included, the content of the rehabilitation was either minimally described or not at all.
Future research should prioritize higher quality studies with lower risk of bias. Specifically, clearly defined supervised rehabilitation interventions, precise outcome measures, psychological readiness assessments, and long-term follow-ups will be critical to understand how rehabilitation can influence recovery in patients following ACLR. An emphasis should be made to include populations who are at highest risk for injury and disability, including female and adolescent athletes. Such studies will clarify optimal rehabilitation durations, possibly to delineate causal relationships, and ultimately improve clinical practice guidelines for athletes following ACLR.
CONCLUSION
The results of this systematic review suggest that a duration of supervised rehabilitation of six months or greater led to favorable outcomes pertaining to strength, performance testing, and self-reported outcomes in athletes following ACLR. Higher quality research, including prospective cohort and randomized trials, with a specific inclusion of females, adolescents, and an appropriate variety of graft types will be of benefit.
COI Statement
The authors have no conflicts of interest to report.
ACKNOWLEDGEMENTS
The authors greatly appreciate the contributions of Emily Newberry to the creation of this manuscript.