INTRODUCTION
Development of youth athletes across all sports is too often temporarily halted or permanently stopped by injury or illness.1–3 Injury and illness surveillance underpin effective prevention strategies.4,5 Injuries and illness impair the chance of successful performance,6,7 and reducing injury and illness rates is a critical part of prioritizing an athlete’s well-being and safety.8 Athletes often participate in different teams and sports, creating a challenge for obtaining accurate injury/illness data. Obtaining third-party injury reports is often problematic and inconsistent across medical staff and teams.9 Receiving injury information directly from the athlete offers an alternative tool for improving injury surveillance in this pre-elite athlete cohort.
Research examining injury in hockey athletes is limited compared to other sports such as Australian football10,11 and soccer.12,13 A systematic review of field hockey injuries conducted in 2020 identified that injury rates ranged from 1.47 to 11.32 per 1000 athlete exposures, with most injuries sustained during matches.14 Although previous studies provide an overview of common injuries previously experienced there is extensive heterogeneity in study design, making it difficult to compare findings across cohorts and levels.15 Developing a comprehensive understanding of injury epidemiology in Australian field hockey athletes is the first step to inform future prevention programs and ensure hockey athlete development is not limited by injury.4
Junior athletes are the future of the sport, and their development will be crucial for Australia’s success at the Brisbane 2032 Olympics and beyond. Developing athletes are at greater risk of injury due to the maturation process, competing demands, reduced recovery and a lack of support services.16 Understanding injury and illness patterns and what methods are best to effectively monitor injury and illness occurrence are essential to safeguarding athlete progression. By prioritizing athlete well-being, performance can be enhanced and injury risk can be reduced to assist the next generation in reaching the world stage.
The authors aim to contribute to the body of evidence surrounding hockey injuries and illnesses for pre-elite athletes by quantifying injury rates reported in 2024 to identify problem areas and create strategies to address them. The primary aims of this research were to (1) determine the prevalence of injuries/illnesses at the start of a tournament and following an 8-day tournament; (2) describe injuries/illnesses and injury prevalence rate occurring at the 2024 U/18 Hockey Australia Championships (HAC), including sex comparison; Secondary aims were to (1) assess whether the drag flicking hockey skill is correlated with injury, including sex subanalysis. Drag flicking is a type of shot used to score goals during a penalty corner. The drag flick is executed by dragging the ball from behind the body and then quickly flicking it up in the air; and (2) compare athlete self-report injury/illness surveillance method with first aid observer injury reporting.
METHODS
Study Design
This prospective observational study investigated the injury/illness profile of hockey athletes competing at the 2024 U/18 HAC. The reporting of this study follows the Strengthening the Reporting of Observational studies in Epidemiology (STROBE) statement.17 Ethics approval was obtained from the La Trobe University Human Research Ethics Committee (Approval number: HEC24257). All participants provided prospective informed consent by scanning a QR code with their smartphone. If they were under the age of 18, they were required to answer three questions demonstrating their understanding of the project before progressing to the questionnaire (Appendix A).
Participants and Setting
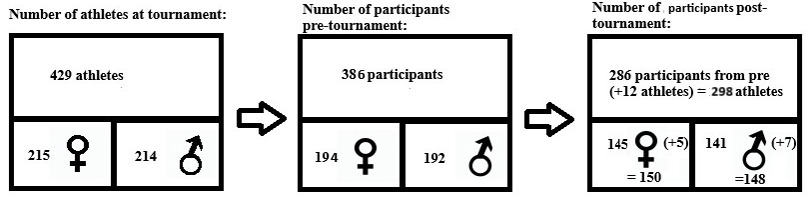
All athletes (n = 429; female = 215, male = 214) aged 16-18 years old competing at the 2024 U/18 HAC were invited to participate in the present study. This sample of convenience included members of 12 female teams and 12 male teams who completed seven matches across nine days (July 3-11, 2024).
Data Measurements
Participants were asked to complete the Modified Oslo Sports Trauma Research Centre Questionnaire on Health Problems (Modified OSTRC-H2 [Appendix B])18 at the start and end of the tournament. It is a validated athlete self-report injury and illness surveillance tool for use in sporting populations.19–21 Data from the OSTRC-H questionnaire includes: 1) whether an injury or illness is present, 2) whether the injury/illness limited participation, 3) if it affected performance, and 4) the extent of the symptoms experienced. If an injury/illness is present, additional information is sought such as body location, and number of days missed from training/competition. Athlete’s names were recorded with each questionnaire so the pre and post tournament questionnaires could be linked.
Athletes were also asked to complete a questionnaire to collect demographic data such as age, sex, team, position, whether they were a drag-flicker, and whether they completed strength training and/or a formal warm-up. The usual practice of first-aid officer reporting also took place. This involves the first-aid officer recording injuries in an online database when an athlete seeks their assistance or they observe an injury during the tournament. Information such as name, age, mechanism of injury, type of injury and body part were recorded.
Bias
To reduce selection bias, a researcher (ES or EB) met with each team the day before the tournament started to explain the research. Each athlete was then given an opportunity to participate by scanning a QR code to provide consent, demonstrate their understanding of the project if they were a minor, and complete the demographics and modified OSTRC-H2 questionnaire. Following their final match, a researcher (ES) and research assistant met with each team or team manager to ask the athletes to complete the modified OSTRC-H2 questionnaire again.
Variables
The injury and illness definitions used by Timpka et al.22 were adopted for this study. A ‘sports incapacity’ injury or illness is defined as the ‘sidelining of an athlete by a sports authority (the athlete her/himself, coach, manager, sports committee) due to reduced ability to perform a planned sports activity following an isolated exposure to physical energy during sports training or competition’. This is the equivalent to a participant selecting any of the following options for Question 1 of the OSTRC-H2 which asks about participation or competition: c. Reduced participation due to a health problem, d. Could not participate due to a health problem.
Athlete exposure was calculated by multiplying the number of teams (total = 24, female/male = 12) by the number of athletes on the field (n = 11) by the number of matches (n = 7) by the number of minutes/match (n = 60). This number was then divided by 60 to establish the number of player match hours.
Statistical Methods
Descriptive analysis, reported as counts and percentages with 95% confidence intervals calculated via the Clopper-Pearson exact method (to prevent over shooting23), were used to describe the injuries/illnesses occurring at the 2024 U/18 HAC. In addition, overall injury prevalence rate was calculated using the formula: number of injuries/player match 1000 hours.
The relationship between drag flicking and injury was evaluated by a logistic regression model. Injury occurence (binary outcome) was the dependent variable with drag flicking (binary outcome yes no) and were entered into the model along with a drag flicking x sex interaction term. If the relationship between injury and drag flicking was modified by sex (interaction term p<0.05) the data was stratified by sex and explored in separate models. If no interaction was observed, the interaction was dropped and the the relationship explored in the model controlling for sex. Data was reported as adjusted odds ratios (aOR), 95% confidence intervals (CI) and corresponding p values.
RESULTS
Response Rate
The response rate for the modified OSTRC-H2 before the tournament was 387 (90%; 95%CI 87 to 93%), female:195 (91%; 95%CI 86 to 94%), male:192 (90%; 95%CI 85 to 93%) and the response rate following the tournament was 298 (69%; 95%CI 65 to 74%), female:150 (70%; 95%CI 63 to 76%), male:148 (69%; 95%CI 63 to 75%). Two hundred and eighty-six (67%; 95%CI 62 to 71%), female:145 (67%; 95%CI 61 to 74%), male:141 (66%; 95%CI 59 to 72%) responded both pre and post tournament. (Figure 1). The age range for participants was 16-18 years old.

Demographic Data
Demographic data including position, strength training, warm-up and drag-flicking descriptors are presented in Table 1. Modified OSTRC-H2 results are presented in Table 2. The OSTRC-H2 provided as Appendix B examines how injury/illness affected participation, modifications, performance and symptoms.
Pre-tournament injury/illness Prevalence
At the start of the tournament 124 athletes (32%), female:73 (37%), male: 51 (27%) had an injury and 64 (17%); female:39 (20%), male: 25 (13%) had an illness. The most frequent illness symptoms pre-tournament were blocked nose=45, cough=38, and sore throat=33. Over half of injured athletes (n = 67 (54%) female, n= 36 (49%) and male: n= 31(61%) had an SI injury at the start of the tournament. One third of athletes with an illness at the start of the tournament could not complete full training in the nine days before the tournament due to the illness (n = 22 (34%). More females, n = 15 (38%) had SI illnesses at the start of the tournament compared to males, n = 7 (28%).
Post-tournament injury/illness Prevalence
At the end of the tournament 126 athletes (42%), females n= 69 (46%), males n=57 (39%) had an injury and 44 (15%) , female n= 21(14%), male n= 23 (16%) had an illness. The most frequent illness symptoms post-tournament were cough=25, blocked nose=24 and sore throat=23. There were 21 (17%), female n= 10 (14%), and male n=11 (19%) athletes that sustained injuries causing SI during the tournament. And four (9%) female n= 2 (10%), and male n= 2 (9%) athletes that had respiratory illnesses causing SI during the tournament.
Pre-tournament versus Post-tournament Injuries
There were 185 injuries identified at the start of the tournament, with 141 (76%) reported as resulting in SI. Of the 185 injuries, 121 (65%) (n=87, 72%) were in female athletes and 64 (35%) (n=54, 84% SI) were in male athletes. At the end of the tournament 203 (n=96,47% SI) injuries were identified; 122 (60%) (n=58, 48% SI) and 81(40%) (n=38(47%) SI) of these injuries were sustained by female and male athletes respectively.
The total injury prevalence rate (PR) for the tournament was 109.9/1000 player match (PM) hrs (female: 132.0/1000 PM hrs, male: 87.7/1000 PM hrs). The total sports incapacity injury PR was 52.0/1000 PM hrs (female: 62.8/1000 PM hrs, male: 41.1/1000 PM hrs). Table 2 outlines the frequency of injuries and sports incapacity injuries for each body area pre and post tournament as well as new injuries during the tournament.
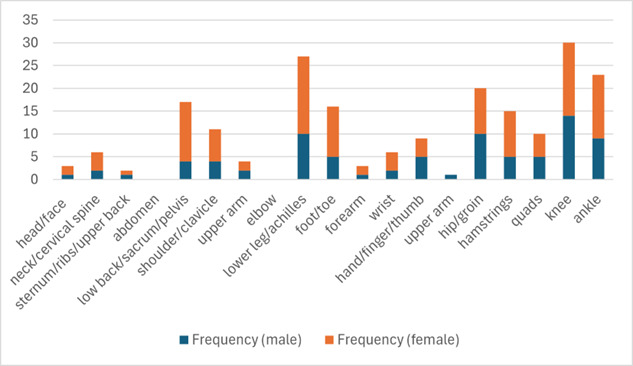
The most frequently injured area during the tournament was the knee (n = 30), followed by the lower leg/achilles (n = 27) and ankle (n = 23). The most frequently injured areas for females were lower leg/achilles (n = 17), knee (n = 16), ankle (n = 14), and low back (n = 13). The most frequently injured areas for males were knee (n = 14), lower leg/achilles (n = 10), hip/groin (n = 10), and ankle (n = 9). The most frequent new injury sustained during the tournament was at the knee (n = 20), followed by the hip/groin (n = 17), ankle (n = 14) and foot (n = 14). The distribution of injury area for females and males is displayed in Figure 2. The most severe injuries sustained during the tournament was an anterior cruciate ligament rupture and a patellar dislocation.

Of the 124 players that started the tournament reporting an injury location (or more than one injury location), 14 reported a new injury in a different location at the end of the tournament, 30 reported being injury free at the end of the tournament, 51 did not change, and 29 reported a pre tournament injury location but did not complete their follow up. Of the players that were completely uninjured at baseline (or did not complete base line), 57 reported an injury during the tournament out of 263 (uninjured or no response). Further analysis has shown that an athlete in this sample was more likely to get injured if they were not injured at the start of the tournament (OR 0.46 [0.25, 0.86]).
Drag Flicking Injury Risk
Additional analysis of the drag flicking data shows that of the 298 (150F/148M) participants who completed the OSTRC-H2 at the end of the tournament, 74 (24F/50M) of these were drag flickers. Thirty-five (47%) of these athletes were injured, 10 (42%) female and 25 (50%) male. Analysis of this data showed the relationship between drag flicking and injury occurrence was not modified by sex (z = 1.63, p =0.10). Furthermore, when controlling for a player’s sex, no relationship was present between drag flicking and injury occurrence (aOR 1.44 [95%CI 0.83 to 2.48], p=0.19).
Injury Surveillance Methods
The first-aid observer injury surveillance method identified 13 injuries during the tournament, one of these was identified as a timeloss injury. Table 3 outlines the injured area and frequency of injury during the tournament identified by athlete self-report method compared to the injuries identified by the third-party method.
DISCUSSION
Hockey Tournament Injury Profile
Self-report injury data revealed that females sustained 1.4 times more injuries than males during the tournament. These injury rates are higher than has previously been reported for tournament field hockey.24,25 In international field hockey tournaments in 2013, females sustained less injuries compared to males with the average number of injuries per 1000 PM hours for females 29.1 (95%CI: 18.6 to 39.7) and for males 48.3 (95%CI: 30.9 to 65.8).24 However, there was a greater representation of male than female participants, with five female tournaments compared to 11 male tournaments. The study also included male tournaments in countries where the skill level is typically not as high, therefore could be at greater risk of injury. Further research is required to understand the different injury profile of male and female hockey athletes across skill levels.
The injury profile of field hockey athletes at the 2024 U/18 HAC was different to that of athletes competing at the 2016 U/18 European Championships which consisted of five matches in three days. The most frequent self-report injured area during the 2024 tournament was the lower limb: knee, lower leg/achilles and ankle. Lower leg/achilles was the most frequently injured area in females and the knee was the most injured area in males. The most frequent third-party reported injury area at the 2024 U/18 HAC was head/face (n=4) and knee (n=3). This is different than what was described at the 2016 U/18 European Championships with the foot/ankle (n = 12) being the most injured area in females and the torso (n=8) being the most frequently injured area in males.26 However, it is important to acknowledge that European data were obtained using third-party observations of acute injuries during a match versus any type of self report. The athlete self-report method using the OSTRC-H2 provides a more accurate depiction of the injury profile of a hockey athlete, as it includes acute and overuse injuries.
Female Injuries in Developing Athletes
The one study previously reporting injury rates from an U/18 hockey tournament also identified higher injury rates in females (86 injuries/1000 PM hours) compared to males (53/1000 PM hours).26 These injury rates are still not as high as the current study which might be attributable to different data collection methods of self-report versus third-party observation. Nevertheless, the injury rates reported in these two U/18 tournament studies are higher than those reported at senior elite tournaments.24 This reinforces the need to prioritize injury prevention for developing field hockey athletes, particularly female athletes.
Hockey Tournament Illness Profile
One other study has reported illness data from a hockey tournament. This study identified 29(7%) illnesses in 388 athletes at the 2012 London Olympics.27 Twice the illness rate was identified at the 2024 Hockey Australia U/18 National Championships. Additionally, it was identified that 34% of athletes with an illness pre-tournament resulted in timeloss, however during the tournament we found that only 9% of sick athletes did not play. This suggests that during competition, more athletes are playing while sick and potentially placing those around them at greater risk of getting sick. It is recommended that key hockey bodies introduce guidelines for management of infectious diseases during tournaments to reduce the risk of illness transmission.
Drag Flicking Injury Risk
Drag flicking places high load and rotational forces through the lower limbs and spine.27 Although not statistically significantly different from non-drag flickers in this cohort, 50% of male drag flickers were injured; where only 39% of the total male cohort at the tournament were injured. As demonstrated in Table 3 the most frequent injuries sustained by drag flickers were knee, lower leg/achilles, hip/groin and hamstring. The most frequently reported injury for male drag flickers was the knee and for female drag flickers was the low back/sacrum/pelvis. These fidings differ to injury surveillance data reported in drag flickers by Ng et. al. .28 They performed a retrospective three-month study with senior athletes, identifying that drag flickers had a significantly higher prevalence of hip and lower back pain compared to non-drag flickers.28 For a better understanding of drag flicking and injuries in development athletes a prospective longitudinal study should be considered.
Tournament Preparation
Three-quarters of injuries pre-tournament resulted in sports incapacity, compared to less than half of injuries sustained during the tournament. One possible explanation for this difference is that athletes were managed more conservatively pre-tournament, but were potentially placed at greater risk of injury during the tournament by playing without modification while injured. This type of management contradicts the IOC consensus statement on youth athletic development which states that no youth athlete should compete or train when in pain or not completely recovered from an illness or injury.16 This is also not good practice as the spike in load during the tournament following a week of rest will place the athlete at greater risk of injury in the following four weeks post-tournament.29 Preventing these injuries from occurring in the first place must be prioritized to allow for improved tournament preparation. The Royal Dutch Hockey Association introduced a neuromuscular warm-up program in 2016 with supporting online resources (https://hockey.warmingupapp.nl).30 Perhaps this type of intervention has contributed to the Netherlands being world leaders in hockey for many years. Australian hockey athletes could greatly benefit from a similar injury prevention strategy as well as coach/ parent education around training load, early management of injuries and the benefits of a strengthening program.
Injury Surveillance Methods
Two injury surveillance methods, athlete self-report and third-party reporting, were introduced in the 2024 Hockey Australia Under 18 Championships. Athlete self-report response rates were high prior to the tournament, starting at 90%; however this dropped to 69% at the completion of the tournament. Despite this lower response rate, 135 new injuries were identified during the tournament compared to 13 injuries identified by the third-party method. Reasons for this discrepancy in data may include lack of involvement for a first aid officer for minor injuries or injuries managed by the team physiotherapist, first aid officers not recording non-time loss injuries, or first aid officers not being research-invested.31 Therefore, the athlete self-report method provided a more detailed representation of the injury profile for U/18 hockey athletes in Australia. This provides Hockey Australia with valuable information to help implement injury prevention strategies to improve athlete welfare and performance.
Establishing quality injury surveillance takes time and commitment by all personnel working within high-performance sport and is a critical component of injury prevention.32 Implementation of injury/illness surveillance at the U/18 HAC was only possible due to the strong support received from Hockey Australia and its volunteers, highlighting the critical role National Sporting Organizations (NSOs) play in injury/illness prevention. It has previously been demonstrated that the response rate and quality of injury surveillance takes time for athletes to adopt.33 Therefore, it is important that this injury/illness surveillance method continues to be administered to improve understanding of U/18 hockey injuries and to evaluate the effectiveness of future injury prevention strategies.
Limitations
A limitations of this research is the low response rate for the OSTRC-H2 following the tournament, possibly due to participant burnout or volunteer burden placed on team managers. Nevertheless, 15 times the number of injuries captured by the already established third-party method were identified by the self-report method. Another limitation is that the OSTRC-H2 is grouping lower leg and achilles injuries together. Hockey athletes frequently sustain shin injuries and achilles injuries14 and it would be beneficial to differentiate the two as they require very different management and prevention strategies. Finally, drag flicking is a specialist skill; therefore, higher participant numbers are required to recruit and study drag flicking athletes in order to perform sub-analysis of this population confidently.
CONCLUSION
Knee, lower leg/achilles and ankle injuries were the most prevalent injuries at the U/18 HAC and knee, lower leg/achilles and hip/groin injuries were the most prevalent sports incapacity injuries. There was a higher injury prevalence rate and sports incapacity injury prevalence rate during this tournament compared to previously reported field hockey tournament injury rates. The practice of drag flicking does not appear to increase the risk of injury during a hockey tournament but further research is required and finally, athlete self-report injury surveillance was superior to third party method data collection in a hockey tournament setting.
Funding
This work was supported by a Performance Health Research Grant, awarded by the Australian Institute of Sport.
Conflict of interest
The authors declare no conflicts of interest regarding this manuscript
Acknowledgments
The authors would like to thank the team managers and physiotherapists attending the 2024 U/18 HAC for their assistance with injury data collection. We would also like to thank the athletes who attended these championships for completing the questionnaires and their coaches as well as Hockey Australia, particularly Andrew Collins for supporting this research.