INTRODUCTION
There is robust evidence in the existing literature about the incidence, frequency, characteristics and impact of hamstring strain injury (HSI) in athletes across a multitude of sports, in fact, HSI may account for up to 30% of all lower extremity injury.1–12 Prolonged time may be lost from practice or play.2–7 A high level of reoccurrence has also been reported.1,5,6,8–12 Softball is under-represented in the literature when compared to baseball with injury-related studies focused on baseball outnumbering softball studies 7 to 1.13 Historically, only a few studies exist in the literature regarding the prevalence and characteristics of HSI in baseball.7,14–18 Studies published about softball do not typically discuss HSI and center around overuse injuries, upper extremity injuries associated with pitching or traumatic injuries (sprains, strains, contusions, abrasions) associated with running or being hit with the ball.19–21
Despite the adoption of Title IX in 1972 and a considerable increase in female participation in sport, female athletes remain largely underrepresented in the sports medicine literature. This is certainly true regarding research on risk factor analysis, intervention, and the prevention of hamstring injury in the female athlete compared to male counterparts.22,23 Identification of athletes at risk of HSI, and the impact of these injuries is critical to begin to consider prevention and intervention strategies.
In 2008, Engebretsen and colleagues developed a self-reported Hamstring Outcome Score (HaOS) to assess the impact of current or recurrent hamstring injury on soccer players.24 The HaOS is used to assess five domains relative to hamstring injury: pain, soreness, symptoms, effect on sport activity and quality of life. The questionnaire was based on the principles of the Hip and Groin Outcome Score (HAGOS), the Foot and Ankle Outcome Score (FAOS) and the Knee Osteoarthritis Outcome Score (KOOS).24,25 The HaOS has been subsequently, and effectively, used in a number of studies concerning male soccer players to assess their risk for injury and to assess the impact of various interventions to prevent or treat hamstring injuries.23,24 Based on the use of the HaOS for soccer, van de Hoef et al. concluded that the HaOS may be a useful tool for soccer players to provide insight into risk of sustaining a new HSI.25
Zachazewski et al. reported on the use of the HaOS for assessment of collegiate baseball players.17 The HaOS was modified to make it specific to baseball and was administered to over 200 elite collegiate summer league players. Like the soccer results, the HaOS differed significantly between groups of players who reported HSI or posterior thigh pain, and those who did not. Information regarding the players self-reported incidence, recurrence, side of injury, time lost from play and whether injuries were unilateral or bilateral were also reported and examined by position.
The purpose of this study was to determine the HaOS scores, the self-reported prevalence, recurrence, and time lost from play due to HSI in collegiate softball athletes and compare these findings to the previously collected data on baseball players. Based on the overall similarity of the sports the null hypothesis was that there would be no difference between the groups.
METHODS
Prior to the beginning of the 2021-2024 collegiate softball seasons 16 different colleges or universities were approached asking permission to have their players complete the HaOS regarding their self-reported history of hamstring injury and/or posterior thigh pain. The questionnaire and rationale for the study was presented to athletes from each team by study personnel or certified athletic trainers associated with teams at initial pre-season team meetings. No players were excluded from the study unless they chose not to complete the HaOS.
Players were asked to scan a QR code on their cell phone. Scanning the QR code provided a direct link to the HaOS questionnaire in Research Electronic Data Capture (REDCap). The HaOS questionnaire was completed by the athlete using their cell phone. Completion of the questionnaire was voluntary on the part of each player, and no player completed the questionnaire more than once during the study. Informed consent was obtained from the players schools to approach the players regarding the study. Voluntary completion of the survey was accepted as the player’s consent to participate in the study. The study was reviewed and granted approval by the Institutional Review Board. Given the near identical nature of the baseball HaOS that was administered to these softball athletes, the following description regarding the questionnaire itself and the definition of terms is taken directly from Zachazewski et al.17
Softball athletes completed a previously validated Hamstring Outcome Score (HaOS) questionnaire created by the Oslo Sports Trauma Research Center (OSTRC).24 This self-reported questionnaire provides information regarding incidence, recurrence, side of injury, time lost from play, whether injuries were unilateral or bilateral and symptoms associated with these injuries for general physical activities associated with athletics (running, jogging, accelerating, walking up two steps at a time, etc.). This questionnaire was specifically modified for baseball and softball related activities to improve the contextuality for these sports. To maintain validity of the questionnaire, only slight adaptations were made to the questionnaire that increased its relevance to the sports of baseball and softball (including characteristics regarding position, batting, throwing, and activities associated within baseball such as “running to first base,” stopping after and sprinting to first base in the wording of the questions). All questions were associated with general physical/athletic activities and the adapted vernacular was used to make sure the player understood the question, and to clarify how the question(s) related to the sport of softball. This questionnaire consists of five subscales whose scores are reported as percentages, with 100% indicating no hamstring complaints or symptoms; each item/question within the subscale is scored on a scale of zero to four when analyzed by the researcher. Players were unaware of the value assigned to each response. Lower scores/totals are expected for players with a history of HSI or current problems, indicating more disability related to HSI. The HaOS total score is the mean value of the five subscales.
-
Part A: Previous Injury - Inquires about the number of previous injuries, time since their most recent injury, for how long they were fully unable to practice/play, whether they missed practice/play because of the injury, and whether they had symptoms over the prior week.
-
Part B: Soreness - Acquires information regarding discomfort or soreness in the area of the “back of your thigh” during or after practice or play, symptom variation during the day, and symptoms with sitting. The question seeks information on discomfort or soreness compared to pain associated with specifically described physical activities related to daily living or sport specific activities (as worded in Part C).
-
Part C: Pain - Provides information regarding the frequency of pain in the “back of the thigh/hamstrings” and how quickly symptoms may have resolved and whether they are symptomatic with general athletic activities such as stretching, walking up steps, jogging and baseball specific activities such as base running.
-
Part D: Function -Asks general questions regarding posterior thigh pain or difficulty in the prior week with general running, jumping, accelerating, or decelerating after sprinting.
-
Part E: Quality of Life - Asks how much the athlete trusts their hamstring(s) during physical activity and whether they can perform at 100% due to any concerns about injuring/re-injuring their hamstring(s).
Previous data published in 2019 by Zachazewski17 for outcomes of the HaOS in baseball players was used for comparisons for HSI and HaOS scores between sports and positions. Table 1 presents the differences and similarities in data collection between the softball and baseball data
Statistical Methods
Descriptive statistics including mean and standard deviation for continuous variables and frequency and proportion for categorical variables were calculated to characterize the softball athletes. Differences in injury occurrence, recurrence, bilaterality, and time lost between softball and baseball athletes were compared using a chi-square test. To examine the difference between sport and injured and non-injured athletes, a mixed effects linear regression model was fit to the data with a varying intercept to account for athletes nested within school and position. A p-value of less than 0.05 was considered statistically significant and the results of inferential analyses are presented with corresponding 95% confidence intervals. All analyses were carried out in R (R Core Team, http://www.r-project.org) with the lme4 and ggeffects packages.
RESULTS
Responses were received from 12 of the 16 teams initially asked to participate in this study. Of the 264 softball athletes associated with those 12 teams, 156 softball athletes (mean age 19.5 +/- 2.1 years) chose to participate in this self-reported survey study by agreeing to complete the survey (59% completion rate). Out of the athlete responses were received from the 12 teams, 100 athlete responses were received from seven different Division I teams while the remaining 56 responses were from five Division III teams The softball study group is comprised of 56 infielders, 38 outfielders, 37 pitchers, and 25 catchers.
Hamstring Injury in Softball Athletes
A total of 47 athletes (30.1%) answered that they had a history of hamstring injuries or posterior thigh pain (HSI). Notably, softball athletes with a HSI were seven months older on average compared to those without a history of HSI (20.2 +/- 1.4 versus 19.5 +/- 1.2, p=0.005). Both height (65.8 inches +/- 2.5 in injured versus 66.1 +/ -2.7 in uninjured, p=0.611) and weight (157 pounds +/- 22 in injured versus 153 +/- 22 in uninjured, p=0.348) were comparable between the groups.
HSI by position is reported in Table 2. The proportion of injury ranged from 26% (outfield) to 44% (catcher).
Injury history and time lost to play are reported in Table 3. The frequency of recurrent injury and bilateral injury of softball athletes who reported a history of HSI was the same at 15 (32%). Of the 47 athletes with HSI, 33 provided data on time lost from play, the majority of which (82%) reported less than one week lost.
The HaOS score in softball athletes is reported in Table 4. Across all domains, injured athletes had a lower average score (i.e. poorer) compared to uninjured athletes (-7.4, p=0.001). Apart from soreness (-4.6 difference, p=0.092), differences between injured and uninjured athletes were statistically significant. The largest differences were observed with QOL (-9.4, p<0.001) and symptoms (-9.3, p<0.039).
Self-reported injury between softball and baseball are compared in Table 5. HSI’s were more common in softball athletes (N=109 or 30.1.%) in the current study compared to the baseball players (N=156 or 22.4%). However, this difference of 7.7% was not significantly different between these sports overall (p=0.097; 95% CI -1.4% to 17.1%). However, when considering HSI by position, HSI was more common and statistically significantly greater was for softball pitchers vs baseball pitchers (15% increase, p=0.041; 95% CI -1% to 31%). No other positions demonstrated a statistically significant difference, although 44% of softball catchers reported HSI vs. 29% of baseball catchers.
Table 6 presents data describing which leg experienced HSI compared to the throwing side in pitchers. All 10 pitchers who answered the survey threw right-handed. There were no left-handed pitchers. Seven of these 10 right-handed softball pitchers who experienced HSI reported left leg HSI. One other right-handed pitcher reported bilateral HSI. While for baseball pitchers throwing side and the side of HSI did not appear to have any type of association.
There were no significant differences in the rate of recurrence (3% difference, p=0.753) and bilaterality (1% difference, p=0.934) between collegiate softball and baseball players (Table 7).
Time lost to HSI was significantly different between collegiate softball and baseball players (p=0.009) (Table 8). Of the softball players who self-reported a hamstring injury or posterior thigh pain only 18% missed greater than one week of sports participation compared to 47% of baseball players who reported that they required greater than one week off due to injury before being able to return to play (29% difference, p=0.009; 95 CI 9% to 48%).
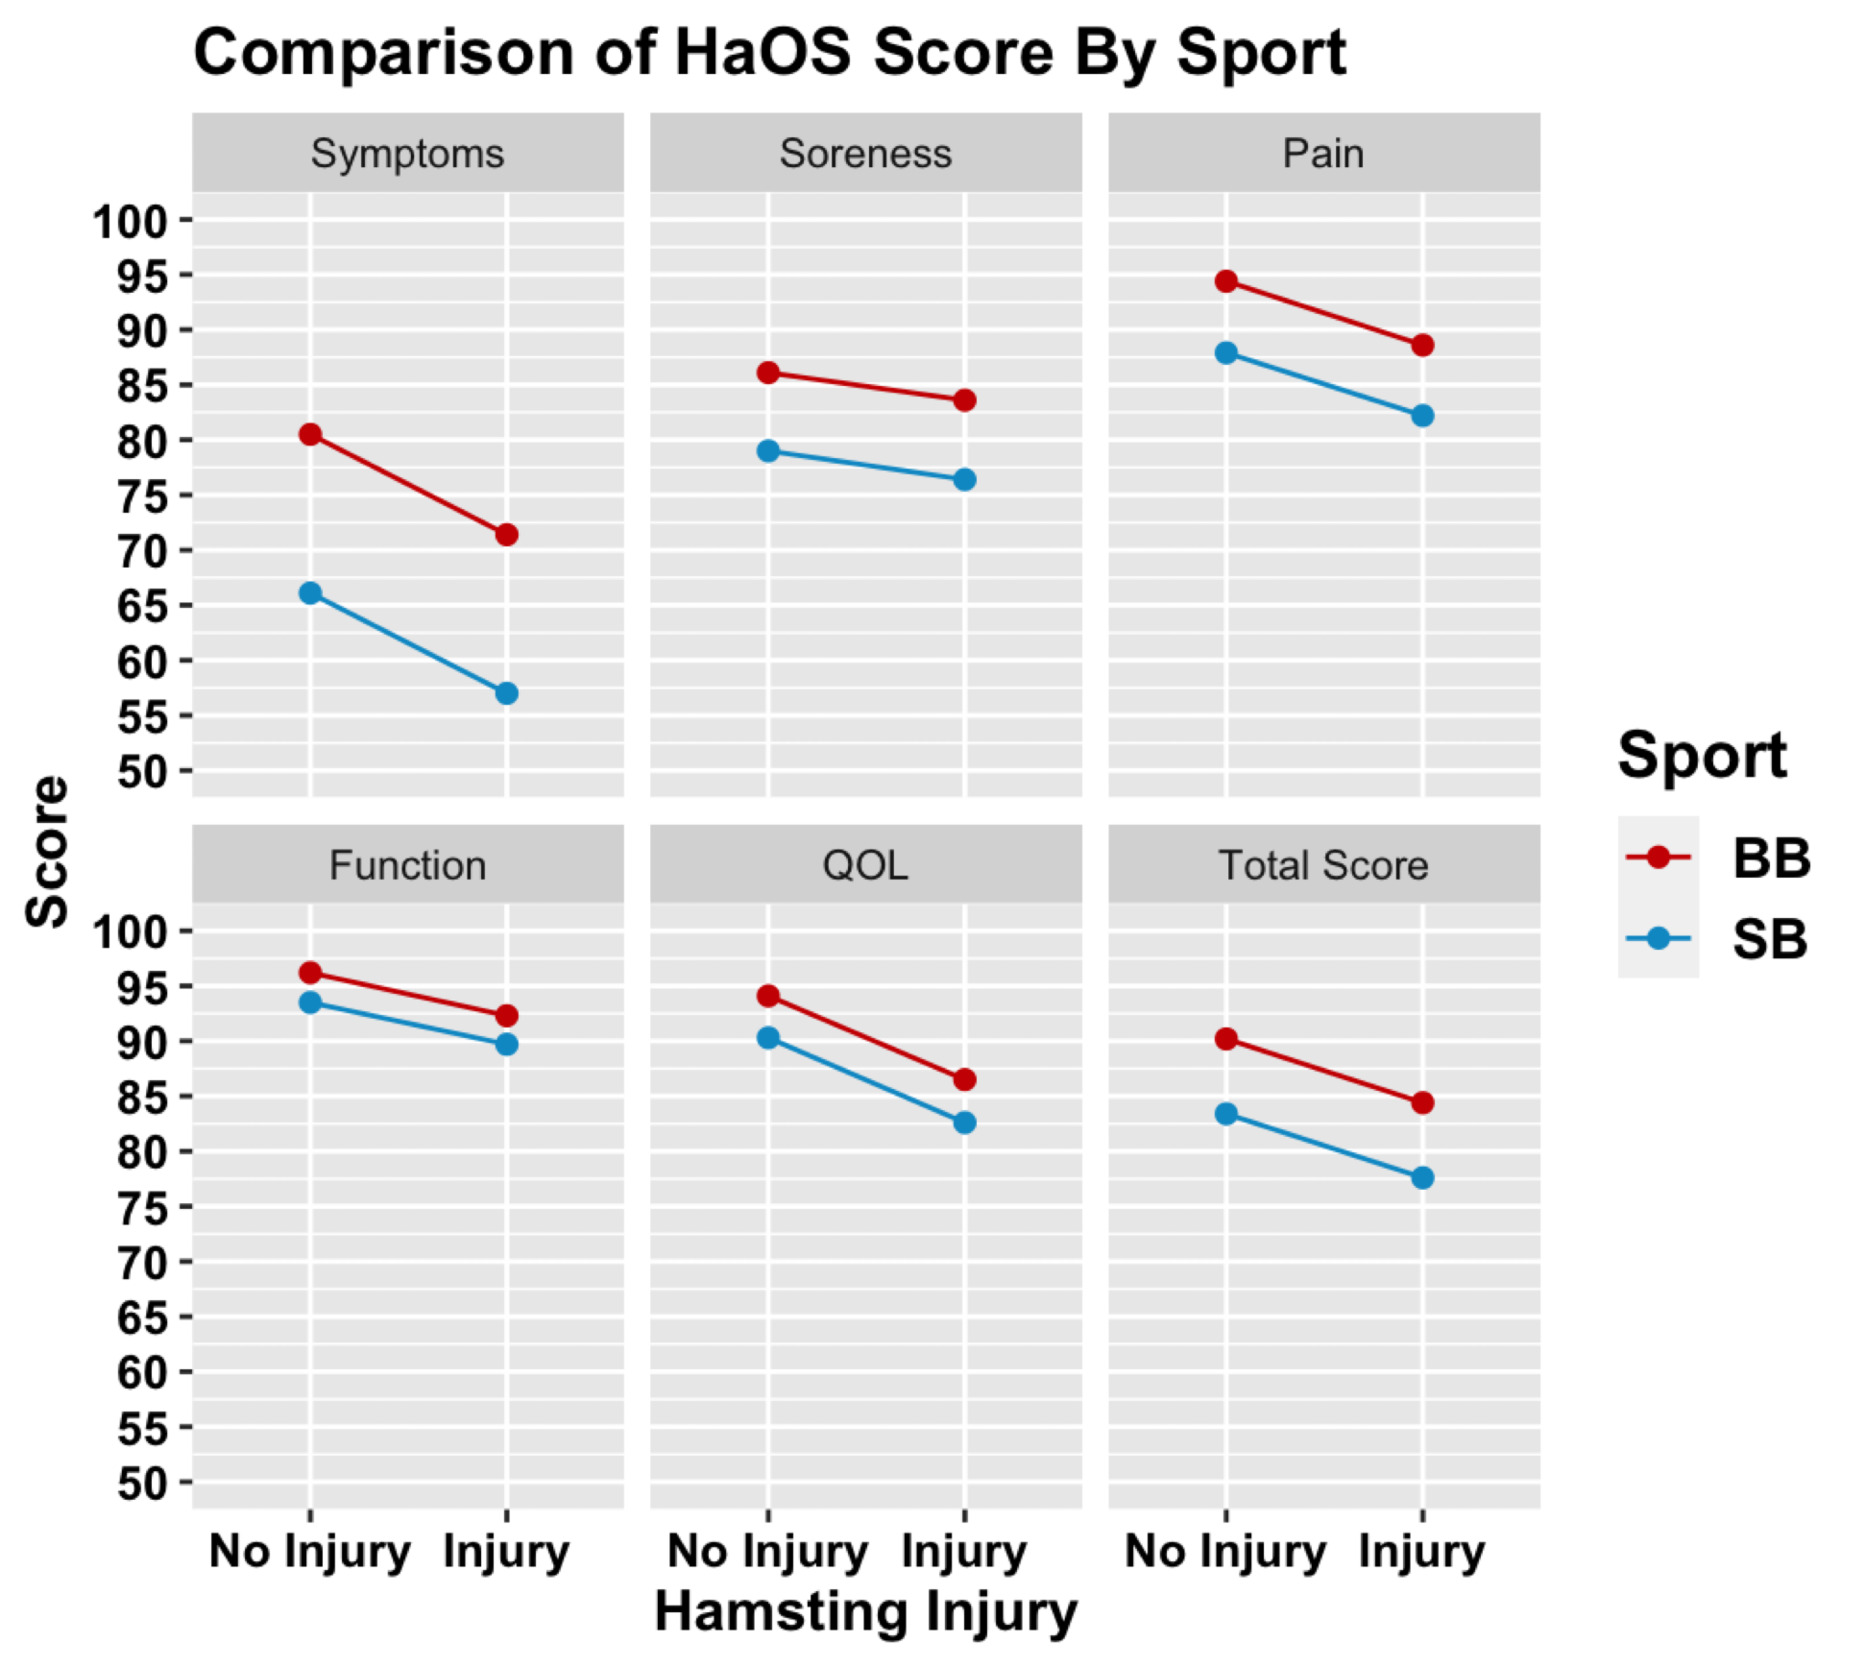
The HaOS domain scores and differences between softball and baseball athletes are presented in Table 9 and Figure 1. Across all domains, the mean HaOS score was lower in uninjured softball athletes compared to baseball athletes. In the softball athletes who self-reported HSI, scores were lower across all domains of the HaOS, with the exception of soreness. Supplementary Tables 1 and 2 present the responses to the HaOS for softball athletes.

DISCUSSION
This study aims to report the Hamstring Outcome Scores (HaOS), prevalence, recurrence, time lost to play and an overall HSI profile in collegiate softball players, a largely understudied population of athletes. Findings were then compared to previously collected data in male baseball players to identify differences between these sports in prevalence, positional profile, time lost and HaOS.17 Key findings provide insight into the risk of injury among softball athletes and may have important implications for the consideration and development of sex-driven and sport specific approaches to HSI screening and risk assessment, as well providing the clinician with valuable information to assist them in developing preventative and management approaches.13,26
Softball Hamstring Injury
Overall, injuries in NCAA women’s softball players have been reported to occur primarily with fielding (11.38%) and throwing activities (11.45%), with the outfielder position most at risk for injury per athlete exposure.27 Bolz et al. reported that the top three softball-specific activities which cause HSI are baserunning, running and fielding and are consistent with baseball.28 Thirty percent of the collegiate softball players in this cohort reported a history of HSI. This is the first study in the softball literature to provide detail regarding HSI by player position. Among softball players, HSI was most prevalent in catchers (44%) followed by infielders (29%), pitchers (27%), and outfielders (26%). Though not statistically significantly different, these data demonstrate that almost 50% of catchers reported HSI. This was an interesting finding given the lack of running, cutting and sprinting involved in playing the catcher position compared to the infield and outfield. Catchers run the basepath just as frequently as other positions; however, they rise and squat repeatedly, which may lead to a difference in hip and knee flexibility and strength metrics, and possibly a subsequent risk for HSI. Further, when targeting a base in game play, softball catchers often throw from their knees as opposed to their feet which may introduce additional load on the hamstrings.
Though softball athletes with HSI were slightly older (seven months) than uninjured athletes, physical characteristics were generally comparable. As expected, HaOS outcomes for softball players with HSI history were significantly lower than uninjured players in symptoms, pain, and quality of life sub scores. As previously reported regarding soccer athletes, using and tracking the HaOS may be a useful tool for softball players to flag at-risk athletes for preventative training and to assess the impact of intervention.25
Softball vs Baseball Prevalence
It is important to understand HSI in overhead throwing athletes as it has been reported to be the most common lower extremity muscle injury in baseball players.28,29 In contrast, there is a clear paucity of literature investigating the softball players regarding specific injury patterns, including HSI. Results of this study indicate that overall collegiate softball players self-report a higher rate of HSI (30.1%) than baseball players (22.4%; p= 0.097) when comparing this with baseball data from Zachazewski et al,17 although this was not statistically significantly different. However, significant differences are demonstrated for self-reported HSI by players between positions.
While this overall difference in the rate when all players are considered as a group is not significantly different, it does conflict with the most recent NCAA epidemiology study (2014-2019) of hamstring tears (partial and complete) among sex-comparable sports that found rates were higher in baseball/softball, soccer and track and field among men when compared to women.28 Specifically, softball players had a hamstring injury rate of 1.40 injuries per 10,000 AEs (95% CI) compared to baseball players at 2.5 injuries per 10,000 AE.28 It is important to recognize that this NCAA data is derived by an injury surveillance program, reliant on athletic trainer documentation of an injury and is the current standard system. A reportable injury is one that occurred because of participation in an organized intercollegiate practice or competition requiring medical attention by a team certified athletic trainer or physician (regardless of time lost). The current study reflects the athlete’s self-report of HSI and dysfunction, and may more accurately illustrate the athlete’s experience, which in some cases may be more clinically relevant. Use of an instrument such as the HaOS may uncover unreported symptoms and perhaps more subtle injury that did not require medical attention. These unreported symptoms and subtle injury may ultimately place athletes at risk for more significant injury. This may help explain and identify a subgroup of female athlete HSI underrepresented by standard NCAA injury surveillance for which injury prevention efforts may be targeted.
Moreover, though NCAA studies refer to softball and baseball as comparable sports, it is important to note there are several differences that may have an impact on injury rates in general and HSI specifically. First, the fields are different in size and character. Softball fields are smaller in all dimensions with an all-dirt infield, a flat pitching mound that is much closer to home plate and a much shorter base path. There are also differences in batters, baserunners and position players. In softball, there are slappers (generally fast lefty batters) who make contact in motion to get on base fast. Regarding stealing, there are no leads in softball as permitted in baseball. Positional differences will be discussed below. It is not currently understood how these differences between sports impact HSI rates in baserunners and position players, but they are important to acknowledge. There are likely several influential variables, not yet understood, that may have led to female softball players more frequently self-reporting hamstring injury and dysfunction in this study. Possible explanations are proposed in subsequent sections.
Positional Comparison
Comparing softball positional data with baseball from the study by Zachazewski et al,17 this study demonstrated that there was a significantly higher prevalence of HSI in female softball pitchers compared to male baseball pitchers (27% and 12%, p=0.041). Further, among the 10 softball pitchers who reported HSI, eight indicated the symptoms were in their stride/lead leg. For right-handed pitchers this would be their left leg. Pitching is the position with the most striking differences between the sports, and a large factor in the argument against calling these sports sex comparable. The softball pitch involves a windmill or underhand motion while the baseball pitch is overhead. The phases of the softball windmill pitch have been described in detail.30–34 For right-handed pitchers, during the stride phase of the pitch cycle, the left hamstrings would be subjected to the greatest stress. Activation of the hamstrings and other muscles in the lumbopelvic hip complex are required for the acceleration phase and delivery of the pitch.34 The HSI reported by right-handed pitchers in this study for their stride or left leg may have an impact on the athlete creating stride length that is too long or too short, potentially effecting overall pitch mechanics, ball acceleration, and upper extremity problems.33,34 Further research is needed to better understand how HSI might affect the kinematics of the windmill pitch or how windmill pitch mechanics might affect HSI. Other differences between softball and baseball pitchers may influence risk of HSI, including pitch types, counts and rules regarding limits. Strict pitch limits exist for baseball and are based on age.35 These rules restrict number of pitches per game, number of consecutive games pitched, rest days between starts, and types of pitches an athlete can throw. Similar rules do not exist in softball where pitchers commonly throw more pitches per game and season than their baseball counterparts.32 The difference is even more dramatic at the youth level which may have a cumulative impact on risk of HSI once the athlete reaches the elite level. Finally, softball does not utilize the designated hitter position. Therefore, softball pitchers’ bat and run the basepath (the activity when most HSI occur) presumably more frequently than baseball pitchers at the collegiate level and just as much as other softball position players.
Despite the smaller field size, softball and baseball infielders and outfielders require similar skill for their positions. Thus, it is not surprising that no significant difference was found in HSI between these position groups in softball versus baseball (-1% difference for infielders p= 0.872, -6% difference for outfielders p= 0.561). Interestingly, there was no significant difference in HSI in catchers; although softball catchers more frequently reported HSI (44%) than their baseball counterparts (29%). (Table 5). This may be partly attributed to differences in the fundamental techniques. With a smaller field, softball catchers generally have less time to react, throwing from their knees as opposed to “popping up” and throwing from their feet, a fundamental movement emphasized in baseball. From the “squatted” position, softball players push off one foot, which produces rapid knee extension, sliding forward on the other knee to produce a stable position from which to throw. This sequence of knee extension and rapid trunk rotation repeatedly may introduce load on the hamstrings specific to softball catchers. While this is largely based on empirical evidence, the differences in catcher mechanics are notable and warrant future research to determine the role in HSI.
HSI Recurrence and Bilaterality
Recurrent and/or bilateral injury were not significantly different between softball and baseball athletes. Both of these rates of recurrent injury are consistent with that generally reported in the literature for HSI across several different population of athletes, but higher than observed across all NCAA sports (14%) and higher than HSI recurrence rates in NCAA baseball (14.08%) and women’s softball (7.41%),28,36 again highlighting that HSI and dysfunction may be underrepresented in current standard surveillance methods. Self-reported surveys such as the HaOS may prove insightful here.
There are several factors that may influence recurrent HSI in both male and female athletes. As investigated by O’Sullivan et al, there may be sex-based differences in HSI risk factors beyond injury history, including anterior pelvic tilt as well as morphological differences including greater degrees of femoral and acetabular anteversion and larger pelvic width, which can increase strain on the hamstrings.26 Further research is needed to define how structural and functional differences between softball and baseball players have a role in both primary and secondary HSI.
Time lost
Limiting time lost to HSI is of utmost interest to all stakeholders in softball and baseball including athletes, medical staff, and coaches. Boltz et al. found that there has been larger proportion of time lost associated with collegiate hamstring injuries in recent years.28 In this study, softball athletes reported less time lost to injury or returning to play significantly faster than baseball players. 82% of softball players reported losing seven days or less, while nearly half of baseball players (47%) (p= 0.009) lost more than seven days (Table 8). This study’s self-reported data is consistent with the most recent NCAA report that stated that for hamstring tear injuries in women’s sports, the average time lost was 10.6 days whereas the average time lost in men’s sports 12.4 days. Despite softball athletes requiring less time off before return to play, functional scores were significantly lower than for baseball athletes with a history of HSI. Time lost variability is complex and multifactorial. Future research should attempt to expose and clearly define the determinants of injury severity and the association with recovery in this population.
Hamstring Outcome Score
The domains measured and the total score of the HaOS, attempt to demonstrate the athletes’ self-report of their overall “hamstring health.” Significant differences were demonstrated between players with a history of HSI and non-injured players on the HaOS for the individual domains of symptoms, pain, function in daily activities and sport and quality of life. “Soreness” was the only domain where the difference was not statistically significant. During practice or play an athlete must have confidence in their ability to perform at 100% without fear of an injury occurring. They must “trust” their body. Notably, compared to their male counterparts, female athletes reported a significant lack of trust of hamstring function during sports related activity and report this concern keeps them from performing 100%. This is also the case in uninjured softball athletes. The score for the pain domain in the HaOS demonstrates that softball athletes in this study report significantly greater pain than baseball players during specific sport activities such as running, rounding the base path, accelerating and decelerating while running to first base, regardless of injury history. Some studies suggest that female athletes tend to report higher levels of pain and feel that reporting pain to coaches is more important than their male athlete counterparts, while other research suggests that female athletes tend to take less time off from sport due to injury, despite higher pain level reports.37–40 This study indicates softball players have a lower HaOS score and report more symptoms, pain, loss of function and lower quality of life (“poorer hamstring health”), regardless of injury, compared to baseball players, which underscores the importance of screening and preventative programs for these athletes.
Limitations
Limitations to this study include recall bias as the HaOS questionnaire relies on athlete recall and accuracy. This questionnaire is a retrospective self-report of injury rather than a report of data that was collected objectively during the season by collegiate medical staff. Cuing was not given to the athlete while completing the survey. In addition, the softball surveys were electronic and completed on the athletes’ smart phone compared to the baseball study where a paper questionnaire was used.17 In the original study, paper questionnaires were handed out by research staff or the teams’ athletic trainer to athletes and collected immediately upon completion, likely increasing the percentage of responses. In this current study, requests for athletes to fill out the survey were made during team meetings or at the time of pre-season physicals by medical or research staff members. Athletes had the option of completing the survey at the time they were asked or a later time. This may have led to a lower percentage of completion.41–43 Finally, as the study was a convenience sample of collegiate softball players, an a priori sample size calculation was not performed.
CONCLUSION
Understanding the prevalence of HSI in collegiate softball athletes is important to identify those at risk. Softball pitchers self-report significantly more hamstring injuries than baseball pitchers while there was no significant difference reported between other positions. The HaOS demonstrated that collegiate softball players reported significantly poorer overall hamstring health, function and hamstring confidence than baseball players. Despite this, softball athletes lost less time in practice and competition after injury than their baseball counterparts. The information provided by this study and by using a tool like the HaOS, may help identify softball athletes at risk that may benefit from targeted prevention and management strategies to minimize time lost from competition and improve the overall hamstring health of athletes at risk.
ACKNOWLEDGEMENTS
The authors would like to acknowledge the assistance of Madalyn Hanrahan PT, Rachel Lampros PT, Jillian Mazzocca and Katherine Tarantino PT for their assistance with data collection during this study. We would also like to acknowledge the Brigham and Women’s Hospital Department of Rehabilitation Service for publication funding assistance.