
INTRODUCTION
Chronic non-specific low back pain (CNSLBP) is a prevalent musculoskeletal condition among athletes.1 The key risk factors contributing to CNSLBP development in athletes include sports-specific spinal loading, age-related degenerative changes, or sex-specific anatomical and physiological differences.2 The incidence of CNSLBP varies across sports, with reports of 32% to 51% in rowers, 55% to 89% in ice hockey players, and over 56% in judo athletes.3–5 Consequently, 30% of athletes with CNSLBP lost significant playing times, with absences lasting up to one year.6,7 Specific mechanical loading in sports, such as repetitive spinal compression, torsion, shear and end-range flexion, along with injury mechanisms like acute sprains or cumulative microtrauma in sports are associated with CNSLBP and spinal stability.8
The lumbar multifidi play a crucial role in spinal stability in sports, contributing two-thirds of overall spinal stability by all lumbar muscles.9 Functionally, the lumbar multifidi are divided into superficial and deep fibers, with deep fibers spanning two vertebral segments.10 Biomechanical studies have shown that the deep fibers of lumbar multifidi are crucial for maintaining spinal stability due to their cross-sectional area and short muscle fibers with segmental attachment to lumbar processes.4
Athletes in both contact and non-contact sports are subjected to diverse mechanical forces, including shear, torsion, bending, and compression that challenge the stability of the spine and pelvic region.11,12 For athletes participating in non-contact sports, such as golf, the spine is challenged by repeated compression, anterior-posterior shearing, torsion, and lateral bending forces throughout the trunk.13 In contact sports like American football, players are susceptible to high compressive forces on their lumbar spine, reaching up to 8000 N during blocking and tackling.11,12 In these activities, repetitive sport-specific movements may lead to spinal injury due to increased bending moments, particularly when nearing the limit of the range of motion.14
Lumbar multifidi alternation in athletes with CNSLBP
A factor that might influence the extent of lumbar motion is the fatigue of the lumbar multifidi, considered a local stabilizing group.3,14 The multifidi play an important role in enabling the global muscles of the trunk to generate force required for increasing movement velocity and regulating the amount of lumbar flexion and extension.14 Muscle fatigue of local stabilizers would therefore hamper the efficiency of the active components of the spine due to impaired stability and protection against the internal and external perturbations that occur during sports.14 Supporting this, an electromyographic (EMG) study demonstrated that athletes with CNSLBP exhibit greater fatigability of the lumbar multifidus, with a significant decrease (>40%) in myoelectric power density spectrum during exercise compared to asymptomatic athletes.15 The mechanical demand of repeated lumbar flexion and extension in sports, along with impaired motor control of lumbar spine may place undue stress on the lumbar multifidus, which is a key stabilizer, potential contributing to injury.14 Considering a specific spinal level, prolonged or repeated shear and compressive forces at L5/S1 segments were reported during sports associated with higher loads to the spine, such as rowing.16 This may be explained by increased fatigability of the lumbar multifidi, which compromises segmental stability and force compensatory activation of lower limb muscles to maintain knee extension force.3
The atrophy, contractibility and fat content of the lumbar multifidi vary among individuals with CNSLBP.15 Both non-athletic and athletic populations have demonstrated conflicting imaging results in the morphological and compositional features of the lumbar multifidus associated with low back pain.17–19 Football players, dancers, weightlifters, cricketers, and judo athletes with CNSLBP exhibit atrophy of the lumbar multifidus, characterized by decreased cross-sectional area (CSA) and greater side-to-side asymmetry.17,18 In symptomatic runners, the muscle mass and strength of the lumbar multifidus, measured and suggested by muscle thickness (MT), is also reduced up to 10% compared with asymptomatic ones.20 However, there is limited evidence regarding muscle quality of the lumbar multifidi, such as fatty contents or non-contractile components, measured by ultrasound echo intensity (EI), in the athletes with CNSLBP. The decreased muscle quality, like increased fatty infiltration or non-contractile components in the lumbar multifidi may lead to decreased contractile ability during daily and sports functions which may increase risk of lower limb injuries.11 In light of the above differences observed in the athletes with CNSLBP, further higher quality longitudinal research, including randomized controlled trials (RCT’s) (e.g., for assessing efficacy of rehabilitation) would be indicated.21
Ultrasonographic measurements of lumbar multifidus
Ultrasound-imaging is a valid, reliable, and non-invasive technique for diagnosing disease and assessing the morphological and compositional changes of muscles and soft tissues.22 When compared to Magnetic Resonance Imaging (MRI), ultrasound-imaging demonstrated an accuracy for measuring the specific soft tissues up to 90% or above in different body parts, such as shoulder, knee and back22 but at a lower cost of the assessments and with better portability, making it readily available in most clinical settings.23 Further, emerging evidence showing impaired composition of the muscle, including lumbar multifidi, can be objectively quantified by ultrasound-imaging.24 Systematic reviews have reported on the morphological and compositional changes of lumbar multifidus and CNSLBP in general population.9,25 However, no review distinguishes the morphological and compositional differences in the athletes with CNSLBP who have a different activity profile and withstand different spinal loads than non-athletic population.
Objectives
To investigate the morphological and compositional features of the lumbar multifidi at two levels in athletes with and without CNSLBP.
METHODS
This systematic review and meta-analysis was registered in PROSPERO (CRD42023404357) and reported according to the Preferred Reporting Items for Systematic Review and Meta-analyses (PRISMA) guideline.26 No institutional ethics approval was required.
Search strategy
PICO question and electronic database searches
A PICO question was formulated to guide the data search process. The PICO question was “What are the differences in the morphological and compositional features of the lumbar multifidus (O) in athletes (P) with (I) and without (C) chronic non-specific low back pain (CNSLBP)?”. An electronic database search of MEDLINE, CINAHL, Embase, and Web of Science was conducted from inception to May 2025. The keyword data search related to the imaging of paraspinal muscle in athletes with low back pain is shown in Supplementary Table 1. The reference lists of all included studies were manually reviewed for potential eligible studies. The titles, abstracts and later full texts were independently screened by two reviewers (W.K.W.) and (S.M.H.T.). Any disagreements were resolved by the third reviewer (A.C.L F.).
Study selection
Studies were included if (i) CSA, MT or EI was used to access the morphological features of the lumbar multifidus; (ii) the study compared athletes with and without CNSLBP (pain duration > 3 months); and (iii) study design was observational, a randomized controlled trial, or longitudinal. Studies were excluded if (i) the non-muscular diseases were involved in CNSLBP i.e. infectious diseases (e.g., kidney infections, osteomyelitis), psychological disorders (e.g., anxiety, stress, depression), complex pain disorders (e.g. fibromyalgia) or systematic diseases (e.g., spinal tumour, rheumatic diseases, ankylosing spondylitis), neurological diseases (e.g. stroke, dementia), congenital diseases that relate to muscular atrophy (e.g. Duchenne muscular dystrophy, Becker muscular dystrophy), nerve root diseases (e.g. radiculopathy) or post-operative conditions (e.g. spinal surgeries); (ii) study population involving animal models or cadavers; or (iii) editorials, commentaries, opinion-based reviews or studies.
Risk of bias and quality assessment
The risk of bias and the quality of evidence of the included studies was assessed by the Newcastle Ottawa Scale (NOS). The NOS is a valid and reliable tool in assessing the quality of non-randomized studies (cohort, case-control and cross-sectional studies) and it uses a star rating system.27 This scale is designated for observational studies, and the ratings are based on the selection of subjects, comparability of study groups and outcome of interest (cohort studies) or attainment of exposure (case-control studies and cross-sectional studies).28 The score of NOS of each study was calculated by dividing the number of stars counted by the item number. Each study was graded as low, moderate, and high quality based on the score. Cut-off points were defined as low quality (0/9 to 4/9), moderate quality (5/9 to 6/9), and high quality (7/9 to 9/9).
Additionally, Grading of Recommendations, Assessment, Development, and Evaluation (GRADE) framework was applied to assess the overall quality of evidence across all included studies, and it assessed the level of evidence according to four principal domains, including the Revised Cochrane Risk of Bias tool (RoB2), inconsistency, indirectness, and imprecision.29 The quality of evidence was classified as very low, low, moderate, or high and the judgement about the strength of recommendation may balance between benefits and harms, the translation of the evidence into specific circumstances and the certainty of the baseline risk.29 The GRADE Evidence Profiles were constructed, and the table were then produced by Review Manager (RevMan) and then transferred into GRADEpro web-based software.30 In the process of both quality assessments, disagreements in the scores during rating were resolved by a third reviewer.
Data extraction
All data were independently extracted by two reviewers (W.K.W.) and (S.M.H.T.). A data extraction form was used to obtain relevant data from each article including (i) Study characteristics (authors, year of publication, country, study design); (ii) Study participants (sample population, gender and age); (iii) Measurement methods; (iv) Sports types; (v) Definition of CNSLBP and control group; and vi) Main findings, including the summary of the differences of morphological and compositional measures between CNSLBP and non-CNSLBP groups and correlations between morphological and compositional features of lumbar multifidus. Relevant information was extracted from the individual studies and disagreement was resolved by the third reviewer (A.C.L.F.).
Data synthesis and meta-analysis
Data from the included studies were synthesized using both narrative and quantitative methods. For the narrative synthesis, a detailed description of the study characteristics was provided, including authors, year of publication, country, study design, sample size, mean age, measurement method, sport types and group classification.
RevMan 5.4 was used to calculate the effect size and for meta-analysis with random effect model. With the biomechanical model and previous research studying the differences between CSA and CNSLBP,31 the difference in CSA, MT and EI at L4/L5 and L5/S1 levels were pooled. The outcomes were presented using mean difference (MD) with 95% confidence intervals (CIs) as they were measured in the same scale for the outcome measures. All p-values were two-tailed, with statistical significance defined as ≤0.05.
Heterogeneity risk was evaluated using the I² index, with heterogeneity being considered when I2 was greater than 50%. Funnel plots were constructed for each morphological and compositional features of lumbar multifidus to evaluate the publication bias. Each individual point represented the effect size from an individual study. The outer dashed lines delineated a region within which 95% of studies were anticipated to fall due to sampling variation, assuming no publication bias or heterogeneity. If there were any asymmetric plots or p-values ≤ 0.05, potential bias was indicated.32
Correlational analyses using Pearson’s r were used for continuous anthropometric data, while associational analyses using Odds Ratios (OR) were used for binary clinical outcomes, including lower limb injury and the likelihood of returning to sports (RTS). Correlation strength was interpreted using the following thresholds: low correlation = 0.10–0.39, moderate correlation = 0.40–0.69, and high correlation = 0.70–1.00. For OR, a 95% confidence interval not crossing 1.00 was considered statistically significant.33 Effect sizes for OR were classified as follows: small (1.00 < OR ≤ 1.49), moderate (1.50 ≤ OR ≤ 2.49), and large (OR ≥ 2.50). For protective effects (OR < 1.00), the reciprocal was used (e.g., OR = 0.50 corresponds to a moderate effect).34
RESULTS
Search results
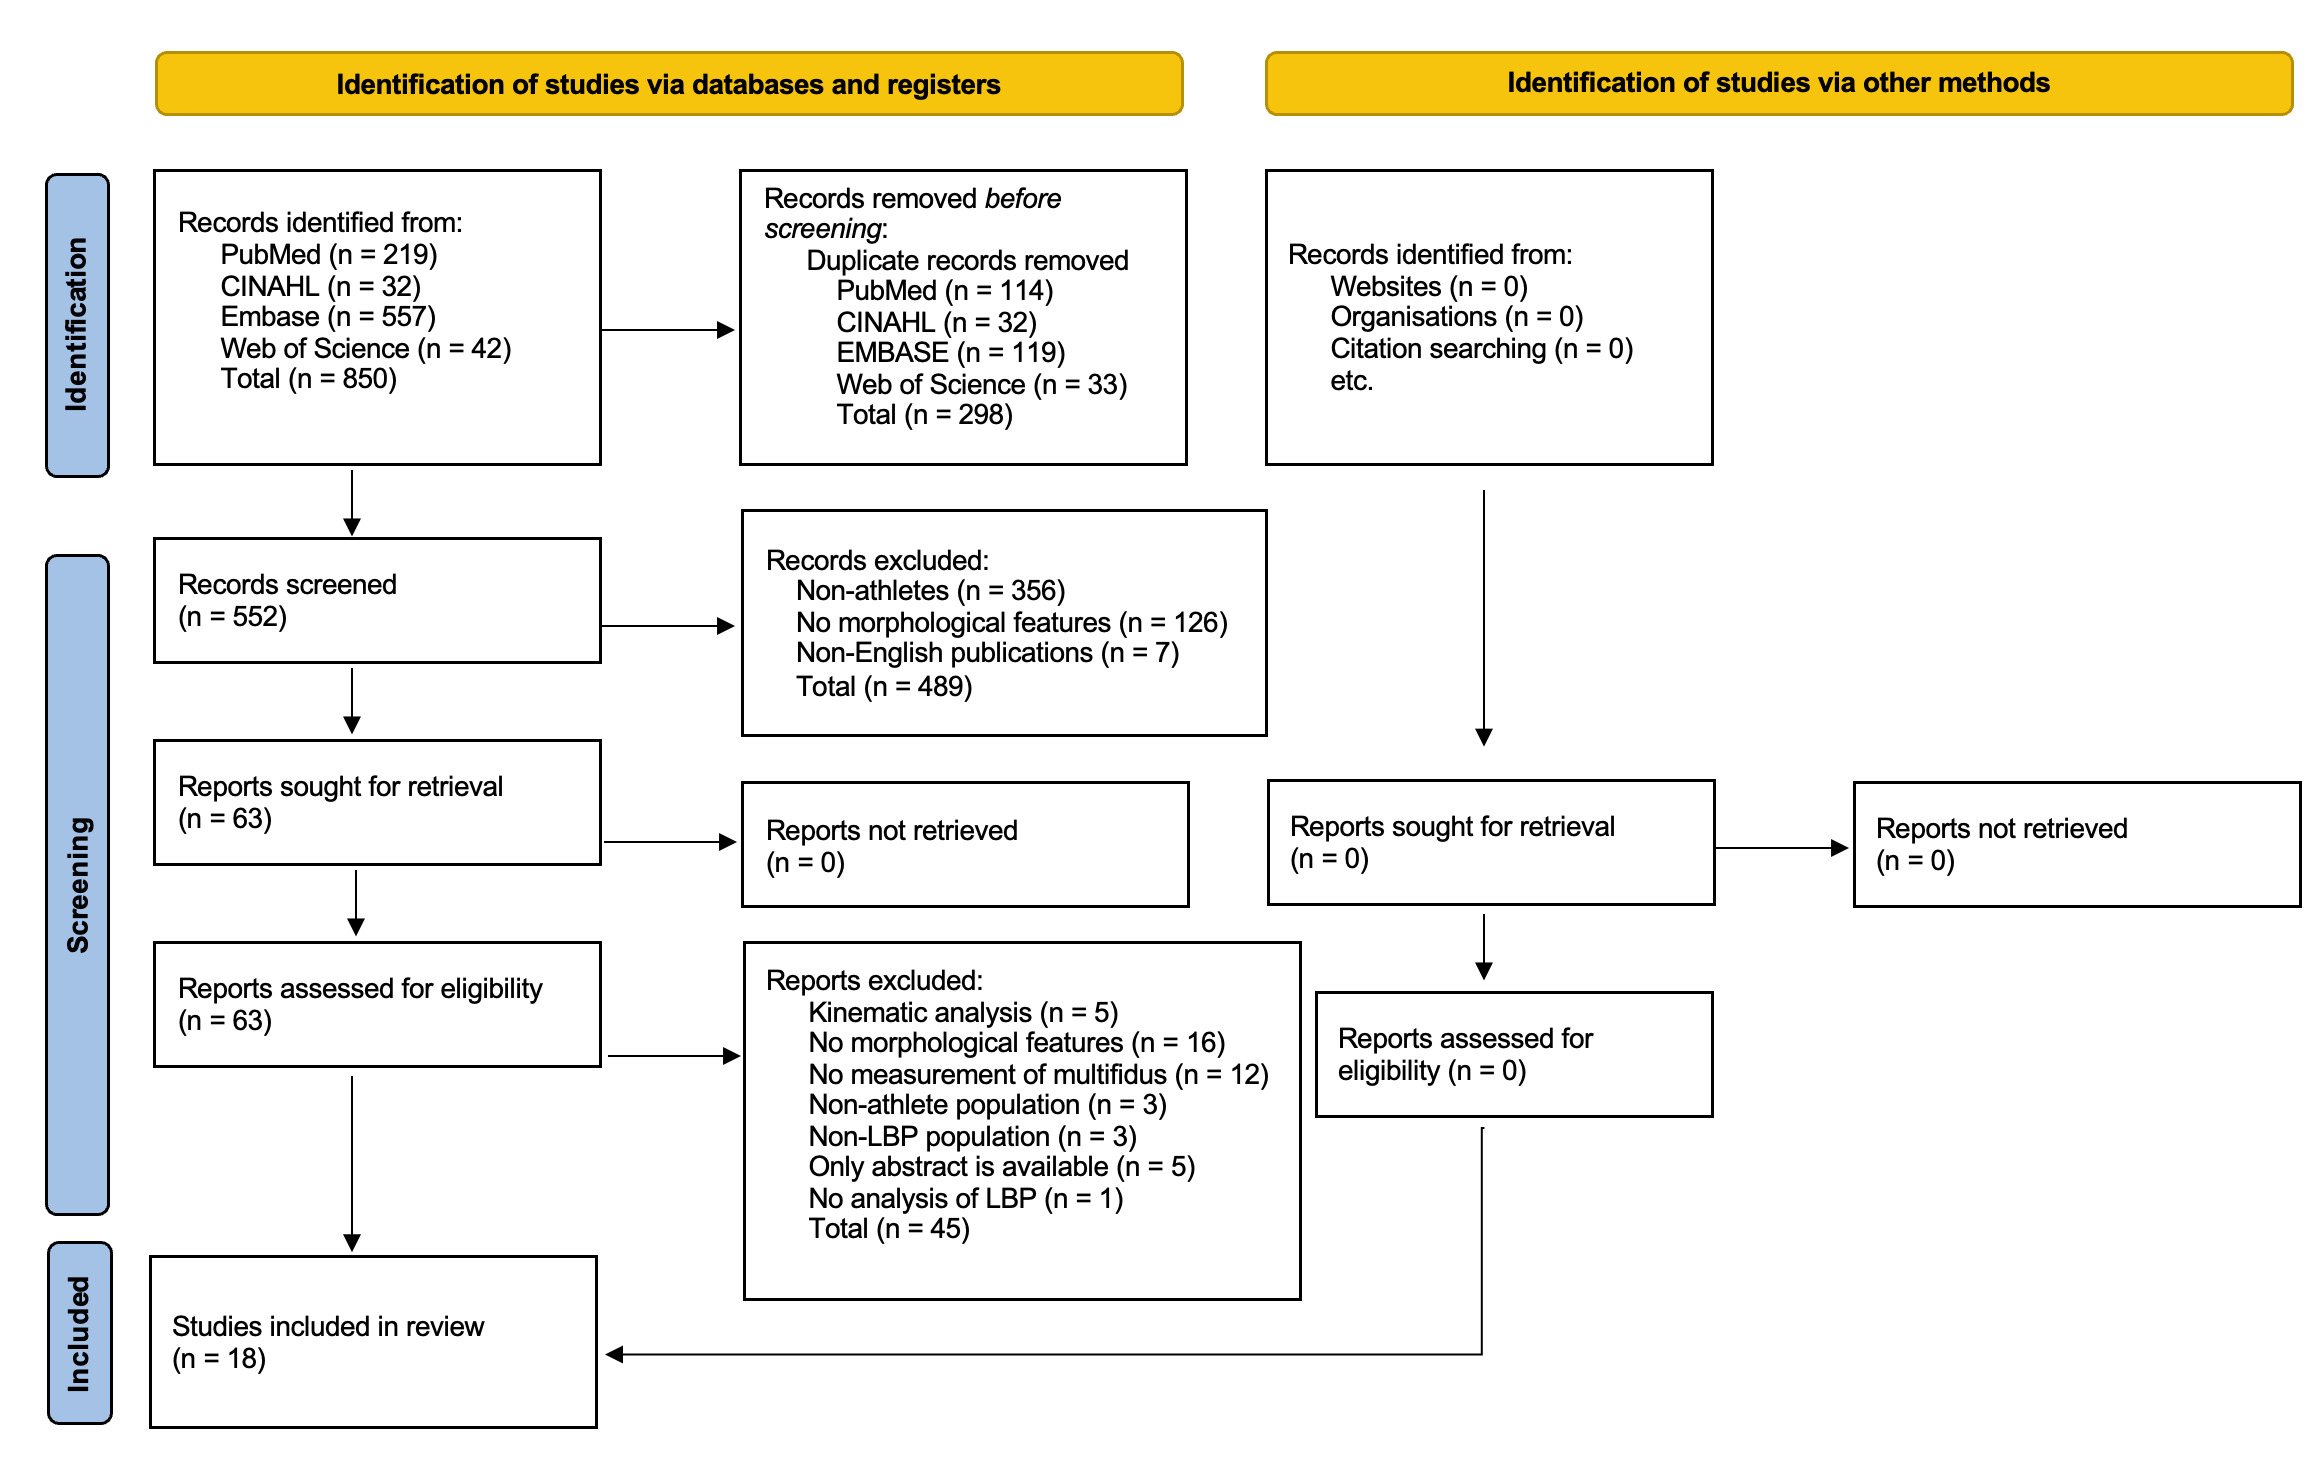
The PRISMA flow diagram is presented in Figure 1. A total of 850 papers were initially retrieved, and 552 records were screened after the removal of duplicates. Of the 63 full-text articles retrieved and assessed for eligibility criteria, 45 were excluded, leaving 18 studies for inclusion.

Study characteristics
The characteristics of the included studies are detailed in Table 1. The 18 studies were published between 2008 and 2022, and consisted of 14 cross-sectional, one case-control, and three cohort studies. A total of 1065 subjects were included with cohorts ranging between 26 and 151 subjects whose mean age varied between 9.8 and 26.5 years. The range of duration for defining CNSLBP was from three months up to three years and the included types of sports were non-contact sports: athletics, running, alpine skiing, dancing, weightlifting, cricket, and gymnastics; and contact sports: ice hockey, soccer, wrestling, judo, rugby, and basketball.
Clinical evaluations of the multifidi were conducted using MRI, dual-energy X-ray absorptiometry (DEXA) and anthropometric measures (five studies) and ultrasound(US) imaging (14 studies). Thirteen studies measured the CSA of lumbar multifidi,4,5,12,17,35–43 while seven,4,11,12,20,38,39,43 and five11,12,17,22,37 studies measured the MT and EI of lumbar multifidus respectively.
Quality assessment
The average quality score of NOS was 7.56/9. Sixteen studies (89.9%) were of high-quality (NOS 7/9-9/9) and two (11.1%) were rated as moderate quality (NOS 6/9). Four were rated as 9/9 in the quality assessments,5,38–40 four as 8/9,17,20,41,44 eight as 7/9,4,11,12,35–37,45,46 and two as 6/9.42,43 (Supplementary Table 2).
The GRADE assessment indicated that the overall strength of the evidence for muscle morphology and composition differences in CNSLBP was low to very low (Supplementary Table 3). The evidence was primarily downgraded in the CSA at L5/S1 level and EI at L4/5 level due to risk of bias, stemming from a lack of blinding of the therapists in three studies11,35,39 and imprecision due to small sample sizes (<30 participants) in two studies.35,39
Difference of morphological and compositional features of lumbar multifidus for athletes with and without CNSLBP
CSA and MT findings were conflicting: eight studies (seven high-quality studies5,11,12,36,37,40,47 and one moderate-quality study43) reported significantly lower values in athletes with CNSLBP, whereas five high-quality studies12,35,36,38,48 found no significant differences. In contrast, all four high-quality studies12,22,37,49 examining EI reported no significant between-group differences (Table 2).
CSA of lumbar multifidus and CNSLBP
Conflicting evidence emerged from eleven studies evaluating CSA differences between CNSLBP and Non-CNSLBP.4,5,12,17,35–40,43 Specially, six studies (five high-quality studies4,5,17,37,40 and one moderate-quality study43) reported that CSA of lumbar multifidus was significantly lower in athletes with CNSLBP compared to asymptomatic athletes. This difference was most consistently observed at the L5/S1 level (four high-quality studies,4,17,37,40 with the finding of only one high-quality study40 ) was reported a similar result at the L4/5 level. In contrast, five high-quality studies12,35,36,38,50 reported no significant difference in CSA of lumbar multifidus between athletes with and without CNSLBP.
MT of lumbar multifidus and CNSLBP
The analysis included five high-quality studies,4,11,20,36,38 investigating only the L5/S1 level, presenting conflicting evidence. While four high-quality studies4,11,20,36 reported that athletes with CNSLBP had smaller MT as compared with control group, one high-quality study38 reported that athletes with CNSLBP were not significantly different from the healthy controls.
EI of lumbar multifidus and CNSLBP
Consistent results were found in four high-quality studies4,11,12,37 with 137 subjects that reported the EI of lumbar multifidus at L5/S1 level was not significantly different in athletes with CNSLBP compared to athletes without CNSLBP.
Correlations with body composition and anthropometric measures in athletes
Four high-quality studies investigated five anthropometric measures, including height, weight, lean body mass, total percent body fat and total mass, in relation to the morphological and compositional features of lumbar multifidus (CSA and EI)4,11,12,44 (Table 3). Four studies reported that weight, height and total body mass demonstrated significant moderate positive associations with CSA of lumbar multifidi, and three high-quality studies reported that EI was significantly and strongly positively associated with body fat percentage in athletes.4,11,12
Association with lower limb injuries in athletes
One high-quality study found that smaller CSA of lumbar multifidus was significantly associated with a higher risk of lower limb injuries in athletes42 (Table 3). The study reported that athletes with a smaller CSA of lumbar multifidi had 25% higher odds of injury in the pre-season and 43% higher odds during the competitive season. Both OR represents small effect sizes according to the OR classification.
Association with return to sports in athletes
One high-quality study45 utilized the Goutallier classification scale (GCS), a qualitative grading system for fatty muscle infiltration on MRI where 0 is normal muscle and 4 represents severe fatty replacement.51 That study found that a higher fatty content in muscle infiltration, including even a small increase (GCS grades 1 and 2), was significantly associated with a reduced likelihood of return to sports (RTS). Increased fatty infiltration with GCS=1 was associated with 79% lower odds of RTS (p<0.01; OR=0.21), while athletes with GCS>2 had 90% lower odds of RTS compared with those with normal muscle (GCS=0) (p<0.001; OR=0.1)45 (Table 3).
Meta-analysis
Four studies (three high-quality studies36–38 and one moderate-quality study43) were excluded from meta-analysis. The study conducted by Roy et al.36 was excluded because the raw data of both CNSLBP and control groups were not reported as CSA measurements. Noormohammadpour et al.'s study38 examined the L4/5 level of lumbar multifidus only and Fitze et al.43 took the average MT of across all lumbar levels, leading to their exclusion from the meta-analysis for lacking specific data on L4/5 and L5/S1 levels in athletes. Only one study conducted by Almazán-Polo et al.37 measured the EI in L4/5 level and it was excluded due to the limited number of studies investigating L4/5 level. After exclusion of the four studies, CSA at L4/5 and L5/S1 levels, and MT at L5/S1 level in both contracted and resting status and EI at L5/S1 level were pooled for meta-analysis.
CSA of lumbar multifidus and CNSLBP
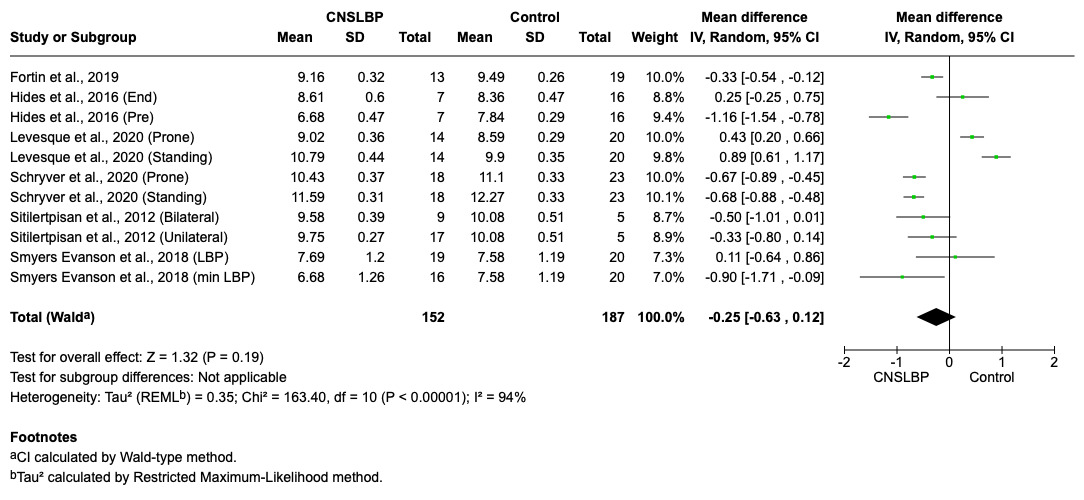
Seven high-quality studies11,12,22,35,37,40,48 reported that CSA of lumbar multifidus in CNSLBP group was not significantly different at the L4/5 (MD=-0.21*,*95% CI=-0.64 to 0.22, p=0.34) (Figure 2) and L5/S1 levels (MD=-0.25, 95% CI=-0.63 to 0.12, p=0.19) (Figure 3) in athletes when compared to healthy controls.
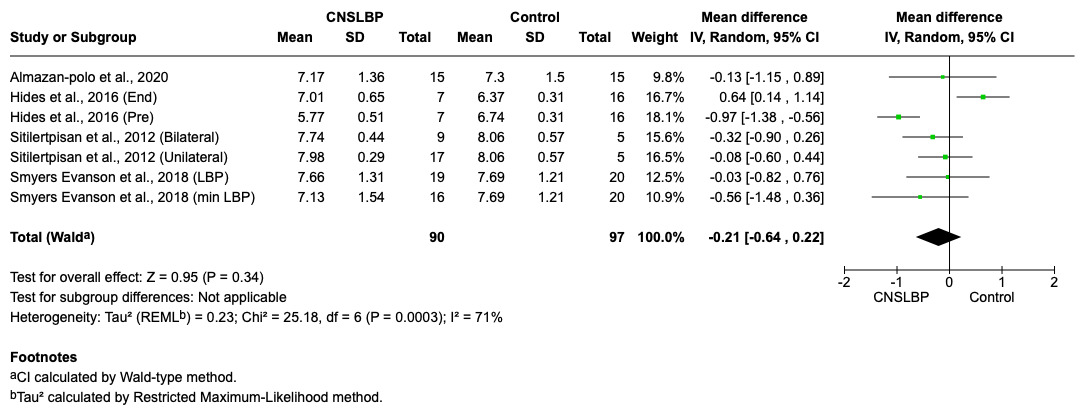
Figure 2. Summary of the between-group differences in CSA of the lumbar multifidus at L4/5 level in athletes with and without chronic non-specific low back pain.

MT of lumbar multifidus and CNSLBP
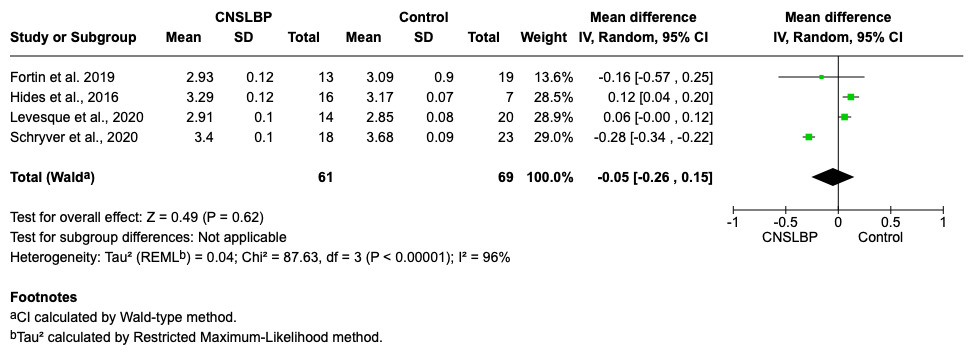
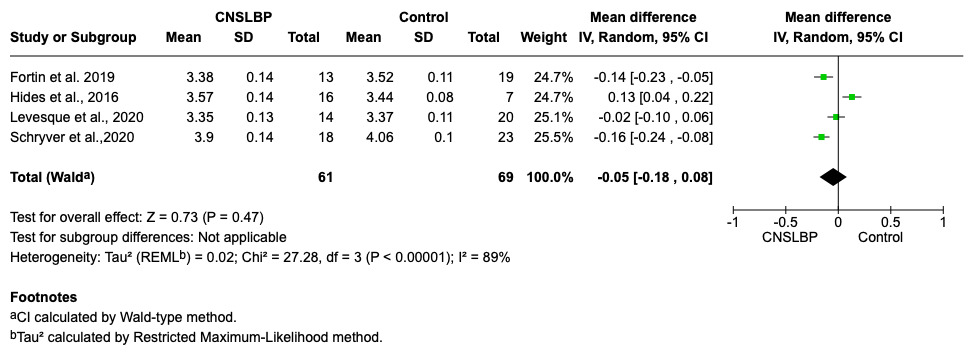
Four moderate-quality studies11,12,22,40 reported no differences in MT in both resting (MD=-0.05, 95% CI=-0.26 to 0.15, p=0.62) (Figure 4) and contracted status (MD=-0.05, 95% CI=-0.18 to 0.08, p=0.47) (Figure 5) between the CNSLBP group and healthy controls at L5/S1 level.
_of_the_lumbar_multifidus_at_l5_s1.png)
Figure 4. Summary of the between-group differences in MT (at rest) of the lumbar multifidus at L5/S1 level in athletes with and without chronic non-specific low back pain.
_of_the_lumbar_multifid.png)
Figure 5. Summary of the between-group differences in MT (during contraction) of the lumbar multifidus at L5/S1 level in athletes with and without chronic non-specific low back pain.
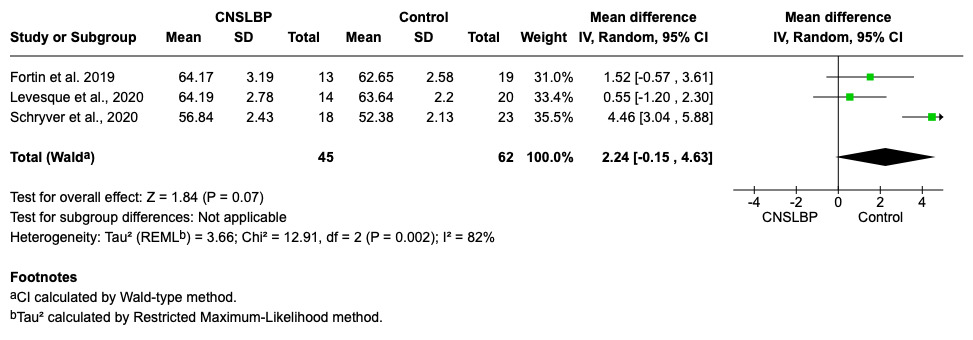
EI of lumbar multifidus and CNSLBP
Three high-quality studies4,11,12 reported no significant difference between CNSLBP group and healthy controls at L5/S1 level (MD=2.24, 95% CI=-0.15 to 4.63, p=0.07) (Figure 6).

Figure 6. Summary of the of the between-group differences in EI of the lumbar multifidus at L5/S1 level in athletes with and without chronic non-specific low back pain.
Publication bias
Visual inspection of funnel plots for CSA, MT, and EI (Supplementary Figure 1) revealed no clear asymmetry, indicating that publication bias is unlikely to have influenced the overall meta-analysis findings.
DISCUSSION
This is the first systematic review investigating the differences and correlations of the morphological and compositional features of lumbar multifidus in the athletic population with CNSLBP. The primary findings of this review revealed that athletes with CNSLBP did not exhibit statistically significant differences in CSA, MT and EI when comparing to the healthy controls. However, emerging evidence reveals significant associations between composition and morphology of lumbar multifidus and athletic outcomes, particularly associating with a smaller CSA to a higher risk of lower limb injuries and greater fatty infiltration to a lower likelihood of RTS. The findings may be attributed to a range of contributing factors, each exerting confounding influences on the outcomes. The following factors serve to illustrate this point.
Imprecise training methodology reporting
The detailed documentation of training regimens, including training load, volume, intensity and frequency, is a fundamental methodological requirement to establish the causal relationship between the exercise stimulus and the observed physiological muscle adaptation.52 The inconclusive findings regarding the composition and morphology of lumbar multifidus in this study may be due to insufficient documentation of training loads and regimen specifics between the included athletes of various sports. This hinders fair comparisons across studies. Arthrogenic muscle inhibition caused by CNSLBP may impair motor control of the muscles (e.g., leading to delayed responses and attenuated muscle activation).53 Ultimately, this can result in muscle atrophy.53 However, high-training loads can lead to compensatory hypertrophy of the muscle, particularly in the athletic population.54 This is supported by evidence that resistance training with moderate-to-high intensity increases general skeletal muscle strength and mass with time55 and a recent study by Dubois et al., reporting an acute increase in training load was directly linked to muscle hypertrophy in rugby athletes with evidence by an increase of CSA and improvement of performance in strength test, including bench press or pull test using 1-repetition maximal (1-RM) estimation.56 However, for the lumbar multifidus specifically, functional endurance or CSA measures are more commonly used than direct strength assessment and findings of Wan et al.57 indicates that training load which contributes to morphological features of the muscle should be considered to better understand the actual impacts of chronic pain on muscular adaptations in athletic populations.56 Therefore, training-induced muscle adaptation in physically active populations with CNSLBP could mask underlying pathology-related atrophy.58 Notably, only 28% of the included studies5,20,37,38,41 documented the specific training variables, such as training repetition, duration and volume. The lack of training details prevents a conclusive interpretation of several of the insignificant findings reported in this review.
Unadjusted anthropometric measures
Anthropometric measures are critical confounders required to be controlled when analyzing the results between athletes with CNSLBP and healthy controls.59 Consistent with previous literature, height, weight and BMI were found to be positively associated with the morphology (CSA and MT) of lumbar multifidus,12 while composition (EI) was highly significantly and highly positively associated with body fat percentage in athletes11 (Table 3). Therefore, it seems that BMI should be used to normalize the morphological and compositional variables of lumbar multifidus to enable accurate comparisons across different populations with different body sizes.60 Nevertheless, none of the included studies used the normalization approach for analysis, and it likely obscures the true between-group differences. For instance, one study outside the included 18 studies investigating core muscles in athletes found that the statistically significant differences in muscle size became non-significant after applying a body mass normalization method and it influenced the statistical results.61 Thus, the between-group differences in CSA, MT, and EI reported in the included studies should be interpreted cautiously, as none of the studies normalized the outcome measures for anthropometric variables (e.g., body mass, height, BMI). Future research should incorporate these anthropometric variables as confounding factors to address this methodological gap in comparing lumbar multifidus morphology and composition between athlete groups.
Diverse sports background
The diversity of sports of the included studies contributed to the population heterogenicity and likely serves as confounding variable. Five hundred eighty-seven out of 1056 athletes (55.6%) of the athletic population in this review participated in contact sports (e.g., rugby, ice hockey, soccer, wrestling, judo and basketball),4,5,11,36–38,40,42,44,45 while the remaining 469 out of 1056 (44.4 %) engaged in non-contact sports.20,35,37,41,43,48,49,62 While this diversity may introduce confounding due to differing biomechanical demands and neuromuscular activation patterns, it can also be considered as a strength, as the findings are broadly generalizable across a wide range of athletic populations. For instance, the activation of core muscles, such as transversus abdominus and lumbar multifidi, may need to activate rapidly in contact athletes to provide neuromuscular bracing of the lumbar spine to work against unpredictable opponent perturbations, while non-contact athletes require sustained activation of the core muscles predominantly for predictable movements.63 An EMG study corroborates this and demonstrated that core stability training increases the firing speed of the transversus abdominis compared to a control group, thereby enhancing dynamic spinal stabilization.64 On the contrary, non-contact athletes (e.g., runners, dancers or weightlifters listed the included studies) train for predictable and sports-specific movements.65 The pooling data from such disparate groups without performing subgroup analysis based on sport types might confuse the actual differences in the morphological and compositional adaptations of lumbar multifidi in athletes of various sports.
Inconsistent definition of CNSLBP
The definition of chronicity in CNSLBP of the 18 included studies ranged from three to 36 months. While all studies employed definitions that technically align with the International Association for the Study of Pain’s recommendation of “pain lasting more than 3 months”, this broad range represents significant heterogeneity in the study populations. Variability in pain duration (e.g., 3 months vs. >1 year) likely captures different stages of neuromuscular adaptation and structural changes, making direct comparisons between studies challenging. Evidence indicates that there is a progressive relationship between pain duration and the structural changes of lumbar multifidi.62 From the physiological perspective, fatty filtration and fibrosis may emerge after six months and followed by muscle atrophy beyond nine months,66 with progression continuing beyond one year.67 This echoes the results by 16.7% of the included studies which used a ≥ 1-year threshold38,43,49 and they consistently demonstrated smaller CSA of lumbar multifidus in athletes with CNSLBP compared to healthy controls. It may suggest that a potential trend that longer pain duration may be associated with greater morphological change within the lumbar multifidi. Hence, the high variability in defining CNSLBP chronicity may possibly contribute to the pooling data of heterogenous population at different stages of structural adaptations of lumbar multifidi, making comparisons of the results challenging.
Suboptimal methodological quality of the studies
Although most included studies score “high” or “moderate” quality on the NOS, indicating acceptable individual study quality in terms of selection, comparability and outcome assessment, the overall quality of evidence from the included studies using GRADE assessment was low. This discrepancy arises because NOS evaluates methodologic rigor of single studies, whereas GRADE assesses the certainty of the body of evidence across studies, considering domains such as inconsistency, imprecision, indirectness and publication bias. The GRADE evidence was low may be due to two major factors, including 1) the inherent risk of bias in observational designs (e.g., selection bias, confounding variables from varying US imaging protocols) and 2) specific methodological limitations, such as a failure to blind therapists during US scanning across three studies.11,35,48 Therefore, the low GRADE rating reflects that, despite acceptable individual study quality, the collective evidence is insufficient to draw definitive conclusions. Accordingly, the results of this review should be interpreted with caution, as they may reflect the weakness of the study methodology instead of the true absence of effect. More RCTs is needed to characterize lumbar multifidus adaptations and distinguish the pathological atrophy from training-induced adaptations, like muscle hypertrophy.62
Should US continue to be employed in the assessment of lumbar multifidus muscle?
The utilization of US imaging as a portable and practical solution for assessing morphology and composition of lumbar multifidus is well-established when MRI is inaccessible.62 The value of using US imaging has been demonstrated by the reliability of the use of CSA and MT for tracking muscle hypertrophy and disease progression, complemented by EI serving as a biomarker for muscle quality and fatty infiltration development.68
However, the current application of US imaging is hampered by lack of standardization of imaging parameters or protocols. Inconsistent acquisition parameters across studies, including frequency, gain and depth11,24,68–73 directly impair the comparability of results. For instance, Almazan-polo et al.37 used setting of 10-MHz frequency, 60-point gains and 4-cm depth for scanning the muscle while other studies only employing lower frequencies and different depth (5-MHz frequency & 8-cm depth).4,18,22,37,40,43,50,74 The fundamental trade-off between resolution and penetration depth gives rise to variable imaging quality as lower frequency allows deeper tissue penetration but reduced resolution, while higher frequency improves resolution but limited penetration depth.75 This inconsistency is a main obstacle to synthesizing the evidence and drawing a decisive conclusion that should be considered in future research.
To fully leverage the advantages of the use of US imaging, methodological enhancements are essential and required. The implementation of standardized protocols based on key anatomical landmarks can improve the scanning reliability and diagnostic accuracy.76 Moderate reliability was reported when scanning the supraspinatus using US imaging while employing anatomical landmarks, like scapular notch, scapular spine and supraspinatus fossa when compared with MRI imaging,77 and the model of establishing anatomical landmarks can be implemented in the imaging of the lumbar multifidi for improving the diagnostic accuracy. Additionally, the adoption of advanced quantitative techniques like backscatter coefficient (BSC) analysis can move beyond EI by quantifying the intrinsic acoustic properties of tissues, providing a more objective and reliable measure of muscle composition.78 Therefore, the path forward of the use of US requires a dual focus. The development and adoption of standardized acquisition protocols should be utilized to ensure consistency and reliability, while the validation of the advanced quantitative technique, like BSC, and landmark-guided imaging are necessary to enhance the functions and usage of US imaging beyond current limitations and elevate the potential of US imaging.
Limitations
Although the results of this systematic review and meta-analysis are comprehensive, there are certain limitations that need to be addressed. Firstly, about 27.8% of the included studies (5/18 studies) had a smaller sample size (<30 subjects), which could contribute to reduced statistical power in their outcomes. Secondly, the existing literature predominantly focused on morphological and compositional features of lumbar multifidus only at L4/5 and L5/S1 levels, lacking outcomes or data spanning the entire lumbar spine. This specificity limits the description of changes in the multifidi that may occur across the lumbar spine in those with CNSLBP.
Future studies
Future research should categorize the sport types with clear definition of CNSLBP and documented training regimens for comparisons. Also, measuring the training intensity and duration would allow for further exploration of the correlation between workload changes within a training program and muscle architecture. Higher quality studies which consider other confounding variables, including anthropometric variables, standardized US imaging protocols using anatomical landmarks should be incorporated to ensure reliable findings.
CONCLUSION
The morphological and compositional features of lumbar multifidus were comparable in athletes with and without CNSLBP. The findings of this review were constrained by imprecise reporting of training methodologies, unadjusted anthropometric variables, diverse sporting backgrounds, inconsistent definitions of chronic CNSLBP, and suboptimal methodological quality. Further RCTs underlining confounding factors related to type of sports and their specific training, individuals’ anthropometrics, standardized US imaging protocols using anatomical landmarks, and the use of BSC are recommended to optimally investigate the changes of lumbar multifidus in athletes.
CONFLICT OF INTEREST
The authors, Wai Keung Wong, Allan C.L. Fu, and Sharon MH Tsang, declare no conflict of interest. No external funding was received for this study.
ACKNOWLEDGEMENTS
This research did not receive any specific grant from funding agencies in the public, commercial, or not-for-profit sectors.