INTRODUCTION
Muscle strength is considered an important functional parameter to assess in patients with musculoskeletal injuries and pain, and hip muscle strength is frequently impaired in individuals with hip and groin pain.1,2 Reduced strength has also been associated with greater symptom severity, functional limitations, and poorer quality of life in this population.3–7 Furthermore, less hip muscle strength may alter movement patterns and contribute to suboptimal loading of hip joint tissues, potentially exacerbating joint pathology, such as osteoarthritis, over time.8 For these reasons, accurate and reliable assessment of hip strength is of clinical importance.
According to a recent systematic review with meta-analysis of 107 studies, isometric strength testing using an anchored portable dynamometer is considered a reliable method for assessing hip muscle function.9 This method is also accessible in a clinical setting and more cost-effective compared to strength assessment using an isokinetic dynamometer. However, strength assessments should ideally allow for evaluation of both agonist and antagonist muscles within the same joint position, in order to generate consistent agonist-to-antagonist strength ratios. While this is routinely achieved for isometric strength testing in hip adduction and abduction, where both directions are assessed in a neutral hip position, flexion and extension are often tested in different joint positions.10–14 Hip extension is typically assessed in a neutral position (zero degrees of flexion),10–14 whereas hip flexion is measured at 45°11 or 90°10–14 of hip flexion. The different joint positions hinder the calculation of useful flexion-to-extension strength ratios and, therefore, limits their clinical interpretability. In addition, the positions commonly used for flexion and extension strength testing may not represent the most favorable position for force production, according to principles of muscle length-tension relationships and internal moment arms.15 Also, testing hip flexion strength at 90° flexion may be poorly tolerated by patients with hip pathology, such as femoroacetabular impingement, who often experience pain or restricted motion in flexion end-range.1,2 Thus, there is a need for alternative testing positions that are both reliable and feasible while also enabling comparable measurements across muscle groups.
Assessing both hip extension and flexion at 60° of hip flexion in a semi-standing position may address these limitations. This position provides a more mid-range joint angle, potentially facilitating greater force production while also reducing discomfort associated with end-range positions. Biomechanical studies have demonstrated that the function of the psoas major is angle-dependent, transitioning from a predominantly stabilizing role at lower flexion angles to a more effective hip flexor at approximately 45–60° of hip flexion.16 Furthermore, a recent systematic review reported greater iliopsoas activation during rehabilitation exercises performed within the 30–60° hip flexion range.17 Together, these findings suggest that testing at 60° of hip flexion may provide a more favorable position for assessing hip flexor force-generating capacity compared with more extended or end-range flexed positions. By standardizing the angle for both movements, this approach also enables flexion-to-extension strength ratios to be derived within the same joint position.
Therefore, the objective was to evaluate the test-retest reliability of testing maximal isometric strength in extension and flexion in a semi-standing position with 60° hip flexion. It was hypothesized that the method would demonstrate good reliability.
METHODS
Study Design and Ethics
The reporting of this reliability study corresponds to the Guidelines for reporting reliability and agreement studies (GRAAS).18 The Swedish Ethical Review Authority (Dnr: 2022-05023-01) approved the study and the participants signed an informed consent form prior to data collection.
Participants
By convenience sampling, participants were recruited from students and personnel at the Faculty of Medicine at Lund University, Lund, Sweden. The participants had to be injury- and pain-free at the time of testing. The target in the present study was to recruit 30 participants. The target sample size of 30 participants was based on feasibility and previous reliability studies using similar methodologies.10–14 No formal precision-based sample size calculation was performed, which should be considered when interpreting the width of the confidence intervals.
Tester
The test leader (AP) is a physiotherapist with 5+ years of experience in strength testing in clinical and research settings. Prior to the data collection, pilot testing on three subjects was conducted.
Data Collection
Isometric strength measurement
The participants were asked not to do any high intensity training the day before the tests to avoid fatigue or potential muscle soreness. Isometric hip muscle strength was measured with an anchored dynamometer (Mark-10 Series 3, Mark-10 Corporation, Copiague, New York, USA).
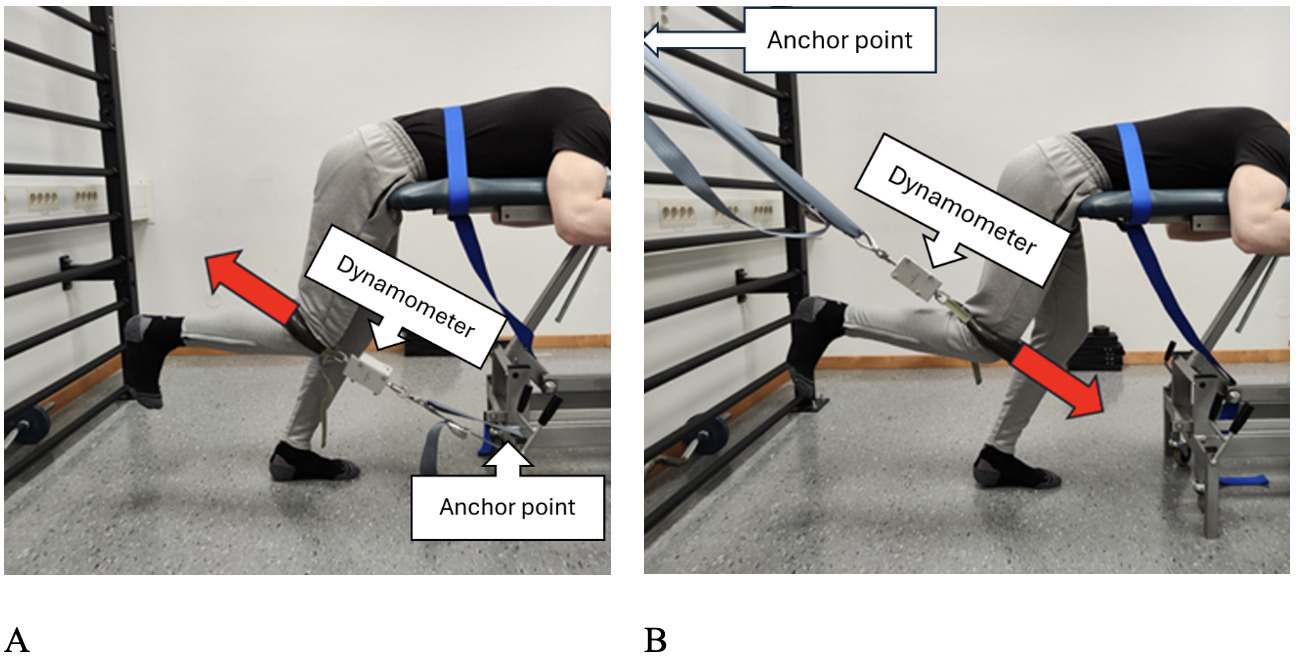
The participants were tested in prone with their upper bodies on a testing table. The height of the table was adjusted to the level of the greater trochanter of the participant. A strap, positioned at the level of the lilac crest, stabilized the trunk and secured them to the table. The tested leg was positioned at a hip angle of 60° (measured with a goniometer), and the knee flexed to 90° (visual estimation). The foot on the non-tested side was in contact with the floor, ensuring stability. This setup was designed to fixate the testing position and, ensure that the force exerted was purely isometric, thus meaning no movement of the limb was possible. All measurements were performed on the right leg to ensure consistency across participants
During isometric extension, the dynamometer was anchored at the base of the table, and the participant applied force against a cushioned strap (width 3 cm) positioned at the popliteal space (Figure 1A).
_and_flexion_(b).png)
During isometric flexion, the dynamometer was anchored at the wall, and the participant applied force against a cushioned strap (width 3 cm) positioned directly proximal to the patella (the edge of the strap in contact with the proximal part of the patella) (Figure 1B). The line of force was perpendicular to the thigh in both extension and flexion.
Prior to data collection, the participants performed one to three submaximal contractions for familiarization. The participants performed a maximal contraction for 5 seconds under standardized strong verbal encouragement, and the peak force was recorded. The maximal peak force from the three attempts was used as the primary outcome, as maximal force output is commonly used in clinical strength assessment and was considered most representative of clinical practice. Three maximal attempts were performed with a 20-second rest period between each attempt and a two-minute rest period between testing directions. The test was repeated with the same tester after 48-72 hours for each participant. The result from the initial test was not available for the tester during the re-test.
Statistics
Strength measurements were expressed in Newtons (N), except in patient characteristics where the strength was normalized by thigh length (m) and bodyweight (kg) (Nm/kg). Strength ratios are presented in percent (%) calculated using the formula: (extension strength (N) / flexion strength (N))*100. For relative reliability, intraclass correlation coefficients (ICC2,1) based on a two-way mixed-effects absolute agreement model were used with corresponding 95% confidence intervals. The same tester performed all measurements and was therefore considered a fixed effect. An absolute agreement model was selected because it accounts for both random measurement error and potential systematic differences between test sessions.19 The ICC values were interpreted as excellent (>0.90), good (0.76–0.90), moderate (0.50–0.75), and poor (lower than 0.50).19 For absolute reliability, standard error of measurement (SEM), SEM%, and minimal detectable change at both group (MDC%group), and individual level (MDC%ind) was used. Homogeneity of variance between test sessions was assessed using Levene’s test, indicating no significant difference in variance (p≥0.412), supporting the assumption of equal variance. Therefore, the SEM and SEM% were determined using the following calculations: SEM = SDpooled * √(1-ICC) and SEM% = (SEM/meanpooled)*100.20,21 MDC%group and MDC%ind were determined using the following calculations: MDC%ind= SEM% * 1.96 * √2, and MDC%group = (SEM% * 1.96 * √2)/ √n.21,22 Systematic bias was analyzed with paired t-test. Bland–Altman plots with 95% limits of agreement are presented with the mean score and the difference between measurements. Proportional bias was assessed by linear regression analysis between the mean and difference scores in the Bland–Altman analysis.
RESULTS
Thirty participants with mean age 27 (SD 7) and 43% women were recruited. Due to technical issues one participant had missing data on isometric extension at test session 2 and one participant had missing data on isometric flexion at test session 1. Participant characteristics and hip muscle strength in flexion and extension for men and women respectively are presented in Table 1.
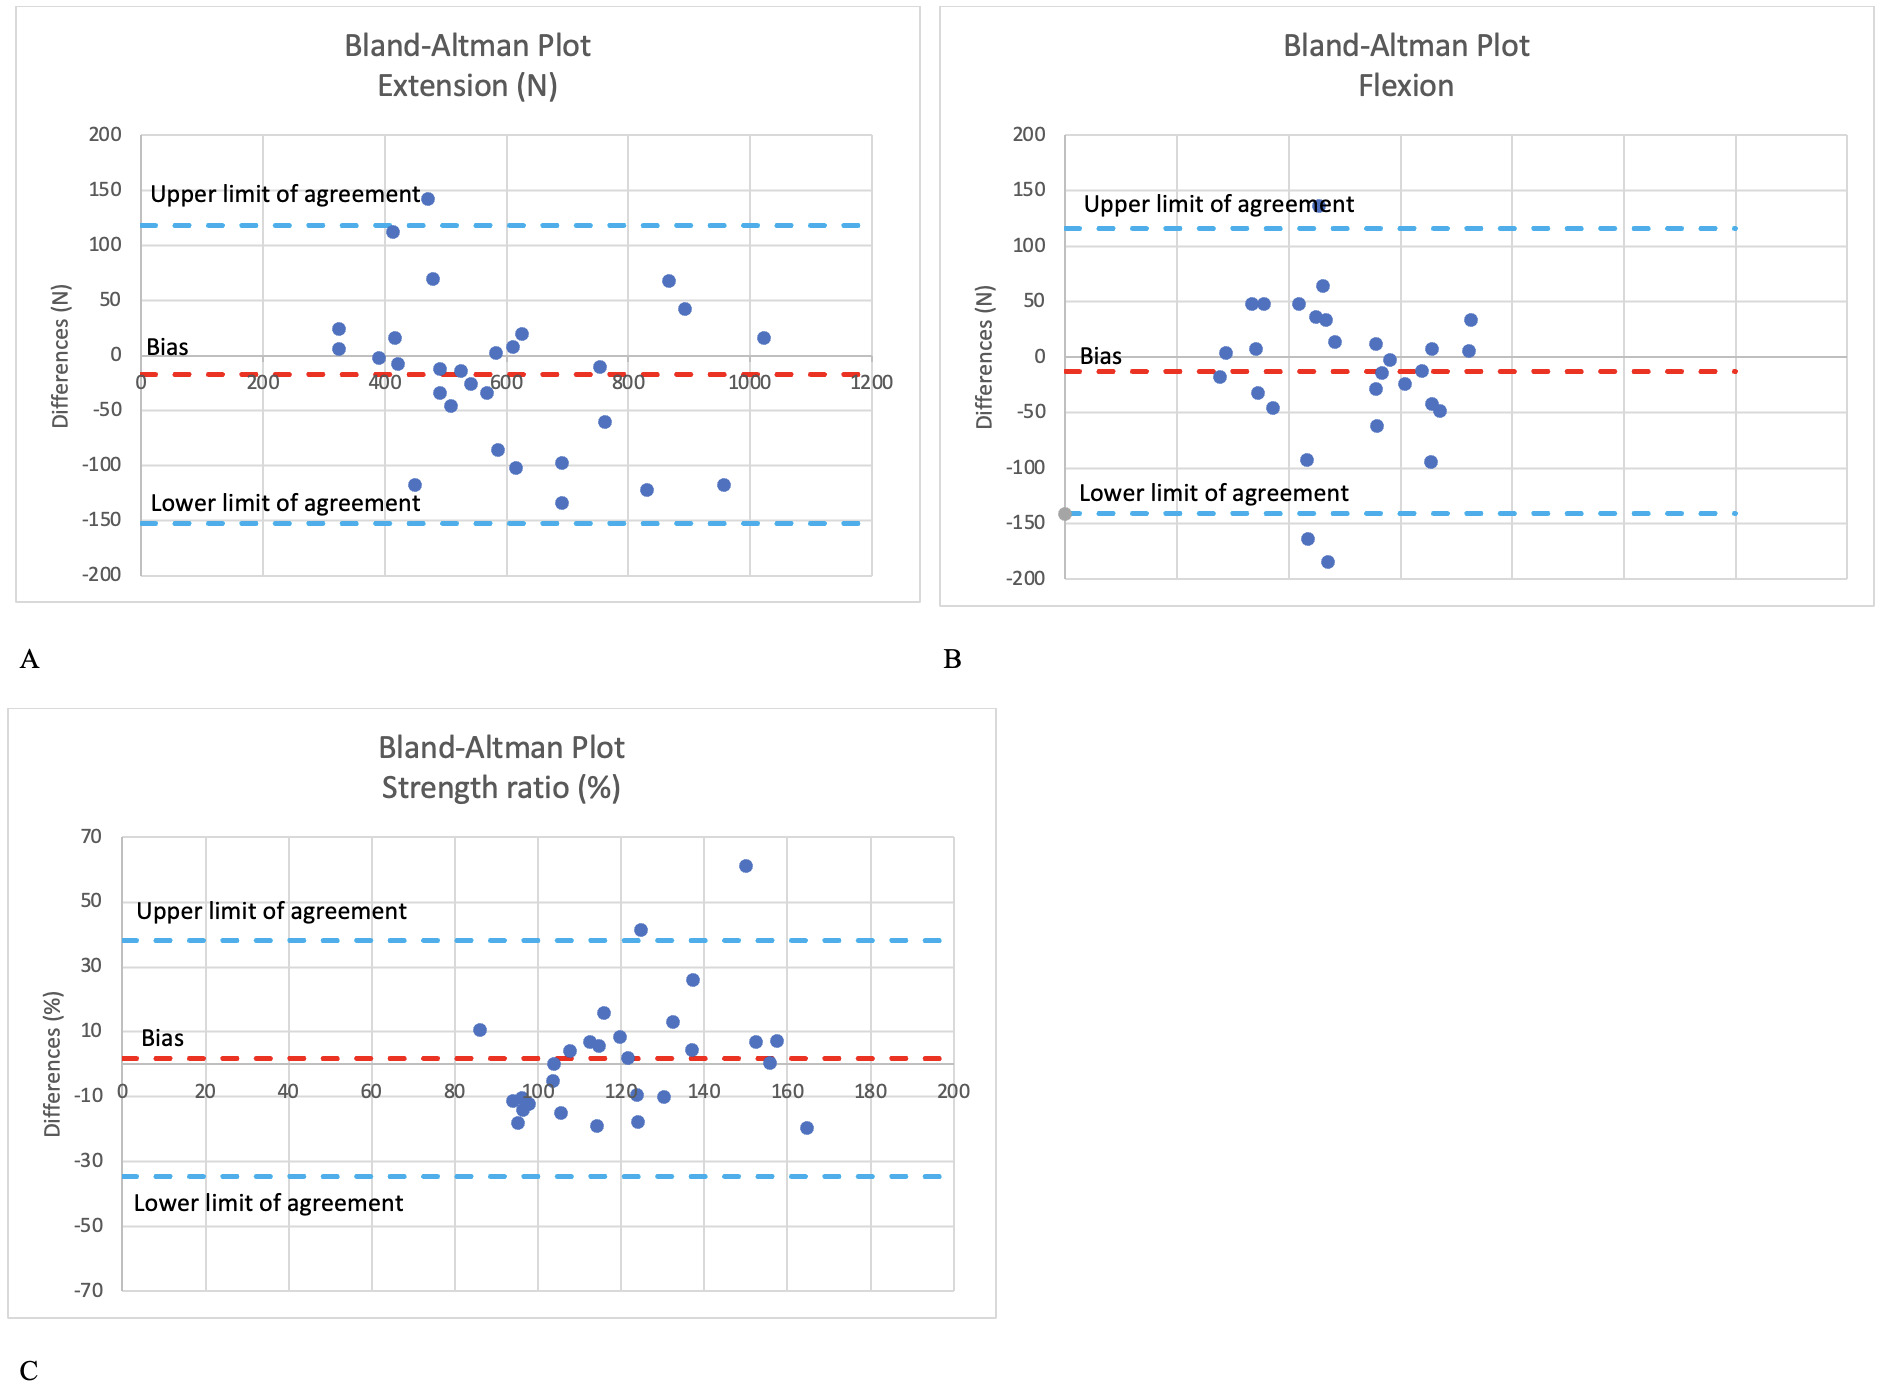
No statistically significant differences between test sessions were observed (p≥0.193). However, mean values were consistently slightly higher during the second test session, which may indicate a small familiarization or learning effect. However, no significant proportional bias was observed for extension or flexion (p=0.177 and p=0.613 respectively). Relative reliability for extension was excellent (ICC 0.932), good for flexion (ICC 0.884) and moderate for strength ratio (ICC 0.694). For absolute reliability, SEM% was 8.2% for extension, 9.1% for flexion, and 10.6% for strength ratio. MDC%group was 4.2% for extension, 4.7% for flexion, and 5.6% for strength ratio. MDC%ind was 22.6% for extension, 25.2% for flexion, and 29.5% for strength ratio (Table 2, Figure 2).
__f.png)
DISCUSSION
The findings of the present study demonstrate that assessing maximal isometric hip strength of both extension and flexion at 60° of hip flexion in a semi-standing position resulted in good to excellent relative test-retest reliability for extension and flexion strength, while the strength ratio demonstrated only moderate reliability. By assessing both movements within the same joint position, the protocol provides a standardized approach for evaluating hip flexion and extension strength under comparable biomechanical conditions.
The relative reliability observed for extension and flexion (ICC 0.88–0.93 and SEM% 8.2–9.1%) is largely in line with previous studies investigating isometric hip strength testing using anchored handheld dynamometry in other testing positions.10–14 However, the strength ratio demonstrated lower reliability (ICC 0.694), and the corresponding confidence interval was relatively wide (95% CI 0.439–0.846), including values consistent with both poor and good reliability. These findings indicate considerable uncertainty in the precision of the estimate and suggest that the strength ratio should be interpreted cautiously, particularly until replicated in larger samples.
Although no statistically significant differences between test sessions were observed, all outcomes demonstrated slightly higher mean values during the second test session. This consistent directional change may indicate a familiarization or learning effect. Given the relatively limited sample size, the study may not have been sufficiently powered to detect small systematic between-session differences, and the absence of statistically significant differences should therefore be interpreted cautiously rather than as definitive evidence of absence of systematic bias.
The Bland–Altman analysis further contributes to the interpretation of the findings by illustrating the variability between sessions at the individual level. Although no significant proportional bias was observed in the regression analysis, the limits of agreement demonstrated relatively large between-session variability, which is consistent with the observed MDC values. This variability was particularly evident for the strength ratio and indicates that substantial changes may be required before a true change can be distinguished from measurement error in individual subjects.
The relatively large MDC values at the individual level (22.6–29.5%) suggest that the protocol is more suitable for detecting changes at the group level than for monitoring smaller longitudinal changes in individual subjects. While similar MDC values have previously been reported for isometric hip strength testing,11,12,14 these findings remain clinically important, as changes below approximately 25% may not confidently represent true change beyond measurement error.
Several factors may have contributed to the between-session variability observed in the present study. In addition to normal day-to-day variation in maximal force production, small differences in positioning and standardization of the 60° hip flexion angle between sessions may have influenced the results. Furthermore, although familiarization trials were performed, the relatively short 20-second rest interval between maximal contractions and the 48–72-hour interval between sessions may potentially have contributed to fatigue or learning effects. However, only five-second maximal contractions were performed, and no clear evidence of proportional bias was observed.
From a biomechanical perspective, testing hip extension and flexion at 60° of hip flexion may represent a favorable mid-range testing position. Previous biomechanical studies have demonstrated angle-dependent function of the psoas major and increased iliopsoas activation within the 30–60° range of hip flexion.16,17 In addition, Bazett-Jones et al. reported greater hip extension force production in flexed hip positions compared with neutral position.23 Nevertheless, the present study did not directly compare force production between different hip positions, and conclusions regarding superiority of this position should therefore be interpreted cautiously.
The present study introduces a standardized protocol for assessing hip flexion and extension strength within the same joint position, which may help overcome some limitations associated with traditional testing protocols where flexion and extension are assessed at different joint angles. However, further studies are needed to evaluate responsiveness, inter-tester reliability, validity against reference methods, and applicability in clinical populations with hip-related pain.
Limitations
Several limitations should be considered when interpreting these findings. First, the study included a relatively small and homogenous sample of healthy young adults, which limits the generalizability of the results to clinical populations such as patients with hip pathology or older adults. Second, only one tester conducted all measurements, preventing conclusions about inter-tester reliability. This may restrict the applicability of the findings in settings where multiple clinicians are involved in testing. Third, the study did not assess the responsiveness of the method to changes over time, for instance following rehabilitation or training interventions, which is a key property for outcome measures in clinical practice. Finally, as with all isometric testing protocols, the external validity in relation to dynamic functional activities remains uncertain.
CONCLUSION
The results of this study demonstrate that assessing isometric hip extension and flexion strength with the hip at 60° flexion in a semi-standing position has good test-retest reliability in healthy young adults. In addition, the protocol enables assessment of extension-to-flexion strength ratio within the same joint position, although the reliability of the strength ratio should be interpreted cautiously due to wider confidence intervals and greater individual-level variability. The method appears suitable for detecting changes at the group level, while variability at the individual level should be considered when interpreting longitudinal changes over time.
Declaration of Competing Interest
The authors declare that they have no competing interests.