INTRODUCTION
Non-contact lower-quarter injuries remain a substantial burden in football, contributing to time loss, decreased performance, and long-term health consequences. Systematic video analyses in professional soccer indicate that anterior cruciate ligament (ACL) injury frequently occurs during defensive pressing actions requiring rapid deceleration rather than during direct contact, accounting for approximately one-third to two-thirds of cases in male players1,2 and more than half of cases in female players,3 with similar deceleration-related mechanisms reported in Australian football.4 Biomechanical analyses have further implicated abnormal hip and ankle kinematics5 and gender-specific defensive movement patterns6 in the ACL injury mechanism, reinforcing deceleration and cutting as high-risk scenarios. These decelerations and cutting actions impose high eccentric and multiplanar loading demands as athletes attempt to attenuate momentum and stabilize the lower extremity. When braking capacity is insufficient relative to the momentum generated during acceleration, excessive mechanical stress may be transferred to musculoskeletal tissues, potentially exceeding tissue tolerance and contributing to injury through an accumulating mechanical fatigue-failure process.7,8
From a mechanical perspective, successful deceleration requires the coordinated absorption of momentum through eccentric muscle actions, appropriate joint positioning, and neuromuscular control across the trunk, hip, knee, and ankle, with high joint angular velocities and impact forces concentrated within the first 50 milliseconds of ground contact.8,9 Despite this, performance testing and injury screening protocols commonly emphasize acceleration, maximal speed, strength, or time-based change-of-direction outcomes, with deceleration capacity comparatively under-assessed in applied practice.9,10 While informative, time based metrics provide limited insight into an athlete’s ability to control momentum during high-risk movements requiring deceleration; athletes may therefore demonstrate excellent speed or acceleration while possessing inadequate braking capacity.
Ratio- or difference-based metrics that isolate braking ability from raw change-of-direction time have been proposed to address this gap. The change of direction deficit is the difference between change-of-direction test time and linear sprint time over the same distance. This metric was developed to distinguish an athlete’s true change-of-direction ability from performance confounded by linear speed.11 Similarly, field-derived deceleration-speed profiling has recently been proposed to characterize an individual’s maximal braking capacity relative to running speed rather than relying on traditional cumulative time-based thresholds.10 Change of direction deficit and linear momentum have also been linked to change-of-direction ability in academy soccer players, with faster, higher-momentum athletes demonstrating disproportionately impaired braking relative to their propulsive capability.12 Building on this rationale, the Deceleration Index (DI) (the ratio of peak deceleration to peak acceleration) was recently introduced as a comparable ratio-based metric and proposed as a potential adjunct to rehabilitation and performance screening, although evidence for its clinical and prognostic utility has, to date, been largely conceptual.13 The present study extends this concept to the 5-10-5 test (see figure 2) by expressing peak deceleration relative to peak acceleration within the same trial, providing an integrated, field-based measure of momentum control specific to change-of-direction performance. Although horizontal deceleration is increasingly recognized as a key injury-risk factor in team sports,8 prospective evidence directly linking preseason deceleration metrics to subsequent injury risk in football athletes remains limited.
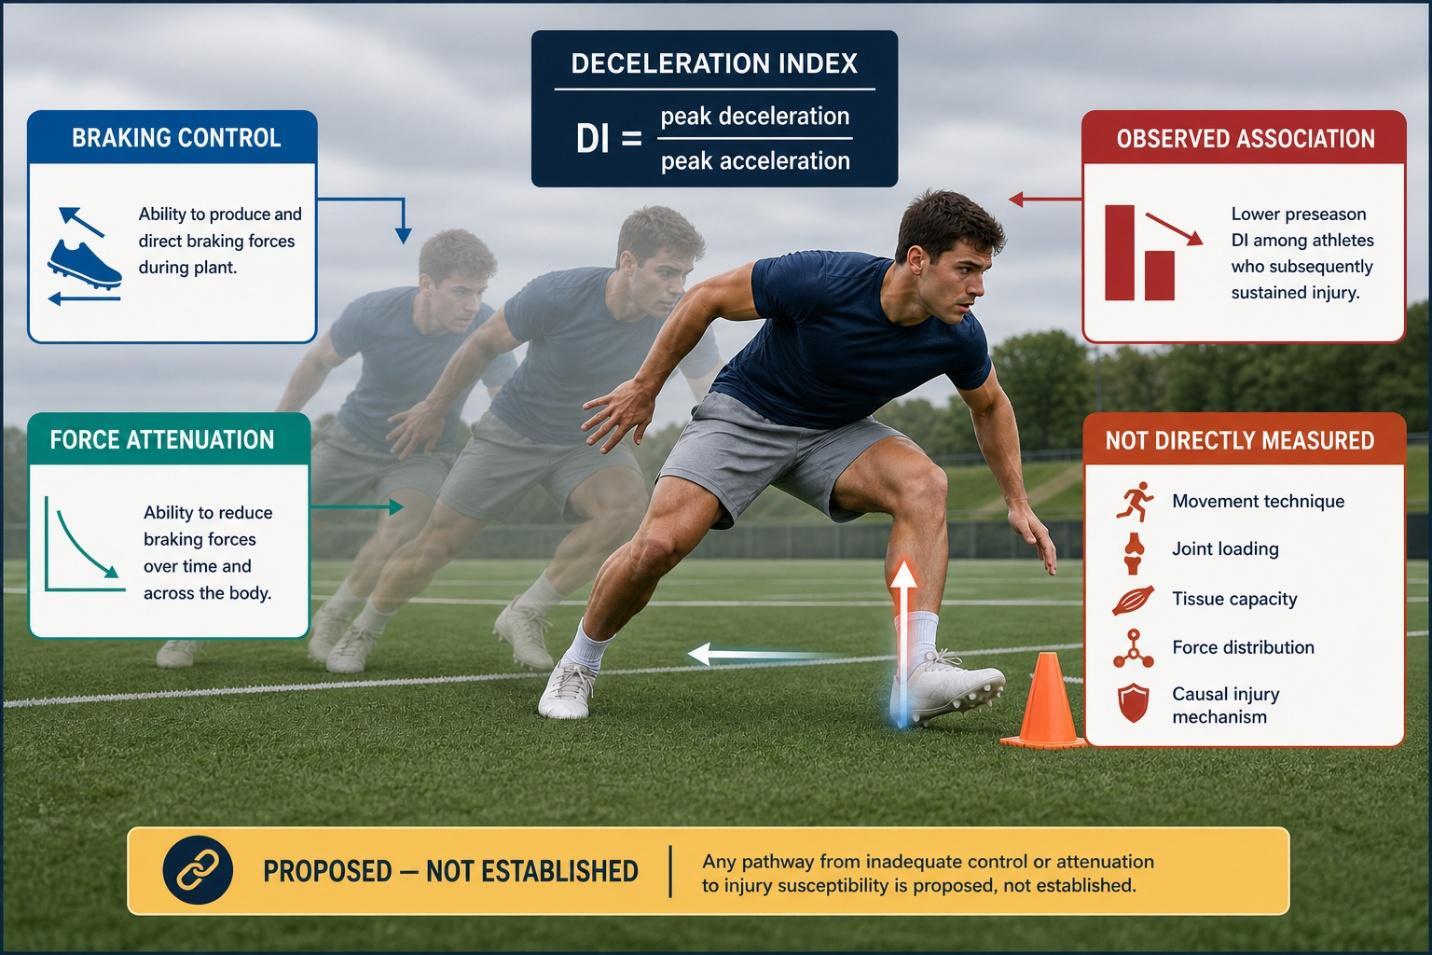
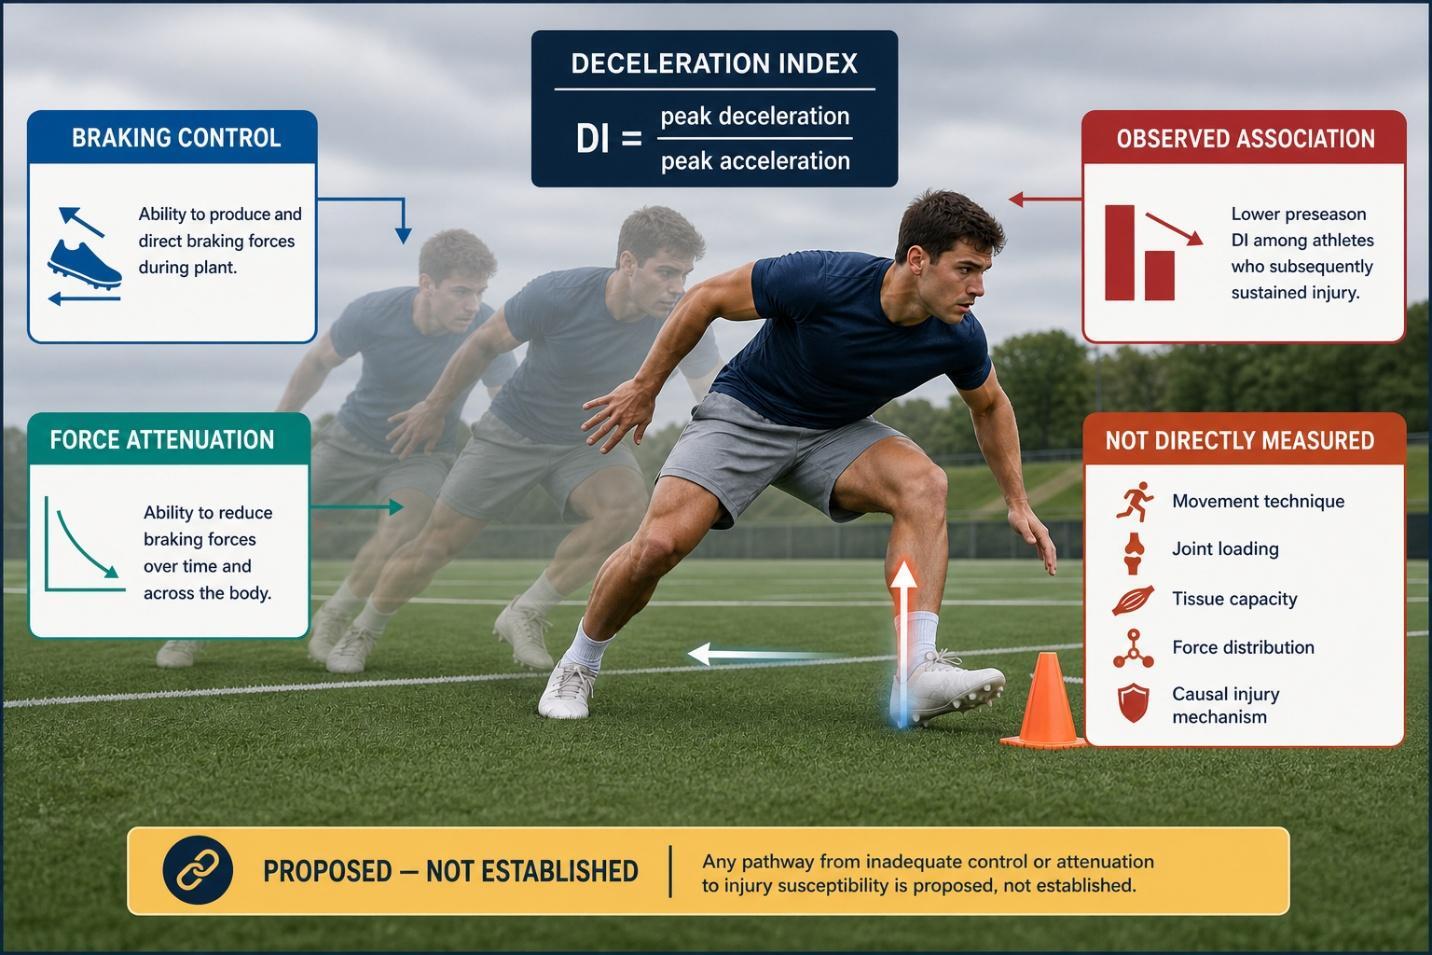
Horizontal deceleration ability has been conceptualized as comprising both braking-force control (reducing whole-body momentum within task constraints) and braking-force attenuation (tolerating and distributing the associated forces).9 This distinction is clinically relevant because DI quantifies a peak braking-to-propulsion relationship but does not directly characterize technique, joint loading, or tissue capacity. Emerging deceleration speed profiling methods extend this individualized perspective by modeling maximal braking across running speeds from routine tracking data; however, their prognostic value and incremental utility beyond the 5-10-5 derived DI remain proposed rather than established.
Therefore, the purpose of this study was to compare preseason Deceleration Index values between collegiate football athletes who sustained a time-loss lower-quarter injury and position-matched uninjured athletes across three competitive seasons. It was hypothesized that football athletes who sustain a non-contact time-loss lower-quarter injury would demonstrate lower preseason DI values than position-matched uninjured athletes.
METHODS
Study Design
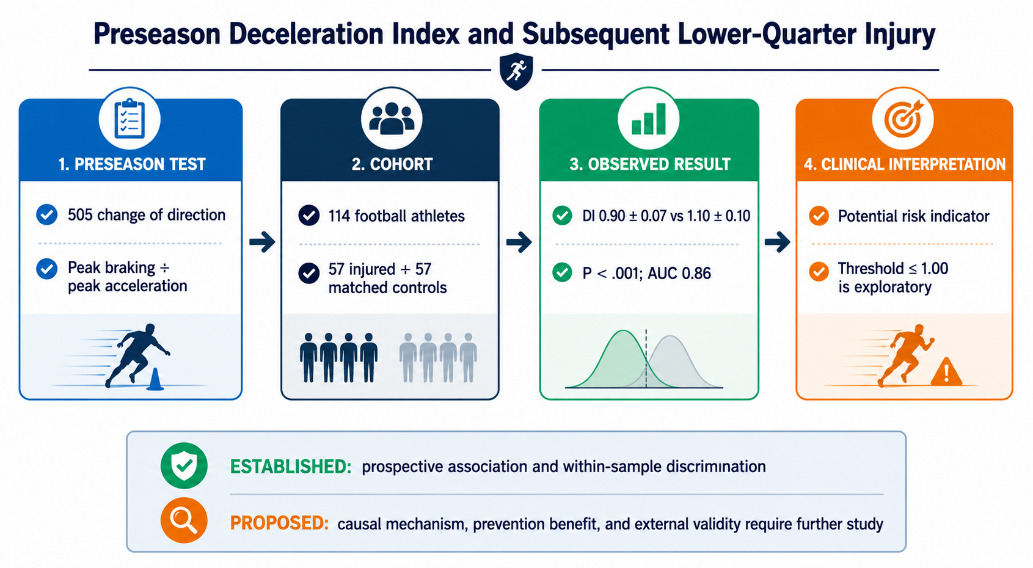
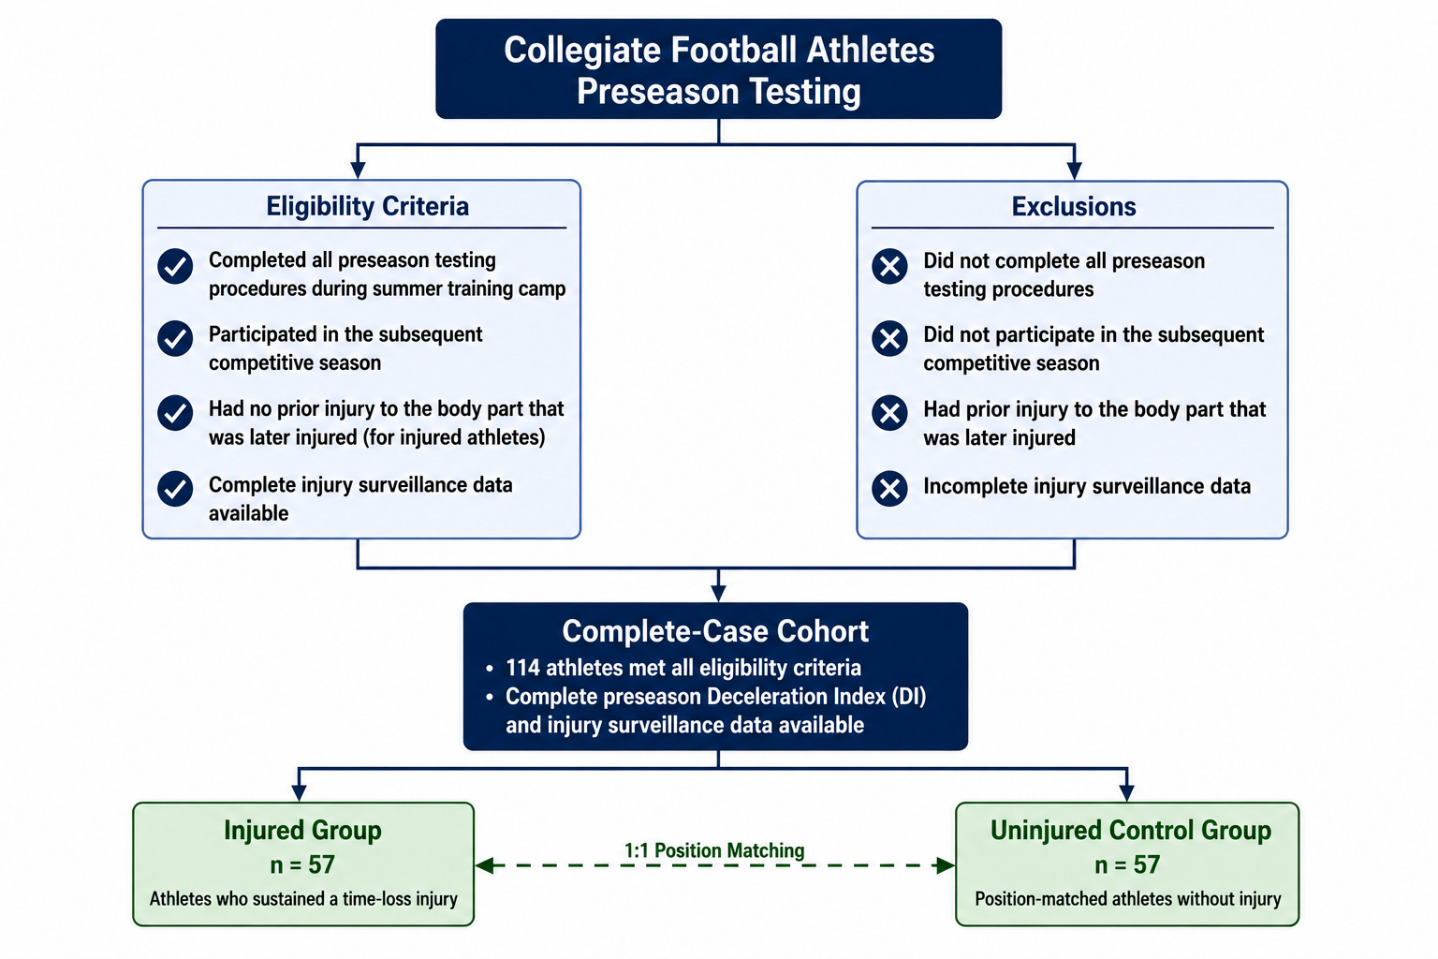
This study employed a prospective cohort design. Before preseason training, performance testing was conducted during summer training camp prior to the competitive season, and injury outcomes were tracked prospectively throughout each season. This was done for three consecutive years. Subjects were excluded from this study if they had a prior injury to the body part that was later injured. (see figure 1)
Participants
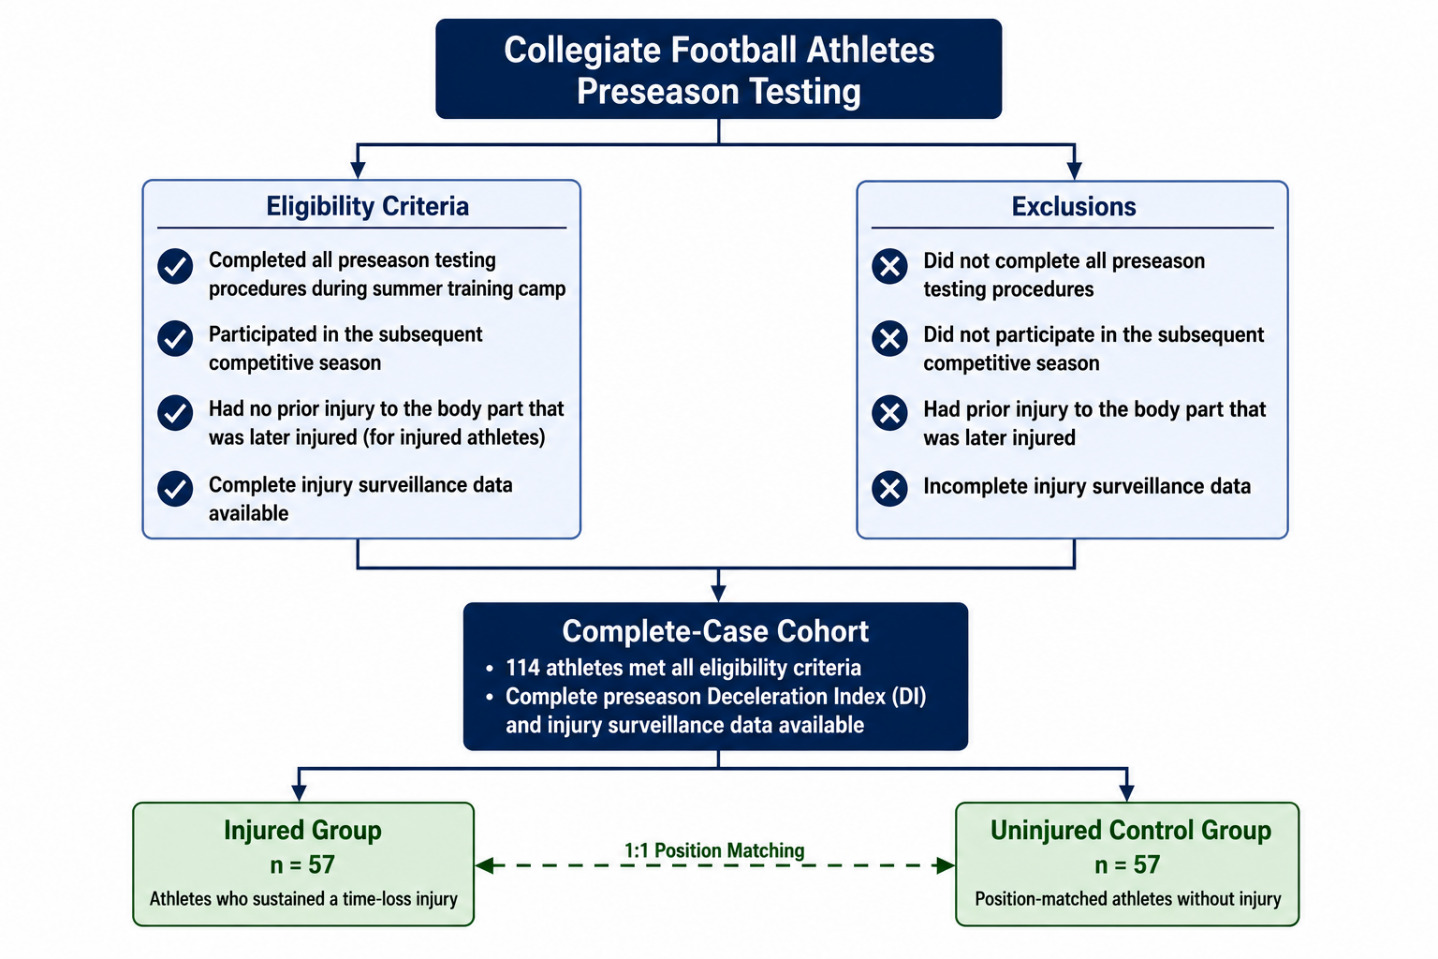
A total of 114 Division I collegiate football athletes from the same Division 1 team completed preseason testing and had complete injury surveillance data. Inclusion criteria required athletes to (1) complete all preseason testing procedures, (2) participate in the subsequent competitive season, and (3) have no prior injury to the body region that was later injured (for injured athletes).
Athletes who sustained a qualifying injury were individually matched one-to-one by playing position to uninjured athletes who completed the same preseason testing and season without injury, resulting in equal group sizes (n = 57 injured; n = 57 uninjured). This matching strategy controlled for position-specific movement demands and exposure. All athletes were medically cleared for full participation at the time of preseason testing (Figure 1).
Testing Procedures
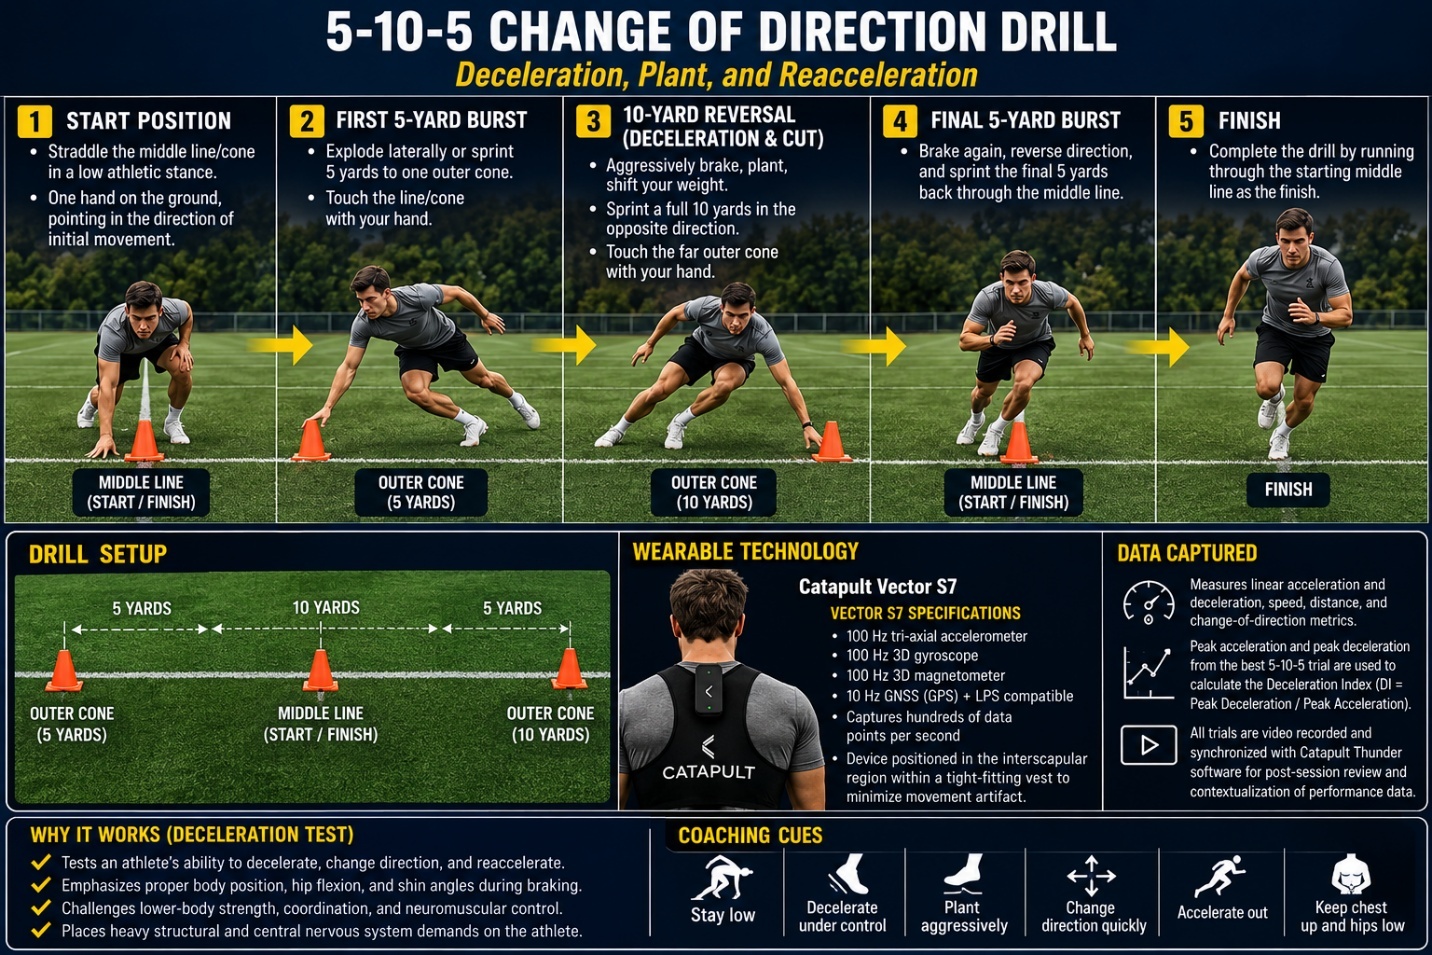
Preseason testing included a standardized change-of-direction assessment using the 5-10-5 test, performed during summer training camp (Figure 2). Athletes completed multiple trials.
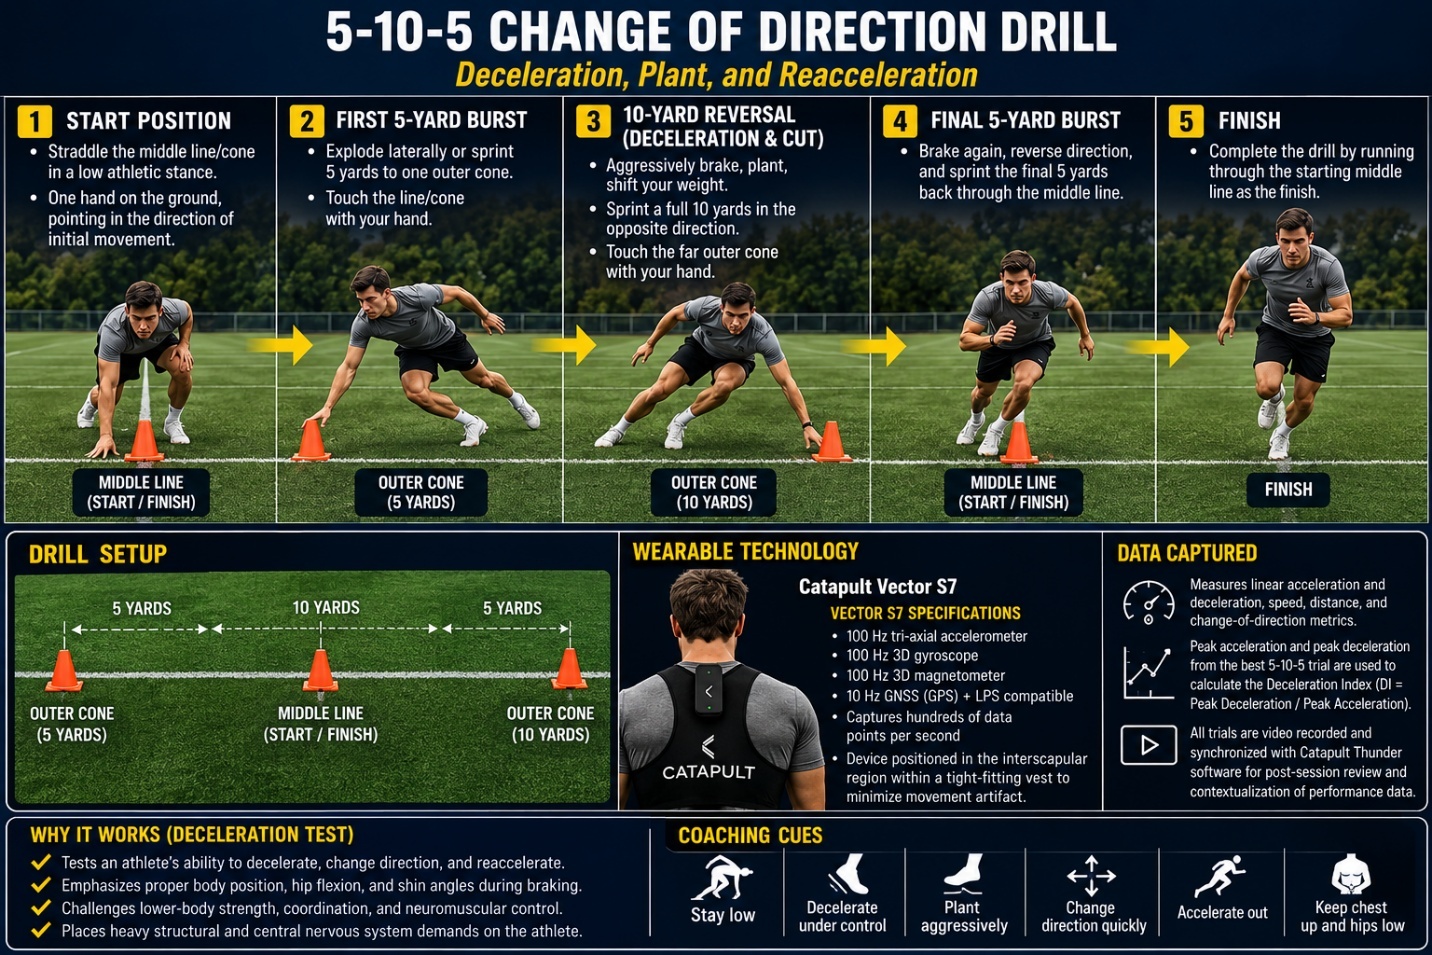
Movement data were collected with the Vector S7 wearable microtechnology system (Catapult Sports, Melbourne, Australia). Before testing, one unit was positioned between the scapulae in the manufacturer-designated pocket of a standardized tight-fitting garment. This location secured the unit close to the upper trunk, limited independent device movement, and provided a consistent anatomical placement across 5-10-5 trials (Figure 2).
Each Vector S7 unit incorporated a tri-axial accelerometer (100 Hz), 3D gyroscope (100 Hz), and 3D magnetometer (100 Hz), together with a 10 Hz global navigation satellite system (GNSS) receiver. The system uses a local positioning system (LPS) infrastructure when satellite-based tracking was limited. The inertial sensors recorded acceleration, angular velocity, and magnetic-field orientation about three orthogonal axes, whereas GNSS provided time-referenced position and velocity information. Thus, these sensor signals represent the directly recorded measurements; summary performance variables were subsequently generated by the Catapult processing environment. (Catapult Sports, Melbourne, Australia)
System-derived outputs available from the integrated platform included total distance (m), peak velocity (mph), and peak acceleration and deceleration (m/s squared) based on configured system thresholds. In the present study, the primary variables used to calculate DI were peak acceleration and peak deceleration; the remaining Catapult outputs were not analyzed as study outcomes unless otherwise specified.
Following each testing session, wearable data were reviewed within the Catapult software ecosystem. Catapult Thunder video analysis was used to synchronize trial execution and associate the wearable record with the corresponding 5-10-5 attempt, including the acceleration, braking/turn, and reacceleration portions of the test. For each athlete, three trials of the 5-10-5 were performed. The best 5-10-5 trial was defined as the trial demonstrating maximal peak performance, was selected for analysis. Within the selected trial window, peak acceleration was the maximum positive value in the Catapult system-derived acceleration time series, and peak deceleration was the absolute magnitude of the most negative value. These paired values from the same trial were used in the DI calculation.
The Deceleration Index (DI) was calculated as
DI = Peak Deceleration ÷ Peak Acceleration
This ratio operationalizes peak braking relative to peak propulsive output within the same trial and quantifies momentum control during change-of-direction performance. It should not be interpreted as a direct measure of tissue load, movement strategy, or braking-force attenuation.
Injury Definition and Surveillance
Injuries were prospectively documented by the sports medicine staff throughout each competitive season. A time-loss lower-quarter injury was operationally defined as a musculoskeletal injury to the hip, thigh, knee, leg, ankle, or foot that (1) resulted in restriction from full participation for at least one subsequent training session or competition, and (2) occurred in the absence of any previous injury to the same body region. Only the first qualifying injury per athlete per season was included in the analysis.
Statistical Analysis
Descriptive statistics (mean ± SD) were calculated for all variables. The primary comparison of preseason DI values between injured and uninjured athletes was conducted using an independent-samples t-test, consistent with the matched-group design and equal group sizes. Effect sizes for between-group differences were calculated as Cohen’s d, using the pooled standard deviation, and interpreted according to conventional thresholds as small (d = 0.20), medium (d = 0.50), or large (d ≥ 0.80).
The independent-samples t-test was selected as the primary analytic approach because the research question focused on comparing mean preseason DI values between two independent, position-matched groups of equal size; DI is a continuous variable with an approximately normal distribution, supporting parametric analysis. Receiver operating characteristic (ROC) analysis was used to evaluate the ability of DI to discriminate between injured and uninjured athletes and to explore clinically meaningful cut-off points. Statistical significance was set a priori at p < 0.05.
RESULTS
Participant Characteristics
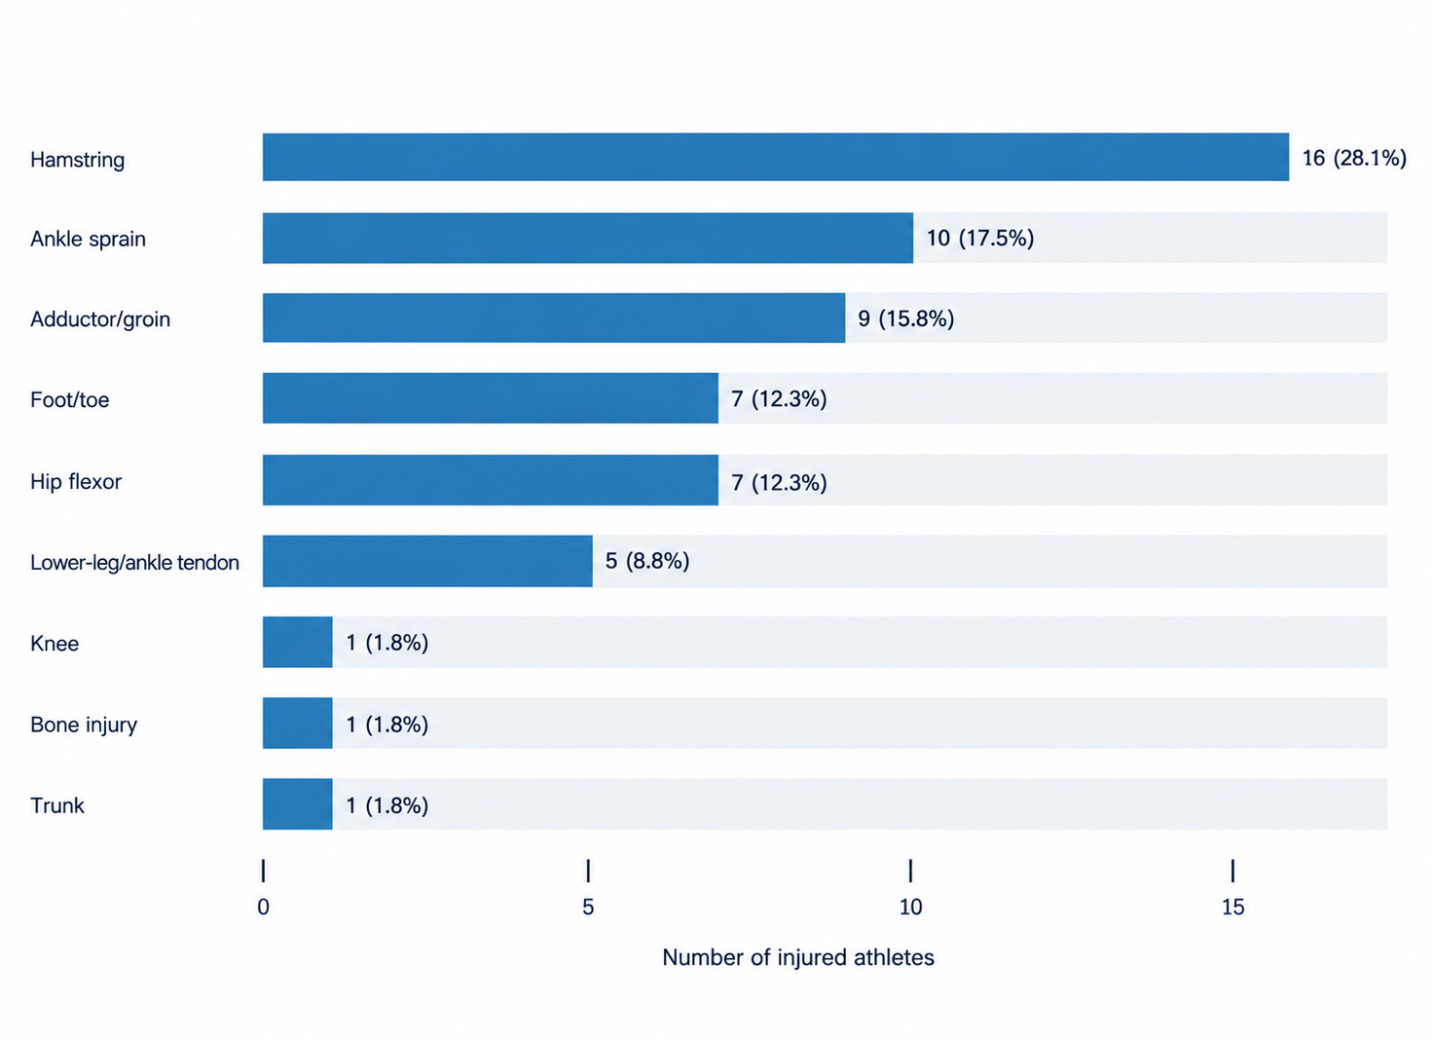
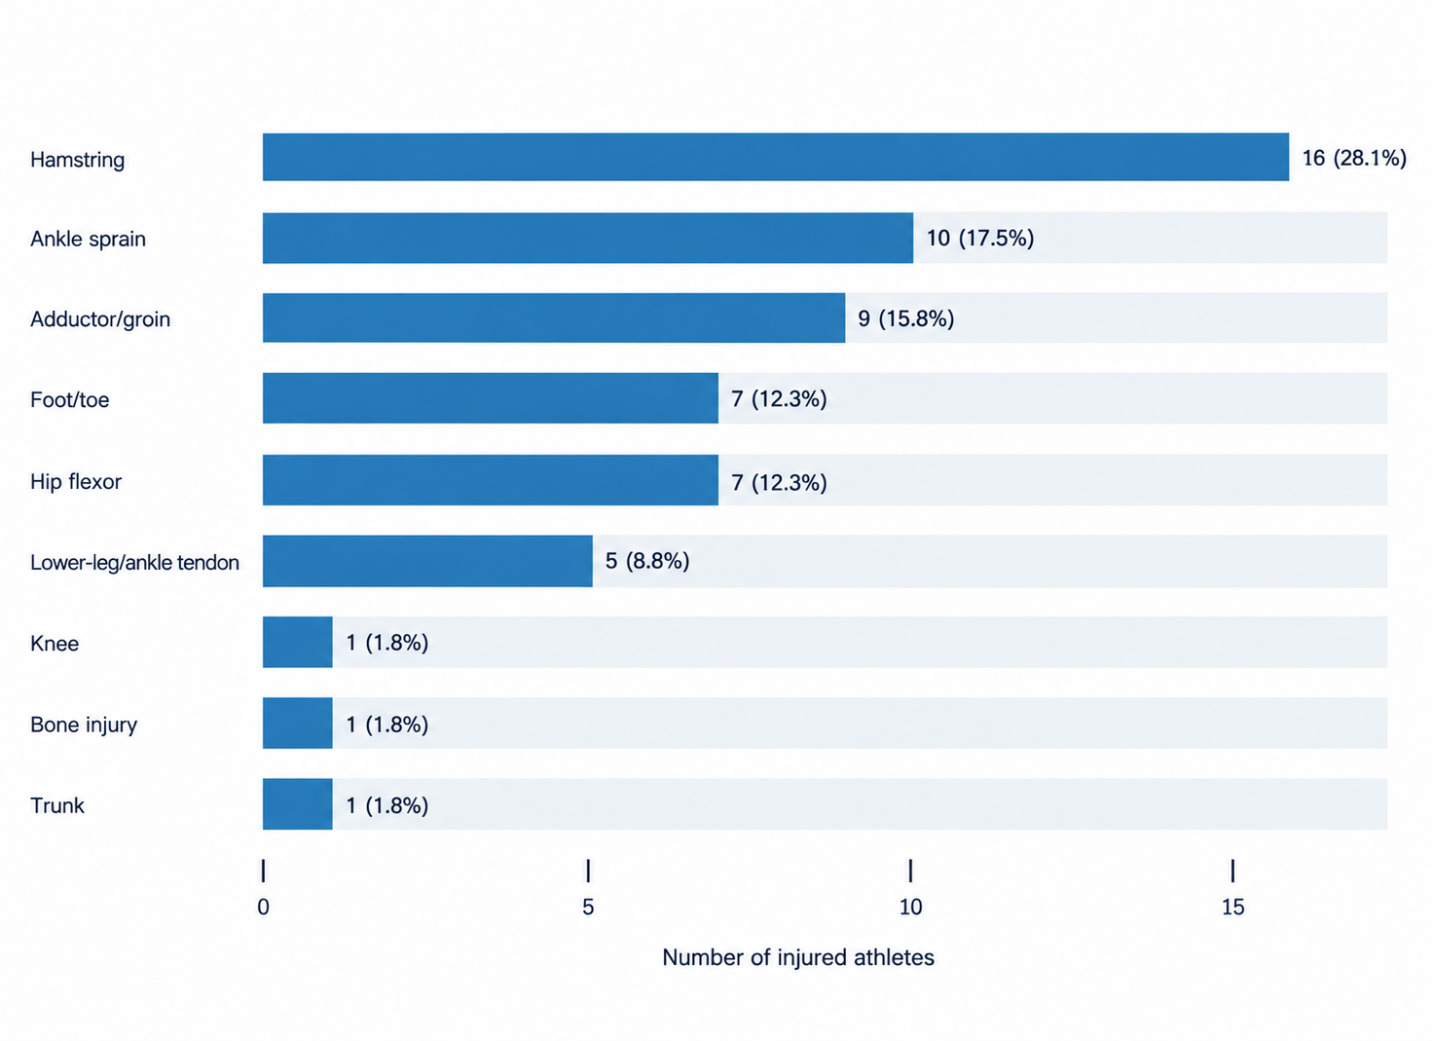
The mean age was 22 years in both the injured and uninjured groups (22.0 ± 0.3 vs 22.0 ± 0.5 years). Anthropometric comparisons showed no statistically significant differences between injured and uninjured groups in height (74.0 ± 1.9 vs 74.6 ± 1.6; p = 0.100), weight (228.0 ± 41.4 vs 229.6 ± 40.7; p = 0.837), or BMI (28.7 ± 4.1 vs 28.8 ± 3.9 kg/m2; p = 0.871). The position-matched groups were therefore comparable in age and body size at preseason testing. Across three seasons, a total of 57 Division I football athletes sustained a non-contact time-loss lower-quarter injury and were position-matched to 57 uninjured controls. Hamstring injuries were most frequent (n = 16), followed by ankle sprains (n = 10) and adductor/groin injuries (n = 9) (Figure 3).
Deceleration Index
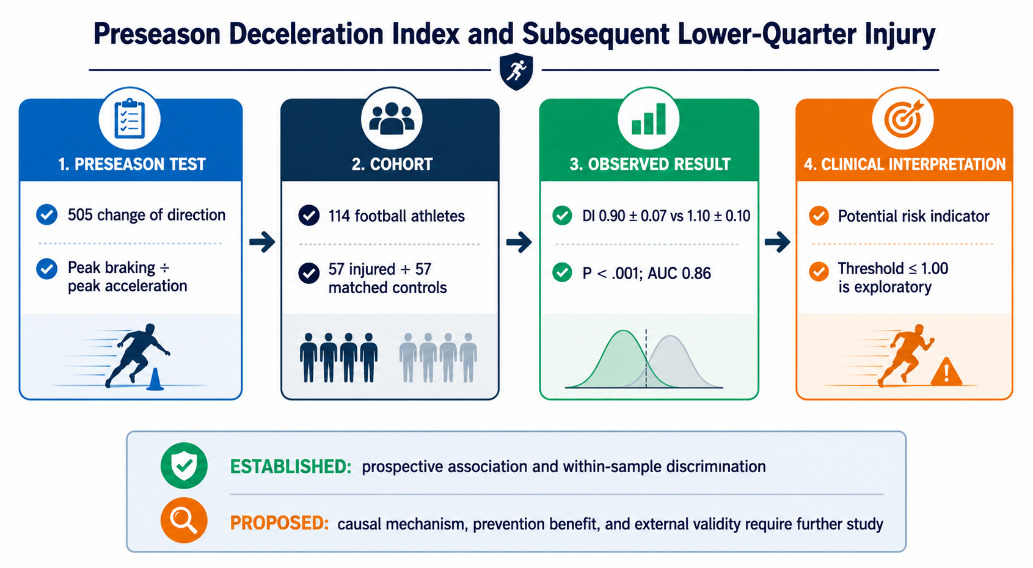
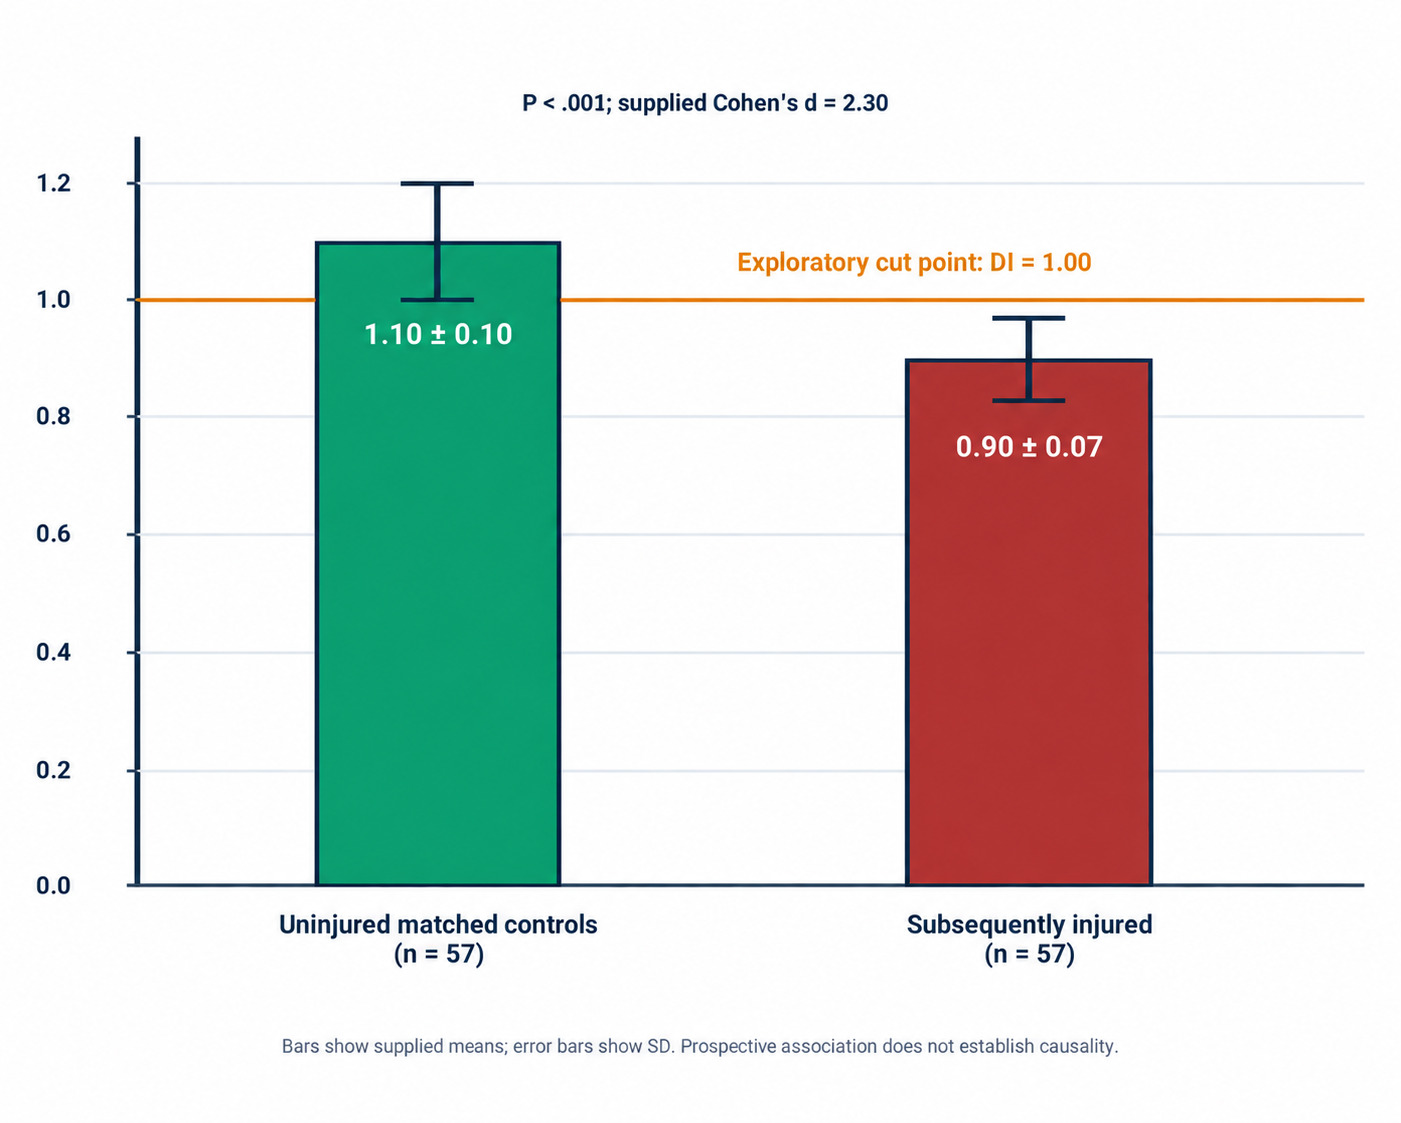
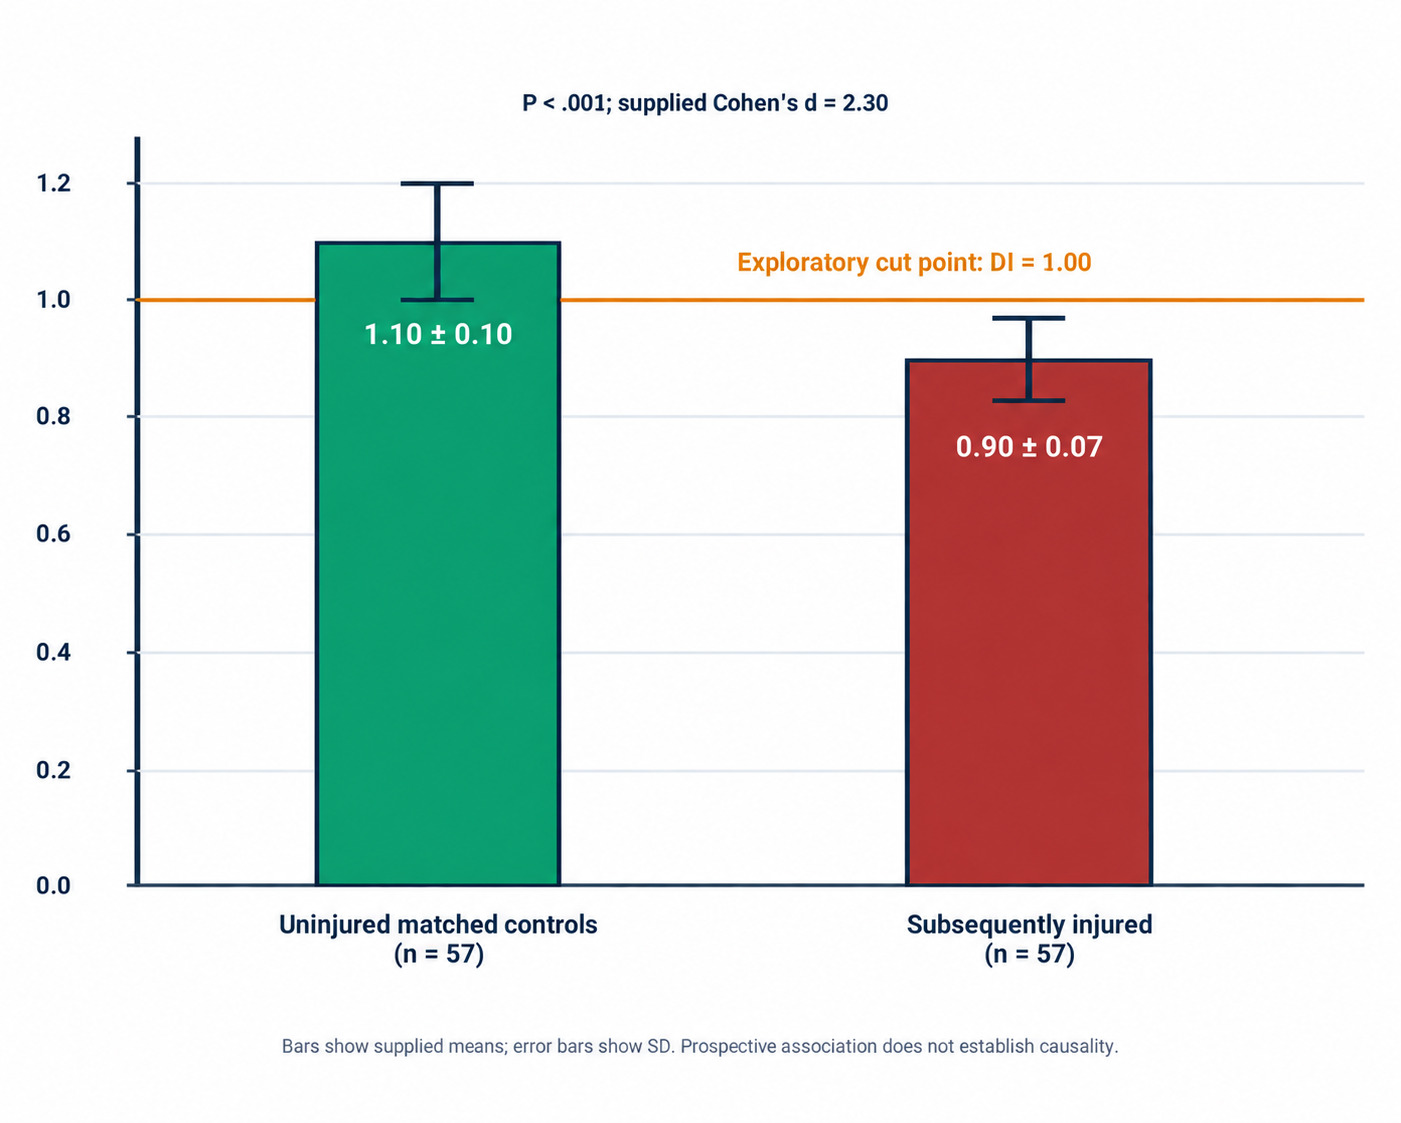
Preseason DI values, derived from the best 5-10-5 test trial obtained during summer training camp, were significantly lower in athletes who later sustained injury than in matched uninjured athletes (0.90 ± 0.07 vs 1.10 ± 0.10; p < 0.001) (Table 1 and Figure 4). The mean between-group difference was 0.20 (95% CI, 0.16–0.23), corresponding to a large effect (Cohen’s d = 2.30; 95% CI, 1.81–2.77), far exceeding the 0.80 threshold for a large effect. An effect of this size indicates limited overlap between the two distributions: the average injured athlete’s DI fell more than two pooled standard deviations below the uninjured group mean.
Receiver Operating Characteristic Analysis
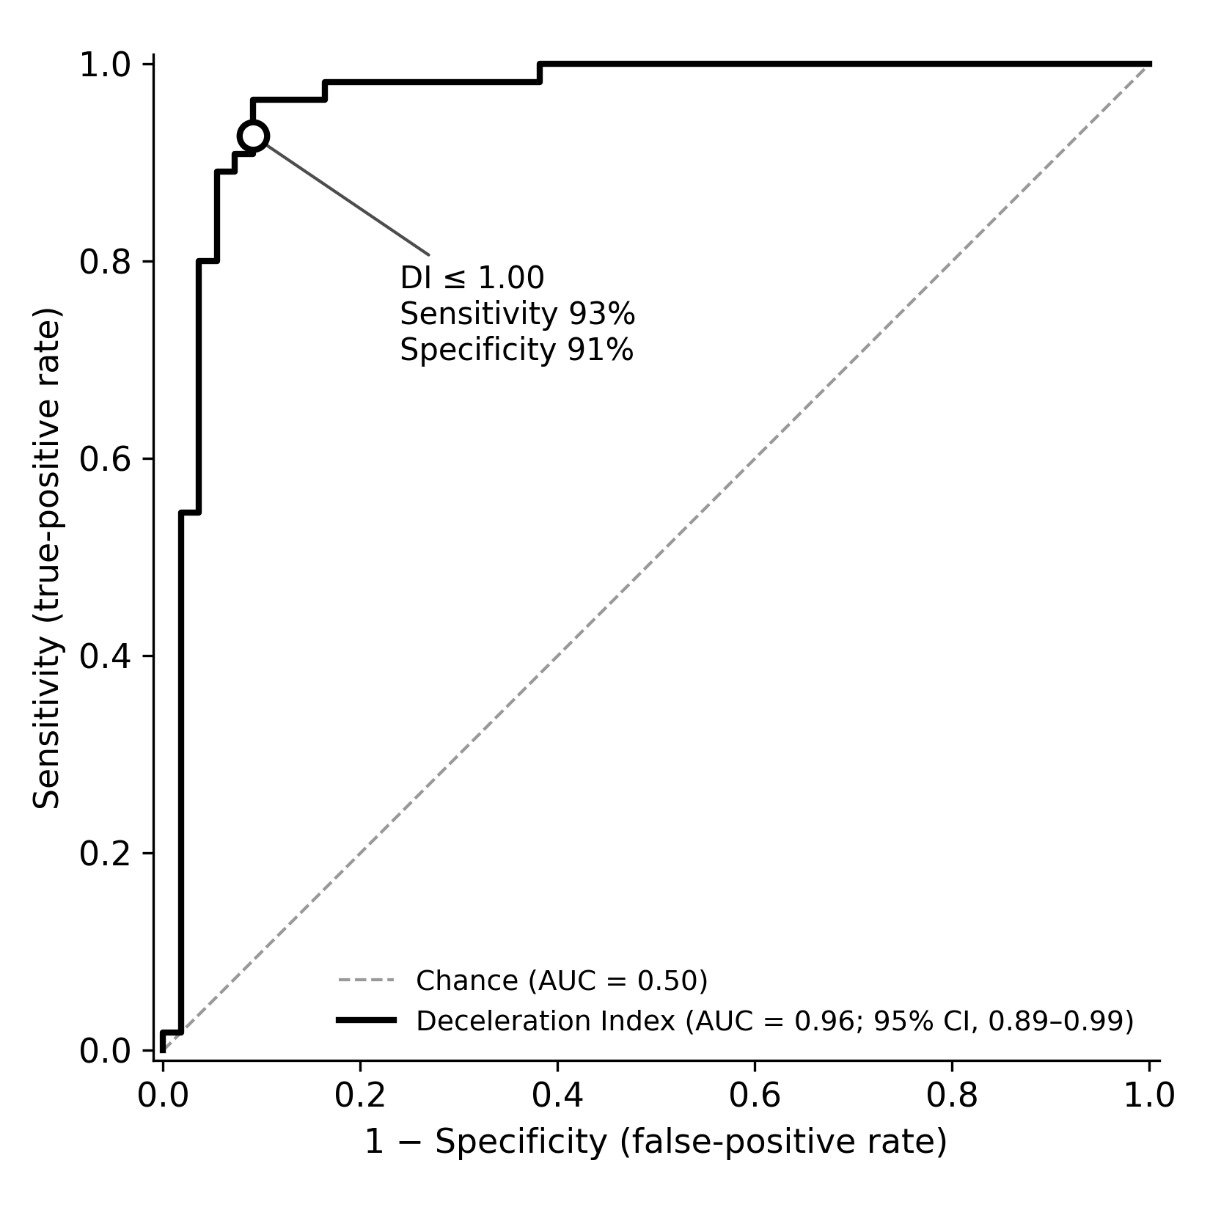
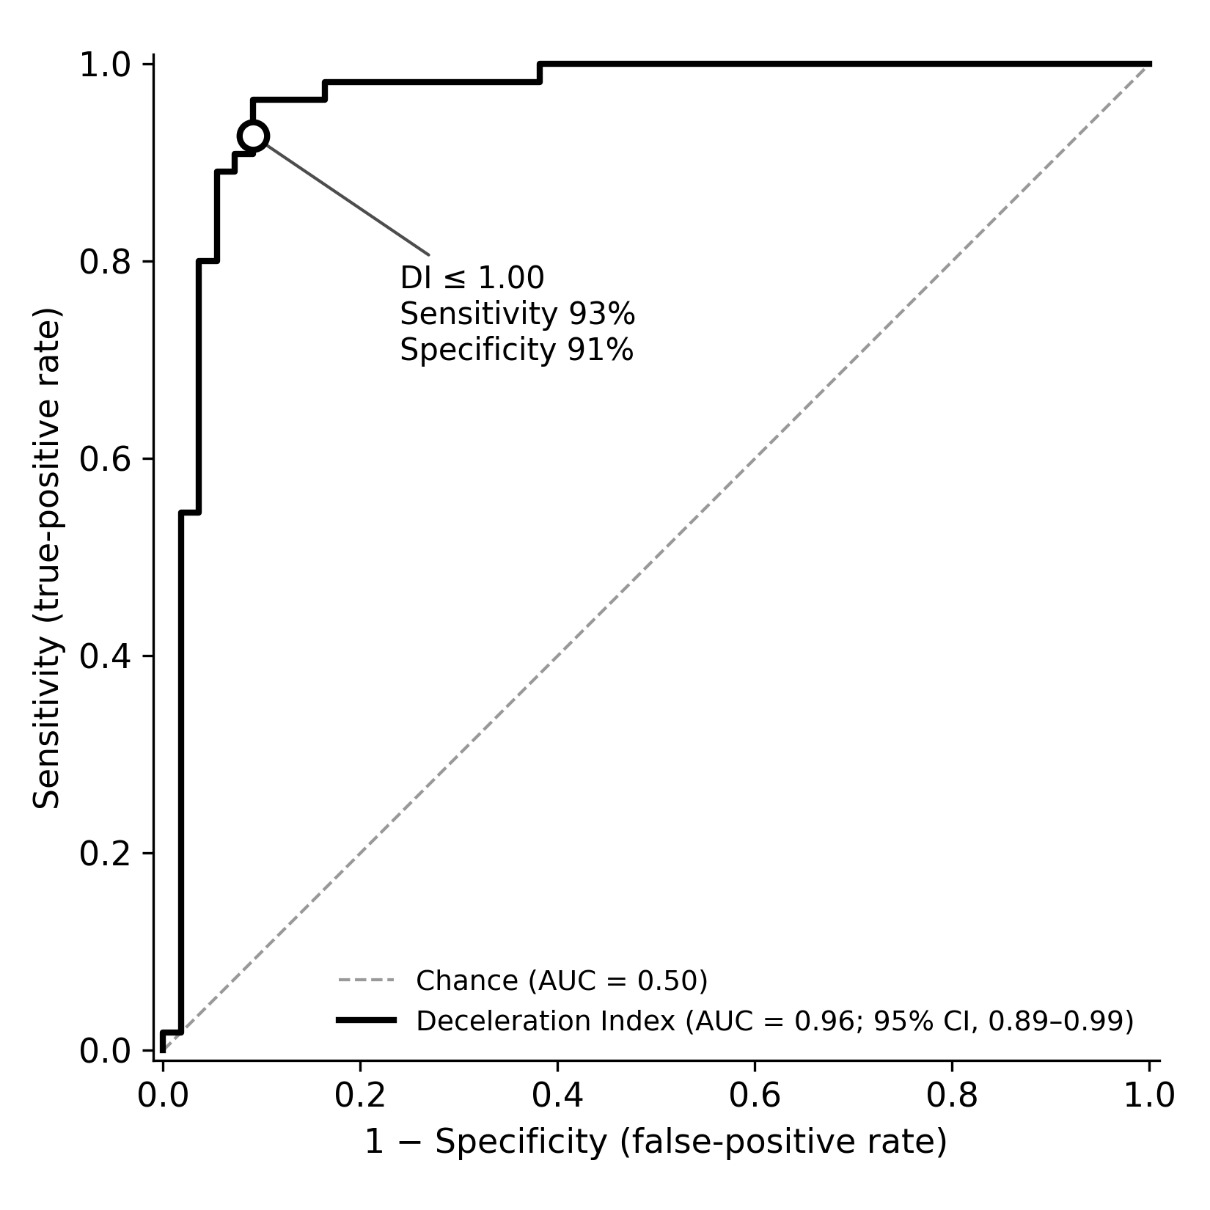
ROC analysis demonstrated good within-sample discrimination of preseason DI for athletes who subsequently sustained a time-loss injury (AUC = 0.96; 95% CI, 0.89–0.99). A cut point of DI ≤ 1.00 optimized sensitivity (93%) and specificity (91%). (Figure 5) These estimates have not been externally validated and should not be interpreted as evidence of a universal diagnostic threshold.
DISCUSSION
The primary finding of this prospective cohort study was that collegiate football athletes who sustained a time-loss lower-quarter injury demonstrated substantially lower preseason DI values than position-matched uninjured athletes. Importantly, DI was measured during summer training camp prior to injury occurrence, supporting its role as a potential risk indicator rather than a consequence of injury.
These findings provide prospective, injury-outcome evidence called for following the initial proposal of the DI as a promising but largely untested screening and rehabilitation metric.13 As characterized with this large effect size, the present study supports the proposed underlying rationale that deceleration forces should approximate or exceed acceleration forces.
These findings also extend prior biomechanical and neuromuscular research by demonstrating that an integrated measure of braking capacity relative to acceleration capacity is strongly associated with injury risk.8,9 While previous studies have identified isolated kinematic or kinetic deficits during deceleration, the DI provides a practical, field-based metric that captures the balance between momentum generation and attenuation (Figure 6).
The results of this study aligns with findings in academy soccer players, where athletes with faster acceleration and greater linear momentum demonstrated a larger change of direction deficit; indicating disproportionately reduced braking capacity relative to their propulsive capability.12 Athletes with high acceleration capacity but limited braking reserve may therefore be particularly vulnerable during high-risk tasks, a phenomenon that may remain undetected using conventional screening approaches that assess speed and change-of-direction time in isolation.
The single-sport, position-matched design reduces confounding by positional demands, although matching by position does not control for individual exposure or all injury determinants. The ROC findings support further study of DI as a risk indicator; and the value DI ≤ 1.00 should remain an exploratory research cut point until independently validated.
The rationale for evaluating deceleration relative to acceleration, rather than in isolation, is further supported by biomechanical evidence that braking ground reaction forces during rapid deceleration can reach up to 2.7 times those generated during acceleration, imposing approximately 41% greater mechanical load per meter than equivalently intense accelerations.8,9,14 High-intensity decelerations also occur up to 2.9 times more frequently than high-intensity accelerations in soccer match play and impose up to 65% greater load per meter than any other match-play activity.7 Field-tracking data similarly show that peak deceleration magnitudes exceed peak acceleration magnitudes across all playing positions in soccer match play.15 Within this context, a DI below 1.0 (indicating that peak deceleration did not exceed peak acceleration) may reflect a meaningful mismatch between propulsive and braking capacity, consistent with the exploratory DI ≤ 1.00 cut point identified in the present study.
Clinical Implications
The present findings suggest that braking capacity should be assessed alongside acceleration and strength in collegiate football athletes. A preseason Deceleration Index ≤ 1.00 may identify athletes who warrant further assessment in settings similar to this cohort; however, this cut point is exploratory and should not be used as a stand-alone clearance or injury-prediction rule. Rehabilitation and performance programs should also emphasize progressive eccentric braking and deceleration control rather than focusing solely on acceleration development, consistent with strength-training approaches that accentuate eccentric muscle actions to improve change-of-direction and braking performance.16
Limitations
This study did not stratify injuries by anatomical location or severity, and findings are specific to male collegiate football athletes; generalizability to athletes from other sports or competitive levels is unknown. Because DI was derived from whole-trial peak acceleration and deceleration values rather than a phase-specific decomposition of the 5-10-5 test, it reflects global momentum control rather than isolating the deceleration phase specifically; the 5-10-5 test is understood to comprise distinct acceleration, deceleration, 180°-turn, and reacceleration phases, each underpinned by different neuromuscular qualities (e.g., concentric strength during acceleration, eccentric strength during deceleration, isometric and reactive strength during the turn).17 External training load and exposure volume were not directly quantified and may have confounded the association between DI and injury. Because DI was derived from a single best trial of a single field test, measurement error and day-to-day variability were not characterized.
Future Research
Future work should first expand the evidence on the measurement properties of the DI, including test-retest and between-day reliability, the standard error of measurement and minimal detectable change, and its validity against criterion measures of braking capacity such as force-plate and eccentric strength assessments. Future work should also establish additional tests with normative and position-specific DI values, validate DI prospectively in independent and multisport cohorts, determine whether targeted eccentric/deceleration training improves DI and reduces injury incidence, examine the role of DI in return-to-sport decision-making, and clarify the biomechanical and neuromuscular correlates that underlie DI. Further studies should examine whether individualized, speed-relative approaches to characterizing braking capacity (recently proposed as alternatives to fixed absolute thresholds) offer additional discriminatory value beyond the ratio-based DI used here,10 and whether phase-specific decomposition of the 5-10-5 test sharpens DI’s diagnostic and prognostic value beyond the whole-trial ratio used in the present study.17 Collectively, these efforts would help inform the use of the DI as a metric to link performance assessment, injury prevention, and rehabilitation progression.
CONCLUSION
Lower preseason DI values were associated with subsequent non-contact time-loss lower-quarter injury in collegiate football athletes across three competitive seasons. Quantifying peak braking relative to acceleration may complement multifactorial risk assessment. Whether modifying DI reduces injury incidence, and whether the proposed threshold generalizes beyond this cohort, remain hypotheses for prospective interventional and external-validation studies.
CONFLICT OF INTEREST
The authors declare no conflict of interest relevant to this commentary.
Declaration of AI Use: AI supported the authors development of preliminary table and figure layouts. The authors reviewed, revised, and verified all tables and figures and take full responsibility for the final manuscript.
ACKNOWLEDGMENTS
The authors gratefully acknowledge the Professional Football Athletic Trainers Society (PFATS) for its financial support of this research and for the thoughtful insight, professional expertise, and clinical perspective provided during the development of the Deceleration Index concept. The authors particularly appreciate PFATS’ commitment to advancing evidence-informed approaches to athlete health, injury risk assessment, and performance within football.
The authors thank Barbara Hoogenboom, PT, EdD, SCS, ATC, for her thoughtful review of this manuscript and her valuable guidance during its revision.