INTRODUCTION
Youth baseball participation and performance initiatives have demonstrated an increased need for injury screening. Previous reports have shown that 16.7 million children between the ages of 6-12 participate in baseball across the United States.1 Competitive participation continues into higher levels of play, with 11.5 million athletes playing in high school or club baseball.2 Unfortunately, due to the repetitive nature and high demands associated with throwing activity, overuse injuries can result from participation.3 In fact, 30-70% of baseball athletes between the ages of 8-18 will report an upper extremity injury throughout their youth baseball career.4,5 Increased pitching volume at a younger age has been associated with overuse injuries.3
Therefore, prior literature has focused on improving modifiable risk factors that can reduce the risk of participation related injury in baseball. A decrease in throwing arm shoulder internal rotation and horizontal adduction range of motion has been associated with increased risk of youth throwing arm injuries.6 Prior research focused on the collegiate and professional baseball athlete has demonstrated that unilateral strength ratios for shoulder external to internal rotators and elbow extensors to flexors can provide insight into reducing risk of injury.7,8 This existing literature for the adult baseball athlete represents the best available evidence that has been suggested for consideration in the youth baseball athlete.9 Additionally, Hurd et al. had found that the high school-aged baseball athlete displays a 9% lower dominant arm external to internal rotator strength percentage ratio versus their non-dominant upper extremity.10 However, strength assessment appears to be underrepresented in the literature concerning injury risk analysis for the high school-aged baseball athlete.
The measurement and utilization of strength as an outcome tool can vary amongst clinicians, which provides differing views regarding clinical outcomes in the rehabilitation setting.11 A common theme amongst older baseball players regarding continuity of rehabilitation is trust in the care team.12 Athlete confidence in the clinician’s ability to set realistic, objective goals can support informed return-to-sport decisions.12 For athletes between the ages of 12-17, a key perspective on injury recovery can be seen in recovery outcomes.13 Therefore, consistency in utilizing appropriate objective measures could enhance clinical decision-making and improve the confidence of baseball athletes in the care they receive.
There are several different ways to measure strength that include manual muscle testing, isokinetic testing, and handheld dynamometry (HHD). Concerning baseball and return to throwing, digital HHD has become a clinical measure utilized by many clinicians to obtain force values that are used to calculate within-limb strength percentage ratios. Previous literature across athletic cohorts, including active adults, adult handball players, youth handball players aged 14-18, and youth baseball players between the ages of 9-12, has confirmed excellent reliability for strength measurements of the shoulder and the elbow.14–18 Although these results are promising, there is still lack of agreement on how to use HHD for testing isometric strength in children and adolescents.19,20 However, research improvements including the utilization of an externally fixated device (EFD), and using the ulnar length of the subject’s throwing arm to normalize data have been implemented.14,15 The purpose of this research was to establish intra-tester reliability of isometric HHD strength testing of shoulder and elbow musculature, describe throwing arm strength trends and strength percentage ratios across chronological ages, and report throwing with pain after seasonal participation for the high school-aged baseball athlete. The authors’ hypotheses were (1) HHD utilizing EFD methods and normalization procedures will demonstrate good to excellent intra-tester reliability for the high school-aged baseball athlete, (2) high school-aged baseball athletes will display lower strength percentage ratios based on prior available evidence used for the adult baseball athlete, and (3) athletes that report pain with throwing during the baseball season will display trends toward lower strength percentage ratios.
MATERIALS AND METHODS
This was a quasi-experimental study of male high school-aged baseball athletes through a single season of participation. Participants were recruited using Institutional Review Board (IRB)-approved flyers and by contacting baseball coaches, managers, and athletic directors of local high school and summer leagues via phone and email. Inclusion criteria were: English speaking, male athletes between the ages of 14-18 years of age who were actively participating in competitive baseball and not currently experiencing pain with throwing which entailed scoring above 68.6/100 on the Kerlan-Jobe Orthopaedic Clinic Shoulder and Elbow (KJOC) score.21 Due to differences in maturation, growth patterns, and participation in the sport of baseball between sexes, only male participants were included in this research. Participants were excluded if they had a prior throwing arm elbow or shoulder surgery, were currently enrolled in physical therapy or diagnosed with a throwing-related injury, and if they participated in other overhead athletic activity such as tennis and racquet sports, swimming, volleyball, gymnastics, tumbling for cheerleading, javelin throwing, shotput, discus, or as the quarterback for football. IRB approval was obtained through Nova Southeastern University prior to study initiation. IRB approved parental informed consent and child assent forms were signed accordingly prior to participation in this research.
Each athlete was screened by the principal investigator by phone prior to entrance into the study, which included age and general participation in competitive play. After initial screening, in-person demographic information was collected including the participants’ date of birth, throwing arm dominance, and presence of other comorbidities. Other clinical sport-related data were documented including baseball positions currently played, KJOC scores, and a visual analog scale (VAS) describing pain with throwing. The ulnar length of each athlete’s throwing arm was measured with the athlete’s arm resting on the table from the ulnar styloid process to the tip of the olecranon process using a tape measure. All testing was administered by a single licensed physical therapist including strength testing procedures, written KJOC and VAS scoring, and ulnar length measurements. The licensed physical therapist had 12 years of clinical experience, was board certified as a clinical specialist in sports physical therapy, and fellowship trained in the upper extremity athlete.
All subjects went through the same structured 5-10 minute standing dynamic warm-up including active range of motion exercises for shoulder flexion, shoulder horizontal adduction, and elbow and wrist extension (one set of 10 repetitions for each exercise) and standing dynamic resistive exercises using medium elastic resistance performing shoulder external rotation, shoulder horizontal abduction, overhead scaption (e.g., reverse throwing motion), and overhead wrist and forearm ulnar deviation and pronation (one set of 10 repetitions for each exercise).
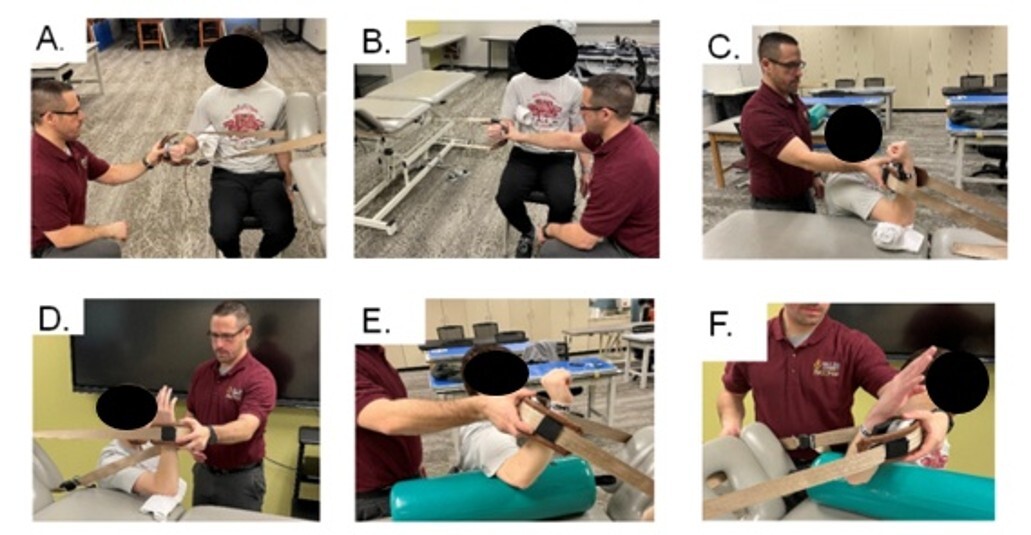
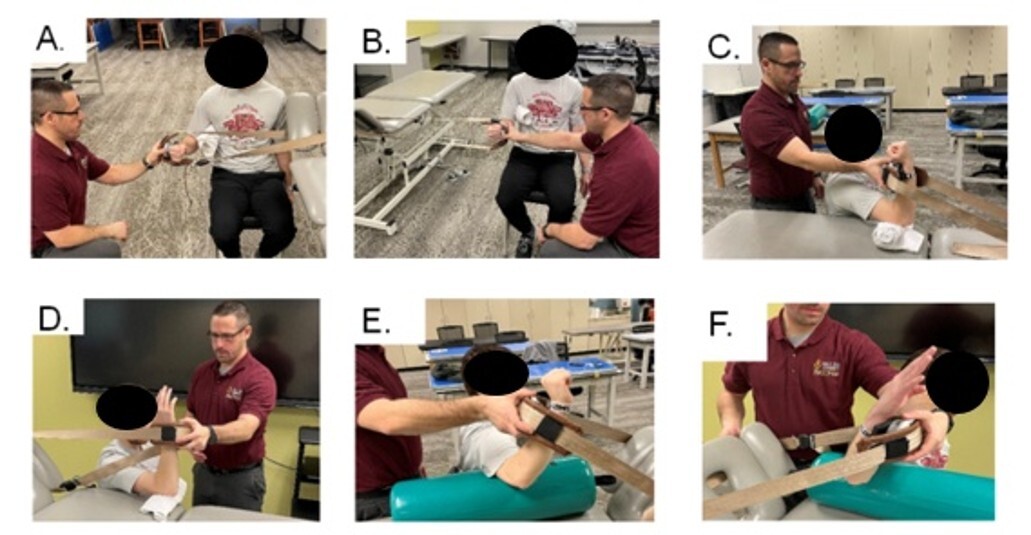
Each athlete completed six different HHD isometric seated strength tests of their throwing arm: shoulder external rotators (ER) and internal rotators (IR) with the arm positioned at the side indicated as neutral (neutral defined as 30° abduction and 30° external rotation); elbow extensors and flexors at 90° shoulder and elbow flexion; and shoulder ER and IR at 90° abduction (ABD), in 90° elbow flexion, and 45° external rotation (Figure 1). All data collected for strength testing was obtained in Newtons (N) of force. Two trials were performed on the same day for each strength measurement. To reduce athlete fatigue, each muscle group was tested in a sequential order, as defined by agonist and antagonist muscle groups, with a two-minute rest period between consecutive trials.20 All strength testing was performed using the MicroFet2 digital handheld dynamometer (Hoggan Scientific, LLC) using a “make” contraction where the force was built gradually by the participant over two seconds and then a maximal isometric contraction was held for five seconds.22,23 During testing, the handheld dynamometer was connected to a belt which was fixed to a stable surface (e.g., table or plinth). The angle of the table was adjusted to achieve optimal degrees of shoulder abduction or flexion. Additionally, the handheld dynamometer was stabilized within the belt by the tester to prevent it from falling. The tester did not apply any external force against the resistance of the athlete. The handheld dynamometer was positioned two centimeters proximally to the subject’s styloid process. The handheld dynamometer was placed on the anterior forearm for shoulder IR and elbow flexor testing, the posterior forearm for shoulder ER, and ulnar side of the wrist for elbow extensors (Figure 1). All strength measures were normalized to each athlete’s throwing arm ulnar length by multiplying their strength measurement by their ulnar length.15 An average of two trials were taken for each strength measurement and used for analysis. A muscular balance strength percentage ratio was then calculated by dividing shoulder ER by IR and the elbow extensors by elbow flexors.7,10
During seasonal participation, each subject was instructed to complete the KJOC once during their season only if they had pain with throwing, and they were provided a written copy of the KJOC to do so. After completion of their baseball season, each athlete’s KJOC and VAS for pain was completed by phone to determine if they were having pain with participation after their respective baseball season. Each KJOC question was rated on a scale of 0 to 100 then each individual question was divided by 10. All 10 questions were added together to obtain a final score out of 100.24 In addition to the KJOC questionnaire, verbal questions included uninterrupted participation throughout the season, participation in other overhead sports, and if they retrospectively had pain with throwing during seasonal play. Athletes were excluded from further analysis beyond the initial assessment if they suffered an injury during their baseball season not associated with their throwing arm that restricted their participation and/or did not participate in throwing on a regular basis greater than seven days.
Statistical analysis for intra-tester reliability was calculated for each strength testing position using the normalized values. Intra-tester reliability was analyzed using a two-way mixed effect model with absolute agreement and single measures.25All reliability was calculated using SPSS (IBM SPSS Statistics, Version 28.0). Standard Error of Measurement (SEM) was calculated using the formula SEM = SD*26 Furthermore, each Minimal Detectable Change (MDC95) value was found utilizing the formula: MDC95= 1.96*SEM*26 Regarding MDC95 values, performance cannot be expected to change by the subject on two trials performed on the same day; however, this data can still provide an estimated threshold for what actual responsiveness to change could be like outside of the conditions within this study.
Descriptive statistical analysis was performed for mean and standard deviations for collected data, normalized strength values, strength percentage ratios (SPRs), pre- and post-season KJOC and VAS scores for all subjects together. Further descriptive data trends for strength values and SPRs were analyzed based on chronological age.
RESULTS
Thirty-four high school-aged male baseball athletes were recruited for this study. Out of 34 athletes, four athletes did not participate in their baseball season and thus were not included in the post-season analysis. All four of these athletes chose not to take part in their baseball season because they simply did not want to participate. All other athletes completed one season of baseball participation. The average age for these athletes was 15.7 (± 1.20) years, with the majority being right-hand dominant and participating either as a position player only or as a pitcher who also played a position in the field (Table 1). Upon entrance into the study, all athletes were throwing without pain as determined by their associated KJOC scores with an average of 92.1/100 (± 7.20). The average VAS for pain with throwing was at 0.28 (± 0.60). Even though each athlete reported no pain with throwing, the athletes who rated their VAS as non-zero had stated they had generalized muscle soreness that would resolve after team workouts, which included upper body resistance training. All participant characteristics for demographic and baseball-related data are shown in Table 1.
The intra-tester reliability for each strength measurement using digital HHD with an EFD and data normalized by ulnar length demonstrated good to excellent reliability with intraclass correlation coefficients (ICC) between .822 - .902, SEM values ranging from 3.55 - 6.47 Newton meters (Nm), and MDC95 values between 8.34 – 18.0 Nm (Table 2).
Collected and normalized mean values for isometric HHD strength for each muscle group/testing position appear in Table 3. The mean strength percentage ratio for shoulder ER/IR in neutral was 64.0% (± 12.31%), elbow extensors/flexors at 70.1% (± 15.9%), and shoulder ER/IR at 90 degrees ABD was 69.7% (± 14.4) (Table 2).
Each strength measurement and strength percentage ratio was also analyzed per year of age (Table 4). The descriptive findings reveal a gradual increase in upper extremity strength as chronological age increased from 14-17 (Table 4). A higher SPR for shoulder ER/IR at 90˚ ABD was descriptively observed for ages 14 and 16.
At the time of the post-season phone call, all subjects did not have pain with throwing as indicated by their KJOC scores and had not filled out the KJOC survey during seasonal play due to pain. No athletes reported participating in other overhead sports and none missed competitive play related to an injury for greater than seven days during their baseball season. Beyond the KJOC questionnaire, five athletes reported retrospectively that they had pain with throwing at some point during their baseball season but not during the time of the phone call. Due to not having pain at the time of the phone call, all five athlete’s post-season KJOC scores were used in the analysis. Post-season KJOC scores for the 30 athletes that participated in baseball seasonal play displayed a mean score of 94.1/100 (SD ± 5.3).
DISCUSSION
The findings from the current study reveal that digital HHD applied with an EFD and normalized using ulnar length can be a reliable method for obtaining strength for the high school-aged baseball athlete. The testing procedures for measuring strength using digital HHD, while applied with an EFD, utilizing a “make” contraction protocol, and normalized to each subject’s ulnar length displayed good to excellent intra-tester reliability. Shoulder ER at 90˚ abduction demonstrated excellent intra-tester reliability while all other strength testing positions displayed good intra-tester reliability. This confirms the alternative hypothesis that digital HHD utilizing an EFD can provide good to excellent internal consistency with the same tester. This was the first study to address the seated position at 90 degrees abduction in mid rotation for shoulder IR and ER for high school-aged baseball athletes. Earlier research has found excellent reliability with higher scores, but this was accomplished by testing individuals from varied sports, applied in other testing positions, and included other age demographics.
The SEM data for shoulder ER in neutral and at 90 degrees abduction had the smallest values of 3.55 and 3.01 Nm, respectively, indicating high precision and accuracy between multiple testing trials. Elbow flexor and extensor musculature displayed the highest SEM values of 6.47 and 5.76 Nm indicating more variability between testing trials. These higher values between trials could be related to positioning with the shoulder at 90 degrees of flexion and/or positioning of the upper extremity next to the table to apply the EFD. In the current study and with the testing methodology used, the SEM values for the measurements tested demonstrate acceptable ranges compared to other literature, indicating an observational trend toward stability. Prior research for the active adult and handball players demonstrated SEM values that can range 2.20 to 6.4 N for the shoulder and elbow; whereas smaller values of 0.39-0.69 Nm for the shoulder are described for 9–12-year-old baseball athletes.14–18
The MDC95 data was utilized in this research to ensure that observed changes exceeding random measurement error could be identified with 95% confidence. It is important to note that performance cannot be expected to change by subjects given two trials performed on the same day; instead, this data provides an estimate threshold. The observed data for the MDC95 reveal lower thresholds that range from 8.34 to 9.68 Nm for shoulder ER in both testing positions. The MDC95 values provide clinical usefulness to determine meaningful change outside of threshold random error, indicating a true improvement in objective performance. In relation to the other observed trends, the higher MDC95 values for shoulder IR and elbow flexors are consistent with other descriptive trends in this research related to chronological age; therefore, a clinician may notice higher values for shoulder IR and elbow flexor strength as age increases versus shoulder ER. Overall, these results suggest that digital HHD can be applied consistently in the above testing positions for high school-aged baseball athletes.
Additional findings reveal pilot strength values that are different from prior available evidence for the older athlete, demonstrating lower strength percentage ratios for baseball athletes of high school-age.7,27–30 Injury risk identification and mitigation has become an important aspect for youth baseball program development and rehabilitation specialists when returning an athlete to sport after injury. Further research is needed to analyze upper extremity strength percentage ratios and their use as a criterion to meet prior to initiation of throwing in the high school-aged baseball athlete, as this group is somewhat small and included fielders and pitchers. How clinicians utilize upper extremity strength data can vary greatly in clinical practice, given that standardization of risk thresholds has shown vast heterogeneity in the literature and has emphasized an older demographic.31 The current results show average strength percentage ratios for shoulder ER/IR with an average of 64.0% with the arm positioned at the side of the body, elbow extensor/flexor of 70.1%, and 69.7% for shoulder ER/IR at 90 degrees abduction for the high school-aged baseball athlete. Prior research has displayed optimal strength percentage ratios for shoulder ER/IR 66-75% at neutral abduction, elbow extensor/flexor ranging from 71-110% , and shoulder ER/IR at 90 degrees abduction greater than 72% for the adult collegiate and professional baseball pitcher.7,27–30 This confirms the alternative hypothesis that, on average, the high school-aged baseball athlete demonstrated lower strength percentage ratios based on prior available evidence used for the adult baseball athlete. Within-limb muscular imbalances can pose a risk of developing throwing-related injuries for the older adult population.7,27–30 This study demonstrates how high school-aged baseball athletes can have a lower strength percentage ratio and not report pain with throwing during seasonal participation. It is important to note that the data pattern observation across age groups revealed a smaller overall increase with age for the elbow extensors and shoulder external rotators at neutral versus the elbow flexors and shoulder internal rotators. This pilot data could provide information regarding strength changes through chronological maturation for this demographic.
There are several limitations in this study that should be acknowledged. While the overall sample size is adequate for reliability analysis, the number of subjects within age-specific cohorts limits statistical analysis and generalizability of these findings. However, the results of this study suggest that future work in larger samples is necessary to generate normative, age stratified values and continued exploration of the relationship between arm strength and pain. Also, it is unknown what current strength training habits were performed by these athletes participating in the study, as well as differences regarding physiological age versus chronological age. Future research should account for any natural maturational differences and external changes influenced by resistance training programs. To account for strength training differences, future research can utilize additional questioning to determine an athlete’s training age or the length of time they have been participating in structured strength training and participation habits.
Intra-tester reliability was good to excellent; however, inter-tester reliability was not established to determine if the same application could be consistent between multiple testers. Testing procedures required the investigator to stabilize the digital handheld dynamometer within the rigid strapping set up and the use of a towel roll during testing with the arm at the side. Other EFD have employed a more stable testing environment to maintain a fixated position. Using an EFD in the testing position of 90 degrees abduction in mid rotation can pose a challenge due to line of pull created from the immovable object and the rigid strap. Methods to fix these limitations could include utilizing an adjustable column that could change with testing height and providing a larger surface area for the digital handheld dynamometer.
CONCLUSIONS
The results of the current study indicate that the use of digital HHD with an EFD, using a “make” contraction, and normalization of data with ulnar length is a reliable method for isometric upper extremity strength testing of the shoulder IR and ER and elbow flexors and extensors in the high school-aged baseball athlete. The pilot data for strength percentage ratios in high school-aged baseball athletes were lower than those historically reported within adult baseball athletes. While the current study was underpowered to make any associations with injury risk, future research focusing on the relationship of strength ratios and injury risk within younger baseball athletes should be investigated.