INTRODUCTION
Wrestling is a combat sport that demands rapid force production from the upper extremities at various shoulder joint angles, especially in elevated positions, due to explosive tackling and grappling movements.1 During sparring, reactive upper limb movements frequently occur in unpredictable situations, necessitating high levels of both stability and mobility in the shoulder joint. This inherent characteristic of the sport places wrestlers at high risk for shoulder joint injuries, with dislocations, rotator cuff tears, and labral tears being commonly reported.2,3
In wrestling, shoulder horizontal adduction, which involves clinching the opponent’s body with both hands, is crucial. The primary muscle responsible for this action is the pectoralis major. Anatomically, it is divided into three parts: the clavicular, sternocostal, and abdominal. It is commonly understood that the muscle length and activity patterns of each part change depending on the shoulder joint position. Specifically, as the shoulder abduction angle increases, the degree of stretch of the pectoralis major changes, resulting in different force production characteristics at maximal abduction, 135° abduction, and 90° abduction.4,5
Pectoralis major ruptures are rare among skeletal muscle injuries and more than 90% of reported cases occur in males, most commonly in weight-training enthusiasts and bodybuilders between 20 and 40 years of age.6 While conservative treatment is sometimes attempted for pectoralis major injuries, surgical intervention is often chosen for athletes aiming to return to competition. Generally, reattachment of the ruptured tendon to the bone (suture fixation) is the standard surgical procedure, and early surgical repair has been reported to provide better outcomes than delayed surgery or conservative treatment.7 In addition, a cross-sectional study by Fleury et al. compared isokinetic shoulder strength between surgically and non-surgically treated male athletes after pectoralis major rupture.8 They reported that surgical treatment was associated with a lower incidence of significant strength deficits, although the magnitude of contralateral strength deficiency did not differ between the surgical and non-surgical groups.8 These findings partially support the operative approach, particularly for athletes. However, to date, no longitudinal evaluation of the return-to-sport process following pectoralis major injury in female athletes has been reported. Due to the scarcity of cases, evidence regarding functional recovery processes, postoperative rehabilitation content, and criteria for return to sport is extremely limited.
Muscle strength evaluation is critical for assessing treatment effectiveness, setting training intensity, and determining return to sport readiness during the recovery process from muscle injury.9 In particular, in combat sports such as wrestling, it is necessary to comprehensively evaluate not only maximal force capacity but also rapid force-generating capacity, which is the ability to generate large forces in a very short period of time,10–13 and force reproducibility, which is the ability to reproduce force output on separate occasions.14,15 After muscle-tendon reconstruction, maximal force production is considered to reflect tissue recovery,16 whereas rapid force production and force reproducibility are regarded as indicators that primarily reflect the recovery of neuromuscular function.13,17 Although isokinetic dynamometry can assess both maximal strength and an aspect of rate of force development (RFD) during dynamic contractions, which may be more ecologically valid for dynamic sport movements, isokinetic dynamometers are large, stationary systems, and testing is often constrained by standardized movement planes and ranges of motion. Therefore, complementary assessments that can be safely and repeatedly performed at clinically relevant shoulder positions may be useful for monitoring recovery after pectoralis major repair.
Recently, the Athletic Shoulder (ASH) test has been introduced as a method to evaluate isometric muscle strength during shoulder extension and horizontal adduction at multiple shoulder abduction angles using a portable force plate.18 Although the ASH test is an isometric assessment and does not directly replicate the dynamic demands of wrestling throughout the range of motion, it offers three key advantages: (1) it allows for evaluation at different shoulder abduction angles, (2) it has demonstrated excellent reliability for each test position, and (3) it enables the assessment of maximal force, RFD, and force reproducibility through repeated trials. These characteristics make the ASH test a potentially valuable tool for evaluating the recovery of muscle strength and neuromuscular function throughout the postoperative rehabilitation process.
Therefore, this case report details a rare case of pectoralis major injury treated with surgical repair in a female wrestler, with a comprehensive evaluation of shoulder muscle strength recovery from the postoperative period to return to competition using the ASH test. The purpose of this case report was to provide detailed information regarding quantitative assessment of postoperative recovery, focusing on maximal and rapid isometric force production following pectoralis major tendon repair in a world-class female wrestler. The findings may contribute to the limited evidence regarding the clinical use of ASH testing to monitor postoperative shoulder strength and neuromuscular function in a female athlete after pectoralis major repair.
CASE DESCRIPTION
The subject was a female wrestler in her 20s. (Height and weight are withheld to protect privacy and prevent identification.) She competed at the international level and was categorized as a Tier 5 athlete according to the classification framework proposed by McKay et al.19 This study was approved by the Institutional Research Ethics Committee (approval number 2021-057-3), and the athlete provided written informed consent, including consent for publication of this case report.
She had regular weight training experience, with a pre-injury bench press one-repetition maximum (1RM) of 1.1 times her body weight. Regarding her shoulder injury history, she had experienced multiple right shoulder labral tears and left rotator cuff tears in the five years prior to the right pectoralis major injury and occasionally experienced discomfort in both shoulders. She had been experiencing mild pain in her right pectoralis major during practice for ten days before the main injury event. Despite the persistent mild pain, she participated in an official match. While clinching the opponent during the match, she felt a sudden exacerbation of pain in her right pectoralis major (accompanied by a popping sound), making it impossible to continue competing at that moment.
After the injury, magnetic resonance imaging revealed no damage to the clavicular head but indicated a rupture of the sternocostal and abdominal heads of the right pectoralis major at their humeral attachment. Tendon repair surgery was performed six days after the injury event.
Postoperative rehabilitation was progressively managed by physical therapists. Early postoperative rehabilitation (weeks 0-4) focused on shoulder joint range of motion exercises and isometric contractions of the pectoralis major. From weeks 5-8, low-load resistance exercises using resistance bands and tubing were introduced. By postoperative week 6, full passive range of motion was achieved in flexion, abduction, and external rotation. Internal rotation at 90° of shoulder abduction was 55° and remained 55–60° during the rehabilitation support period. Resistance training commenced gradually from week 9. From postoperative week 9, free-weight training was initiated, along with the progressive incorporation of sport-specific elements and closed kinetic chain (CKC) exercises, such as push-ups, rope climbing, and assisted pull-ups.
Beginning at postoperative week 14, wrestling-specific drills (repetitive tackling practice) were initiated. At postoperative week 16, defense-focused sparring (practical interpersonal drills) began, with additional training focusing on eccentric strengthening and overall scapular stabilization. During this period, the subject also experienced discomfort stemming from a history of shoulder injuries, leading to the implementation of a comprehensive rehabilitation program including exercises around the scapular girdle. At postoperative week 18, the subject transitioned to unrestricted sparring and fully returned to regular competitive training. At postoperative week 24, the subject competed in an official match and achieved competitive results comparable to those prior to the injury.
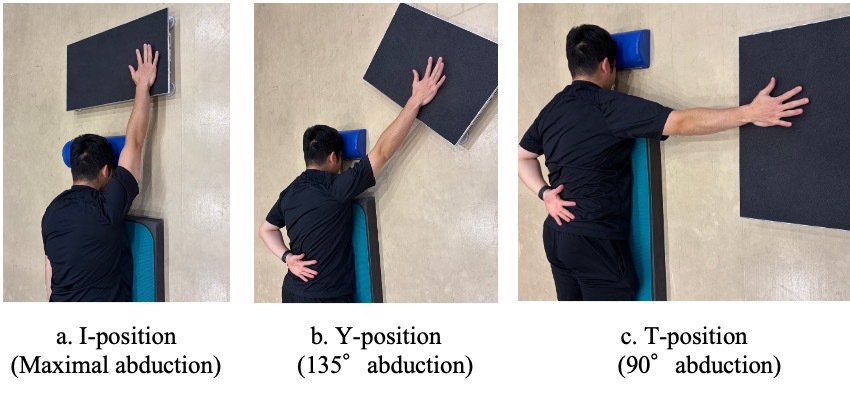
Quantitative muscle strength evaluation using the ASH test commenced at postoperative week 6, after the physical therapists confirmed that the subject could perform submaximal isometric contractions without pain in three test positions: the I-position (maximal shoulder abduction in the frontal plane), Y-position (135° of shoulder abduction in the frontal plane), and T-position (90° of shoulder abduction in the frontal plane). Assessments were conducted from postoperative week 6 through week 16, spanning the progressive loading phase and early return-to-sport progression. They were generally performed around the middle of each postoperative week, although the exact testing day varied according to the athlete’s availability and training schedule. The week-14 assessment was performed after wrestling-specific training had been initiated. No assessment was conducted at postoperative week 15 because of the subject’s schedule. A detailed summary of the postoperative rehabilitation progression, including phase-specific goals, representative interventions, supervised rehabilitation frequency, ASH test findings, and criteria for progression or modification, is provided in Appendix A. Progression was determined based on a combination of pain response, shoulder range of motion, exercise tolerance, sport-specific task tolerance, and ASH test findings. Final return-to-sport clearance was provided by the physician after considering clinical and functional findings.
OUTCOMES
Methods of ASH Test Measurement
The ASH test was conducted based on the methods described by Ashworth et al.18 The test was administered by a licensed Athletic Trainer with 10 years of clinical experience. All measurements were conducted in a training gym. The subject lay prone with the neck in a neutral position. Measurements were performed at three upper limb positions: the I-position, Y-position, and T-position (Figure 1). The subject placed one hand, with the forearm pronated and elbow extended, on a uniaxial portable force plate at a sampling rate of 1000 Hz (Hawkin Dynamics, Westbrook, Maine, USA). The force plate was zeroed at each test position prior to data acquisition to ensure measurement accuracy.
_test_using_a_uniaxial_force_plate__w.jpeg)
Prior to the measurements, as a standardized preparation, two submaximal practice trials at approximately 70–90% of maximal strength were performed for each test position, followed by a rest period of at least 30 seconds. For the main measurement, three maximal effort trials were performed at each position, with at least 30 seconds of rest between trials. Measurements were conducted in the order of I-position, Y-position, and T-position, starting with the contralateral side. The order of test positions was fixed because the ASH test was used as a repeated clinical monitoring tool during postoperative rehabilitation, and consistency across weekly assessments was prioritized to allow longitudinal within-athlete comparison. A 1-minute rest was provided between test positions. The subject was instructed to place her hand on the force plate at the designated elevation angle, remain still for at least 1 second, and then push the force plate “as fast and as hard as possible” for 3 seconds following the examiner’s “Ready” and “Go” commands. If the subject reported discomfort or pain during warm-up or testing, testing in the painful position was discontinued.
Measurement data were processed using proprietary Hawkin Dynamics software. Net peak force (NPF; N), defined as the maximal net force after subtracting the weight of the upper limb, and net force at 200 ms (NF200; N), defined as the net force produced 200 ms after force onset, were used as primary outcome measures. The average of three trials was taken as the representative value. NF200 was adopted as an indicator of rapid force production, considering measurement reliability.
For this report, descriptive statistics were primarily used to evaluate the longitudinal changes in a single case. Differences between the operated and contralateral sides were evaluated using the Limb Symmetry Index (LSI), calculated as follows: LSI = [(operated side - contralateral side) / (operated side + contralateral side)] × 100. Percentage changes from the initial measurement at postoperative week 6 to postoperative week 11 were calculated as follows: Percentage changes = [(value at week 11 - value at week 6) / (value at week 6)] × 100. The coefficient of variation (CV) was calculated as an index of force reproducibility. The CV was expressed as a percentage by dividing the standard deviation by the mean for NPF and net force values at 50, 100, 150, 200, and 250 ms, and multiplying by 100. Generally, a CV of 10% or less is considered good reliability for muscle strength measurement.20 For each measurement item, the CV value over the entire measurement period was calculated and reported with its 95% confidence interval. Each ASH test outcome was used as one component of rehabilitation progression rather than as a stand-alone criterion. NPF was used to monitor recovery of maximal force production and to guide progression of resistance exercise intensity. Position-specific deficits in NPF and NF200 were used to guide gradual exposure to training in overhead positions and contact drills. NF200 was used to monitor rapid force production and to inform the need for plyometric training and reconditioning. As supportive information, LSI was used to describe side-to-side differences, whereas CV was used to identify inconsistent force production that may reflect altered neuromuscular control.
Testing Schedule and Adherence
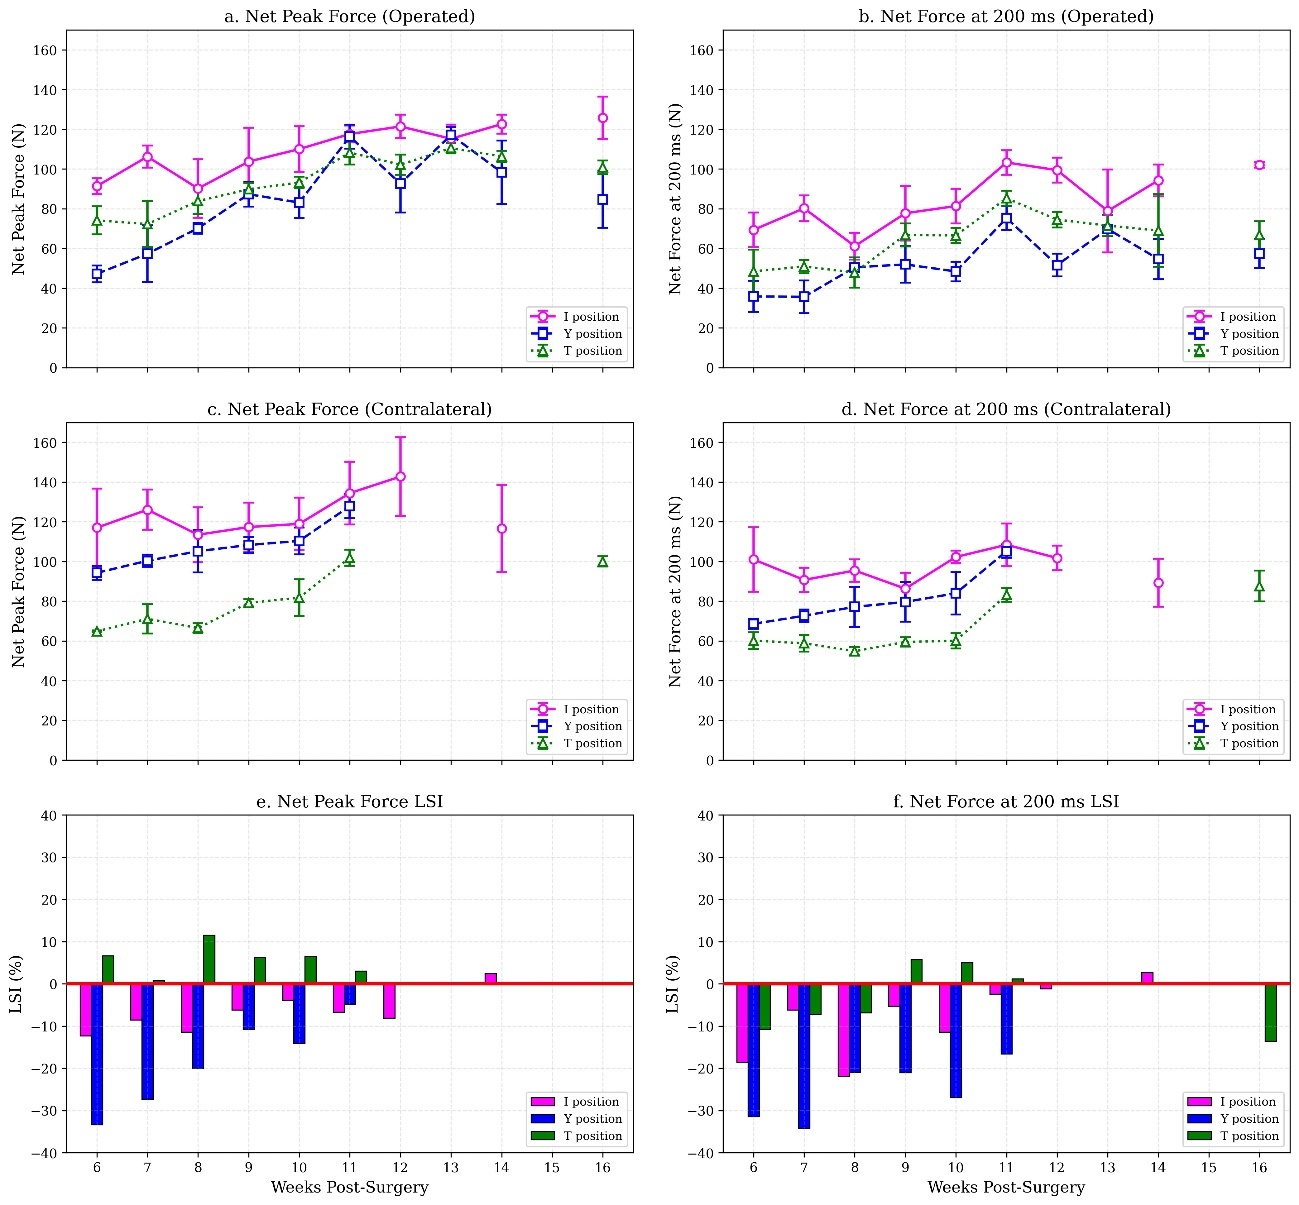
Quantitative muscle strength assessments using the ASH test were performed from postoperative week 6 to week 16. However, from postoperative week 12 onward, due to shoulder discomfort related to the subject’s previous history of shoulder injuries, some measurements were discontinued, particularly in the contralateral Y-position. The ASH test measurement results are presented in Table 1 and Figure 2.
__net_force_at_200_ms_(nf_200_)__and_their_res.jpeg)
Maximal Muscle Strength (Net Peak Force: NPF)
The contralateral side consistently showed higher NPF values in the order of I-position > Y-position > T-position at all measurement time points for which data were available for all three positions (Week 6 to Week 16) (Figure 2c). The operated side generally showed higher values in the order of I-position > T-position > Y-position for most measurement weeks. However, the order changed to I-position > Y-position > T-position at postoperative week 11 and Y-position > I-position > T-position at postoperative week 13 (Figure 2a).
From postoperative week 6 to week 11, the operated side’s maximal muscle strength increased by 28.8% in the I-position, 146.4% in the Y-position, and 46.0% in the T-position. The largest increase was observed in the Y-position, where the initial force at week 6 was the lowest among the three positions. The LSI for NPF at the initial measurement (postoperative week 6) was -12.3% in the I-position and -33.3% in the Y-position. This improved to -6.7% and -4.8%, respectively, by week 11. Notably, in the T-position, the operated side had a positive LSI of 6.7% at week 6, indicating greater NPF than on the contralateral side, and positive LSI values were maintained throughout the measurement period at all time points for which bilateral data were available (Figure 2e). After postoperative week 12, the operated side’s NPF temporarily decreased across all positions but then showed a recovery trend in the I-position at postoperative week 16.
Rapid Force Production (Net Force at 200 ms: NF200)
The contralateral side generally showed higher NF200 values in the order of I-position > Y-position > T-position across all positions (Figure 2d). In contrast, NF200 values on the operated side generally followed a different pattern, with the order of I-position > T-position > Y-position (Figure 2b).
From postoperative week 6 to week 11, NF200 on the operated side increased by 49.1% in the I-position (from 69.3 to 103.3 N), 110.3% in the Y-position (from 35.8 to 75.3 N), and 75.7% in the T-position (from 48.5 to 85.2 N), with a particularly large improvement in the Y-position (Table 1, Figure 2). At postoperative week 6, the LSI for NF200 was -18.6% (I-position), -31.4% (Y-position), and -10.8% (T-position). By week 11, these values had improved to -2.4% (I-position), -16.6% (Y-position) and 1.2% (T-position) (Figure 2f). Despite the operated side showing higher maximal strength (NPF) than the contralateral side in the T-position, NF200 on the operated side remained lower than the contralateral side until postoperative week 8, improving thereafter from week 9.
Muscle Strength Changes during Return to Sport Process
After the commencement of wrestling-specific training at postoperative week 14, the operated side’s NPF and NF200 temporarily decreased in some positions. This decrease was particularly pronounced in the Y-position, where it reduced by approximately 27% (from 116.3 N at week 11 to 84.7 N by week 16). However, in the I-position, force production was maintained or improved after postoperative week 14, reaching its maximal value at postoperative week 16.
Coefficient of Variation in Force Measurements (Table 2)
The CV values are shown in Table 2. For NF200, CV values for the contralateral side were 8.8% (I-position), 8.3% (Y-position), and 5.9% (T-position). The CV values for NF200 on the operated side were 10.9% (I-position), 12.6% (Y-position), and 11.3% (T-position).
For the contralateral side, all NF200 CV values were below the commonly accepted threshold of 10%,20 confirming good measurement reliability, and showing better reliability compared to Net Force at 150 ms. The operated side showed higher CV values than the contralateral side in all positions, with the largest difference observed in the T-position (5.4% difference: 5.9% vs. 11.3%).
On the other hand, in NPF, the contralateral side had a higher CV value than the operated side in the I-position (I-position: 12.9% vs 8.0%, Y-position: 5.3% vs 11.2%, and T-position: 5.0% vs 6.5%).
DISCUSSION
This report is the first to quantitatively evaluate the muscle strength recovery process during postoperative rehabilitation in a female wrestler following pectoralis major reconstruction, using a uniaxial force plate. The use of the ASH test allowed for a detailed examination of changes in isometric force production characteristics at different shoulder abduction angles through joint-angle-specific strength evaluation.
Characteristics of Maximal Strength Recovery and Joint Angle Specificity
Regarding maximal strength (NPF), the contralateral side consistently showed higher values in the order of I, Y, and T positions throughout the measurement period. In contrast, the operated side tended to show higher values in the order of I, T, and Y-positions, except at postoperative weeks 11 and 13. This discrepancy is likely attributable to the anatomical characteristics of the pectoralis major and the impact of surgical intervention. In this case, no injury to the clavicular head was observed, but damage to the sternocostal and abdominal heads was identified. Therefore, it was hypothesized that recovery of the operated side in the Y-position, where the abdominal portion of the pectoralis major muscle is easily stretched and shows high activity, was delayed because of scar tissue formation and tissue repair processes after surgery.4,5
Interestingly, from the early postoperative stages, the operated side demonstrated higher values of maximal strength than the contralateral side in the T-position (90° abduction). This pattern differs from previous research in male athletes reporting an average 10–20% deficit in horizontal adduction strength on the surgically treated side.8 Taken together, this discrepancy suggests that, in this case, surgical repair may have modified the length–tension relationship of the pectoralis major across different abduction angles, thereby altering angle-specific force production. Similar angle-specific changes have been reported after Achilles tendon repair, where persistent end-range weakness has been observed.21
From a clinical perspective, limb symmetry in maximal strength improved substantially by postoperative week 11, with limb symmetry indices of -6.7% in the I-position and -4.8% in the Y-position. Particularly in the Y-position, there was a marked improvement from -33.3% at the initial evaluation, indicating that approximately 11 weeks were required for meaningful restoration of horizontal adduction strength symmetry after surgical repair. However, because the initial Y-position value was the lowest among the three test positions, the magnitude of improvement may partly reflect recovery from initially pain-inhibited or apprehension-limited force production rather than a position-specific strength adaptation alone.
Rapid Force Production Recovery and Neuromuscular Function
In this study, NF200, which exhibited stable CV values on the contralateral side across all test positions, was adopted as an indicator of rapid force production. (Net Force at 150 ms; I: 11.4%, Y: 9.3%, T: 8.6%, NF200; I: 8.8%, Y: 8.3%, T: 5.9%) From a physiological perspective, it is important to understand the changes in factors influencing force production over time. Generally, early time points in force production (around 0-100 ms) are strongly influenced by neural factors (motor unit recruitment patterns and firing frequency), while later time points (after 200 ms) are more strongly influenced by maximal strength components.22,23 It is plausible that the 150 ms time point showed greater variability due to the strong influence of neural factors, while the 200 ms time point yielded more reliable results due to a more stable balance between neural and muscular factors.
The recovery pattern of NF200 showed distinct characteristics compared to maximal strength. Particularly in the Y-position, while the limb symmetry for maximal strength improved to -4.8% at week 11, the LSI for NF200 remained at -16.6%. Moreover, in the T-position, despite the operated side exceeding the contralateral side in maximal strength, the NF200 on the operated side remained lower until week 8. It is suggested that not only muscle mass and strength, but also neural factors such as motor unit synchronization, reciprocal inhibition regulation, and intermuscular coordination play crucial roles in rapid force production.22 Therefore, in this case, changes in neuromuscular control due to pain or anxiety at the surgical site, or central nervous system maladaptation due to prolonged activity restriction, may have impaired the ability to produce force in short durations. The improvement rates of NF200 from postoperative week 6 to week 11 were 49.1% in the I-position, 110.3% in the Y-position, and 75.7% in the T-position, with particularly large improvements in the Y- and T-positions. This indicates a gradual recovery of rapid force production ability in stretched positions, suggesting the importance of joint-angle-specific training.
Force Reproducibility on Contralateral and Operated Sides
An important finding was the clear difference in CV values for NF200 between the contralateral and operated sides. The contralateral side showed CV values below 10% across all positions (I: 8.8%, Y: 8.3%, T: 5.9%), whereas the operated side showed values above 10% in all positions (I: 10.9%, Y: 12.6%, T: 11.3%). The T-position showed the largest difference, with 5.9% on the contralateral side versus 11.3% on the operated side. Factors such as discomfort during tissue repair, fear of re-injury, changes in proprioception, and non-uniformity of tissue repair may have impaired force production on the operated side, consequently leading to decreased force reproducibility.24,25 Evaluating not only maximal force production but also force reproducibility is crucial when returning to sports that require repeated submaximal force production. In contrast, NPF showed different patterns across positions. While the I-position demonstrated lower CV values on the operated side (CV: 8.0% vs 12.9%), the Y-position and T-position showed higher values (Y: 11.2% vs 5.3%, T: 6.5% vs 5.0%). This pattern suggests that side-to-side differences in force reproducibility during NPF may be influenced not only by injury status but also by limb dominance and task-specific motor control. Ashworth et al. reported low reliability for the I-position in the non-dominant upper limb,18 and the present findings may reflect a similar tendency in that the I-position on the contralateral (often non-dominant) side showed greater variability (higher CV) than on the operated side.
Changes during Rehabilitation and Return to Sport
In this case, most measurement values continuously improved until postoperative weeks 11 to 13. However, a temporary decrease was observed following the initiation of wrestling-specific drills at postoperative week 14. This decline was most evident in the Y-position, where NPF reached its maximal value at postoperative week 13 (117.1 N) but decreased by approximately 28% to 84.7 N by week 16. At postoperative week 14, both the Y- and T-positions showed decreases in NF200 accompanied by increases in CV, indicating reduced force reproducibility.14,15,17 Several factors may have contributed to these changes. First, accumulated muscle fatigue due to the increased intensity of wrestling-specific training and weight training may have impaired force production. Second, the Y-position may have been particularly sensitive to this increased loading and/or fatigue because the shoulder is placed in an elevated position in which the sternocostal and abdominal portions of the pectoralis major are likely to be elongated and mechanically stressed. In addition, shoulder discomfort on the contralateral side may have influenced force production on the operated side and in other test positions through pain-related neuromuscular inhibition.26,27 From a neuromuscular perspective, the reduction in early-phase force and increased CV likely reflect fatigue-related alterations in neural drive to the shoulder musculature. These may include reduced initial motor unit discharge rates, impaired recruitment of high-threshold motor units, and disturbed intermuscular coordination, which are known determinants of early RFD.22,23 Conversely, force production ability in the I-position was maintained or improved even after the resumption of wrestling-specific training. Owing to the consistently high force generated in the I-position, it is possible that fatigue did not substantially affect performance in this position. These results highlight the importance of continued reconditioning and regular monitoring through repeated assessments even after return to sport.
Clinical Utility and Practical Implications of the ASH Test
The ASH test used in this report can be a useful tool to quantitatively evaluate joint-angle-specific muscle strength recovery by assessing shoulder extension and horizontal adduction strength at three different shoulder abduction angles. Although the ASH test is an isometric assessment and does not directly replicate the dynamic nature of wrestling maneuvers, it may be feasible and easy to implement during postoperative rehabilitation because it does not require joint movement and allows repeated monitoring across multiple shoulder positions.
Furthermore, in this case, even in the T-position, which showed relatively high NPF at the start of measurement, the recovery of rapid force production took time. This demonstrated the importance of evaluating short-duration force production characteristics through force-time curve analysis, not just maximal strength. Additionally, since there were differences in the recovery processes of maximal strength and rapid force production, and recovery patterns varied depending on the shoulder abduction angle, evaluation in postures resembling those used in sport-specific movements and progressive training are recommended.
Limitations
This case report has several limitations. First, the construct validity of the ASH test should be considered. Although the ASH test was selected because its test positions involve shoulder extension and horizontal adduction, which are relevant to pectoralis major function, the test may reflect integrated shoulder girdle function, including contributions from the rotator cuff, deltoid, latissimus dorsi, and scapular stabilizers rather than isolated pectoralis major function. Because the present athlete had a history of bilateral shoulder injuries and discomfort in the contralateral shoulder during rehabilitation, and because no pre-injury baseline data or additional assessments related to the previous shoulder injuries were available, the influence of these factors could not be distinguished from the effects of recovery from pectoralis major repair. Second, LSI values should be interpreted cautiously. Although the contralateral side was used as the reference limb, it may not have represented a healthy and unaffected comparator. After postoperative week 12, some measurements could not be completed because of shoulder discomfort. Consequently, LSI values should not be interpreted as definitive indicators of recovery. Third, pain and fear may have limited testing in this study. During the initial monitoring phase, force was produced only within self-tolerated pain levels, such that the values may not represent true maximal muscle strength. Strength data in the initial monitoring phase should be interpreted cautiously. Furthermore, even after the resumption of wrestling-specific training, pain in the ASH test positions occasionally prevented measurement, including on the contralateral side, suggesting inadequate glenohumeral centration in elevated positions. These findings highlight the need to confirm adequate shoulder function before the ASH test and to manage risk during testing. Fourth, this report did not include patient-reported outcomes or detailed training-load monitoring data. Measures such as pain, perceived shoulder function, confidence, fear of re-injury, and internal and external training load would have strengthened the clinical interpretation of the force-plate data and helped inform return-to-sport decision making. In addition, this report focused primarily on NPF, NF200, and CV. Other force-plate-derived variables, such as time to peak force, impulse, and force at earlier time points, may provide additional information regarding neuromuscular recovery; however, their reliability and physiological meaning during the ASH test after pectoralis major repair require further investigation. Future studies should combine force-plate assessment with patient-reported outcomes and load monitoring, and should include larger samples and complementary assessments, such as electromyography, to better inform return-to-sport decision-making.
CONCLUSION
This case report is the first to quantitatively evaluate the characteristics of muscle strength and neuromuscular recovery, focusing on both maximal isometric strength and rapid isometric force production, during the return-to-sport process after pectoralis major repair in a female wrestler. The results indicated that (1) the recovery processes of maximal strength and rapid force production differed, (2) recovery patterns varied specifically depending on the shoulder abduction angle, and (3) a temporary decrease in strength occurred after the resumption of wrestling-specific training.
In the current athlete, repeated ASH testing appeared to support clinical monitoring by detecting changes across different shoulder positions and in the timing of force production that were not fully reflected by maximal strength alone. These findings suggest that monitoring rapid force production and position-specific shoulder force may have been useful during this individual return-to-sport process. Future studies with larger samples are needed to determine whether force production characteristics differ according to sex and sport.
FUNDING
The authors declared that financial support was received for this work and/or its publication. This study was conducted as part of the Enhancement of the Japan High Performance Sport Center Infrastructure through Technology Innovation Project, commissioned by the Japan Sports Agency.
CONFLICT OF INTEREST
The authors declare no conflicts of interest.
ACKNOWLEDGEMENTS
The authors gratefully acknowledge Iñigo Mujika of the University of the Basque Country for his valuable advice and comments during the preparation of this manuscript. The generative artificial intelligence large language model ChatGPT (OpenAI, San Francisco, CA, USA) was employed to support English-language editing and academic writing refinement.